Saturday, October 26, 2013

Earthquake hits waters off Japan

An earthquake with a magnitude of 7.3 on the Richter scale hit the waters 231 miles (371 kilometers) east of Japan on October 25, 2013, reports rt.com, adding that the quake prompted an evacuation at the devastated Fukushima Daiichi plant and that strong tremors could be felt on Japan’s main Honshu Island, as well as on the northern island of Hokkaido.

USGS.gov reported the quake as having a magnitude of 7.1 followed up by several smaller quakes, as indicated on the image below, which also indicates the location of Fukushima.

[ click to enlarge ]

The image below shows that methane readings of 1950+ were recorded on and around the location where the earthquake hit. The image merely shows methane that did enter the atmosphere. More methane will have escaped from the seabed, but much of it will have oxidized in the water.


The occurence of this earthquake is very worrying, due to the situation at the Fukushima Daiichi nuclear plant. It is also relevant to the situation in the Laptev Sea, north of Siberia, for a number of reasons, including: 
  1. As the above image clearly shows, earthquakes can trigger methane releases from the seabed, as previously discussed in the post Methane Release caused by Earthquakes.
  2. Global warming is contributing to the occurance of earthquakes. For years, geophysical hazard specialist Bill McGuire has studied this impact of global warming, in particular the Earth's crust bouncing and bending in response to the melting of the great ice sheets and the filling of the ocean basins—dramatic geophysical events that triggered earthquakes, spawned tsunamis, and provoked a series of eruptions from the world's volcanoes. Bill McGuire warns that staggering volumes of melt water poured into the ocean basins, warping and bending the crust around their margins. The resulting tossing and turning provoked a huge resurgence in volcanic activity, seismic shocks, and monstrous landslides—the last both above the waves and below.

    According to calculations posted by Doyle Doss in January 2012, the increase in weight of the Pacific Ocean over the last 50 years due to freshly introduced water from land ice melt is 10 Trillion 331 Billion 125 Million 200 Thousand TONS. In conclusion, global warming is making methane releases triggered by seismic activity worse. 
  3. The fault lines around Japan are interconnected with other fault lines, as illustrated by the image below, from the post High Methane Levels over Laptev Sea, showing methane readings on October 20, 2013 pm. Earthquakes can trigger further earthquakes, especially along the same or interconnected fault lines. 


The image below shows methane readings on October 25, 2013 pm, indicating that high methane readings continue to be recorded over the Laptev Sea.

[ click to enlarge ]
The above image also shows that the Laptev Sea was hit by an earthquake with a magnitude of 4.6 on the Richter scale on September 28, 2013. Earlier, on August 7 and on September 9, earthquakes with similar magnitudes had hit the Laptev Sea closer to land, as described in the post Earthquake hits Laptev Sea.

For more than a month, large amounts of methane have been present over the Arctic Ocean, in particular over the Gakkel Ridge and, more recently, also over the Laptev Rift.

Sediments under the Arctic Ocean contain huge amounts of methane in the form of hydrates and free gas. Some areas, such as the Gakkel Ridge and the Laptev Rift are prone to earthquakes, volcanoes and landslides, as they are part of a tectonic fault line that crosses the Arctic Ocean.

The danger is that, as the permafrost retreats and the snow and ice cover declines rapidly, methane in the Arctic is on the brink of being released abruptly and in large quantities from the seabed. A single earthquake, perhaps even outside of the Arctic Ocean could set this off. There are many more factors that influence seismic activity, such as the position of sun, moon and stars, and the depth at which seismic activity occurs, as tremors can be felt far away from earthquakes that occur at greater depth. Anyway, the danger is that earthquakes will trigger abrupt release of methane from the seabed of the Arctic Ocean, and since methane is a powerful greenhouse gas, such a release could further accelerate local warming, triggering further destabilization of methane in the seabed, escalating into abrupt climate change across the globe.

The depth of the seabed is also important in this regard, since shallow seas can warm up rapidly, while methane that escapes from the seabed has less chance to get oxidized in shallow seas. Large parts of the Arctic Ocean are very shallow, in particular the Laptev Sea, as further descibed in the post methane hydrates.


Thursday, October 24, 2013

Epic Methane Releases from East Siberian Arctic Shelf

By Harold Hensel

[ click to enlarge ]

This is epic! Keep watching the Laptev and East Siberian Sea. This is a very dangerous place for methane to come up. Huge amounts of methane hydrates are stored below. They have been frozen there safely for over 10,000 years.

We are witnessing the thawing and large release of methane from this area for the first time in over 10,000 years. The fear is that at a critical point there may be a catastrophic sudden burst of methane from this area. This would more than likely trigger runaway global warming.

We could be watching the beginnings of this. If the red on the 1750 ppb and the yellow on the 1950 ppb setting on the methanetracker.org keeps spreading and intensifies, we are watching it happen. I hope this is an anomaly and these areas return to little or no activity.


Harold Hensel is at Facebook as facebook.com/mhhensel

Are Alberta’s Tar Sands prepared for a torrential rain event?

by Paul Beckwith

In recent months we have endured incredible tropical-equatorial-like torrential rain events occurring at mid-latitudes across the planet. For example, in North America we experienced intense rainfall in the Banff region of the Rockies from June 19th to 24th and the enormous volume of water moved downhill through the river systems taking out small towns and running into the heart of Calgary where it caused $5.3 billion dollars of infrastructure damage; the largest in Canadian history.

Next, it was Toronto’s turn, with 75 mm of rain falling from 5 to 6pm on July 8 (with up to 150 mm overall in some regions) leading to widespread flooding and $1.45 billion dollars in damages. As bad as these events were, they were dwarfed by the intense rainfalls hitting the state of Colorado from Sept 9th to 15th.

Rainfall amounts that would normally fall over 6 months to a year were experienced in less than a week. Widespread flash floods, landslides, and torrents of water ripped apart roads, fracking equipment and pipelines on (at least) hundreds of fossil fuel sites (mostly ignored by mainstream media) (http://www.desmogblog.com/2013/09/19/media-ignores-damaged-oil-and-gas-tanks-colorado-floods). The level of destruction was simply horrifying, as captured by a man with a plane and a camera. But we have no grounds for complaint, since the widespread flooding in central Europe from May 30th to June 6th caused a much larger $22 billion in damages.

So what is happening? Why are we experiencing so many of these severe weather flooding events that are supposed to only occur every 1000 years or so? Will they keep occurring? What city will be hit next? Can the Alberta tar sands be hit by such an event? What would be the implications?

Abrupt Climate Change In Real-Time

Humans have benefited greatly from a stable climate for the last 11,000 years - roughly 400 generations. Not anymore. We now face an angry climate. One that we have poked in the eye with our fossil fuel stick and awakened. Now we must deal with the consequences. We must set aside our differences and prepare for what we can no longer avoid. And that is massive disruption to our civilizations.

In a nutshell, the logical chain of events occurring is as follows:
  1. Greenhouse gases that humans are putting into the atmosphere from burning fossil fuels are trappingextra heat in the earth system (distributed between the oceans (93%), the cryosphere (glaciers, ice sheets, sea ice for 3%), the earth surface (rocks, vegetation, etc. for 3%) and the atmosphere (only an amazingly low 1%). The oceans clearly get the lions share of the energy, and if that 1% heating the atmosphere varies there can be decades of higher or lower warming, as we have seen recently. This water vapor rises and cools condensing into clouds and releasing its stored latent heat which is increasing storm intensity.
  2. (i)Rapidly declining Arctic sea ice (losing about 12% of volume per decade) and (ii)snow cover (losing about 22% of coverage in June per decade) and (iii)darkening of Greenland all cause more solar absorption on the surface and thus amplified Arctic warming (global temperatures have increased (on average) about 0.17oC per decade, the Arctic has increased > 1oC per decade, or about 6x faster)
  3. Equator-to-Arctic temperature difference is thus decreasing rapidly
  4. Less heat transfer occurs from equator to pole (via atmosphere, and thus jet streams become streakier and wavier and slower in west-to-east direction, and via ocean currents (like Gulf Stream, which slows and overruns continental shelf on Eastern seaboard of U.S.)
  5. Storms (guided by jet streams) are slower and sticking and with more water content are dumping huge torrential rain quantities on cities and widespread regions at higher latitudes than is “normal”.
  6. A relatively rare meteorological event called an “atmospheric river” is now much more common, and injects huge quantities of water over several days to specific regions, such as Banff (with water running downhill to Calgary) and Toronto and Colorado events.
It is well past the time that politicians and governments need to act to address these issues. This breakdown of the global atmospheric circulation pattern is well underway now, with a global average temperature only 0.8oC above the pre-industrial revolution levels. With extreme weather events this terrible now, it is highly irrational, in fact reckless, to continue to have global meetings and discussions about whether or not 2oC is safe. Only 0.8oC is wreaking havoc on global infrastructure today. As climate change proceeds and accelerates and we move further from the stable state that we are familiar with (“old climate”) to a much warmer world (“new climate”) we will experience worsening weather extremes and a huge “whiplashing” of events (throughout our present “transition period”).

For a notion of whiplashing, consider the Mississippi River. There were record river flow rates from high river basin rainfall in 2011, followed by record drought and record low river water levels in December, 2012 making it necessary for the U.S. Army Corp of Engineers to hydraulically break apart rock on the riverbed to keep the countries vital economic transportation link open to barge traffic. Then, 6 months later, the river was back up to record levels. Incredible swings of fortune.

Mitigation at a global level is dysfunctional and inadequate

Adaption has not worked out too well for Calgary, or Toronto, or Colorado, or numerous other places. Let us not be surprised when a similar torrential rain event hits Ottawa, or Vancouver, or even the Alberta tar sand tailing ponds. In Alberta, tailings ponds would be breached and the toxic waters would overflow the Athabasca River and carry the pollutants up into the north to exit into the Arctic Ocean. Such an event would be catastrophic to the environment and economy of Canada.

How can this risk be ignored? Will the latest IPCC (Intergovernmental Panel on Climate Change) report AR5 released on September 27th once again be ignored by society?


Paul Beckwith is a part-time professor with the laboratory for paleoclimatology and climatology, department of geography, University of Ottawa. He teaches second year climatology/meteorology. His PhD research topic is “Abrupt climate change in the past and present.” He holds an M.Sc. in laser physics and a B.Eng. in engineering physics and reached the rank of chess master in a previous life.

Monday, October 21, 2013

High Methane Levels over Laptev Sea

A major fault line crosses the Arctic Ocean, forming the boundery between two tectonic plates, the North American Plate and the Eurasian Plate. These plates slowly diverge, creating seismic tension along the fault line.


From where the Mid-Atlantic ridge enters the Arctic Ocean, it is called the Gakkel Ridge. The fault continues as the Laptev Sea Rift, on to a transitional deformation zone in the Chersky Range in Siberia, then the Ulakhan Fault between the North American Plate and the Okhotsk Plate, and then continues as the Aleutian Trench to the end of the Queen Charlotte Fault system.


Above map shows the location of some of the main points of interest, i.e. the Laptev Sea Rift and the Gakkel Ridge, where high methane readings have been recorded recently, as shown in the image below. Indicated in yellow are all methane readings of 1950 ppb and over, for a period of just over one day, October 19 - 20, 2013.  


To pointpoint more closely where methane is venting along the Laptev Sea Rift, the image below gives readings for October 20, 2013, pm, at just three altitudes (607 - 650 mb). 


This is a very dangerous situation, since high levels of methane have been recorded over the Arctic Ocean for more than a month now. Furthermore, large amounts of methane have vented in the Laptev Sea area in previous years. Added below is an edited part of a previous post, Unfolding Climate Catastrophe

In September 2005, extremely high concentrations of methane (over 8000 ppb, see image on the right) were measured in the atmospheric layer above the sea surface of the East Siberian Shelf, along with anomalously high concentrations of dissolved methane in the water column (up to 560 nM, or 12000% of super saturation).

The authors conclude: "Since the area of geological disjunctives (fault zones, tectonically and seismically active areas) within the Siberian Arctic shelf composes not less than 1-2% of the total area and area of open taliks (area of melt through permafrost), acting as a pathway for methane escape within the Siberian Arctic shelf reaches up to 5-10% of the total area, we consider release of up to 50 Gt of predicted amount of hydrate storage as highly possible for abrupt release at any time".

In 2007, concentrations of dissolved methane in the water column reached a level of over 5141 nM at a location in the Laptev Sea. For more background, see the previous post, Unfolding Climate Catastrophe

Satellite measurements show methane readings of up to 2411 ppb on October 20, 2013. Sadly, no current data are available from measurements in the Laptev Sea, neither methane levels in the water, nor atmospheric methane levels just above sea level. Perhaps in time, some data will become available from expeditions.


Sunday, October 20, 2013

Methane presence over Arctic Ocean continues


The image on the right, created with IPCC data, shows that methane levels have risen even stronger than levels of two other greenhouse gases, i.e. carbon doxide (CO2) and nitrous oxide (N2O).

Methane levels have risen strongly over the past few years, especially over the Arctic.

Previous posts at this blog have illustrated that, from early October 2013, high methane readings have shown up persistently over the depths of the Arctic Ocean.

The persistence of these readings indicates that this methane wasn't blown there from elsewhere. Furthermore, the presence of methane appears to line up closely with the fault line that crosses the Arctic Ocean and extends into Siberia and further into the Sea of Okhotsk.

The latest data show a continuation of this worrying methane presence over the Arctic Ocean.


On October 18, 2013, readings of up to 2426 ppb were recorded. As the above image shows, high peak readings have occurred over the past few months. Currently, however, high readings can be more clearly attributed to methane venting from the depths of the Arctic Ocean. On the image below, methane shows up very prominently over the Arctic Ocean.


For more background, see posts below.

Related

- The Unfolding Methane Catastrophe
http://arctic-news.blogspot.com/2013/10/unfolding-methane-catastrophe.html

- Methane hydrates
http://methane-hydrates.blogspot.com/2013/04/methane-hydrates.html

- Myths about methane hydrates
http://methane-hydrates.blogspot.com/p/myths.html


Friday, October 18, 2013

Unfolding Methane Catastrophe


The above image shows that, over a period of less than two days, huge amounts of methane show up over the depth of the Arctic Ocean, especially along the fault line that crosses the Arctic Ocean and extends into Siberia and further into the Sea of Okhotsk. On October 17, 2013, readings of up to 2351 ppb were recorded.


The above image shows that such high readings have occurred before over the past few months. This time, however, this high reading can be more clearly attributed to methane escaping from the depth of the Arctic Ocean, as also indicated by the image below that shows that at 469 mb (i.e. the altitude at which this high reading was recorded on the afternoon of October 17) methane was predominantly present at higher northern latitudes.

The methane that appears over the depth of the Arctic Ocean is likely have traveled a long path through the vertical water column before entering the atmosphere. Clearly, some of the methane must have oxidized in the ocean. Therefore, methane must be escaping from the seabed in amounts far higher than what is visible in the air.

Below follows some history regarding this unfolding methane catastrophe. Note that methane concentrations in the water are measured in nM, while methane concentrations in the atmosphere are typically measured in parts per billion (ppb).

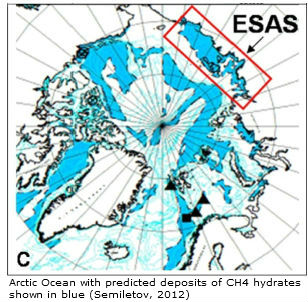
There are vast amounts of methane in sediments underneath the Arctic Ocean.  Natalia Shakhova et al. (2010) estimate the accumulated potential for the East Siberian Arctic Shelf (ESAS) region alone (image on the right) as follows:
  • organic carbon in permafrost of about 500 Gt
  • about 1000 Gt in hydrate deposits
  • about 700 Gt in free gas beneath the gas hydrate stability zone.8
Natalia Shakhova et al. (2008) consider release of up to 50 Gt of predicted amount of hydrate storage as highly possible for abrupt release at any time. By comparison, the total amount of methane currently in the atmosphere is about 5 Gt.3

The danger that volcanic and earthquake activity along the Gakkel Ridge could lead to destabilization and abrupt methane release into the atmosphere was highlighted by Light and Sorana back in 2002.1

Measurements taken in September 2003 and September 2004 show that the surface layer of shelf water in the East-Siberian Sea and Laptev Sea was supersaturated up to 2500% relative to the present average atmospheric methane content of 1.85 ppm. Anomalously high concentrations (up to 154 nM or 4400% supersaturation) of dissolved methane in the bottom layer of shelf water suggest that the bottom layer is somehow affected by near-bottom sources. Considering the possible formation mechanisms of such plumes, we favor thermo-abrasion and the effects of shallow gas or gas hydrates release, conclude the authors of this study, published in 2005.2

In September 2005, extremely high concentrations of methane (up to 8 ppm) were measured in the atmospheric layer above the sea surface of the East Siberian Shelf, along with anomalously high concentrations of dissolved methane in the water column (up to 560 nM, or 12000% of super saturation).3

The authors conclude: "Since the area of geological disjunctives (fault zones, tectonically and seismically active areas) within the Siberian Arctic shelf composes not less than 1-2% of the total area and area of open taliks (area of melt through permafrost), acting as a pathway for methane escape within the Siberian Arctic shelf reaches up to 5-10% of the total area, we consider release of up to 50 Gt of predicted amount of hydrate storage as highly possible for abrupt release at any time. That may cause ∼12-times increase of modern atmospheric methane burden with consequent catastrophic greenhouse warming".3

In 2007, concentrations of dissolved methane in the water column reached a level of over 5141 nM at a location in the Laptev Sea.4

A study published in 2008 found volcanoes up to 2,000 m in diameter and a few hundred metres high at the bottom of the Arctic Ocean, at Gakkel Ridge.5


End September 2011, a cluster of methane plumes, over one km in diameter, appeared in the Laptev Sea, as shown on the image below, from a paper on the unfolding "Methane Catastrophe".6

In early October 2013, high atmospheric levels of methane started to appear over the depth of the Arctic Ocean.9  See image at top for most recent readings.


References

1. Arctic Methane Hydrates: A Potential Greenhouse Gas Hazard. - Light, M.P.R. and Solana, C. (2002)
http://adsabs.harvard.edu/abs/2002EGSGA..27.4077L
For more details, see also
http://arctic-news.blogspot.com/p/seismic-activity.html

2. The distribution of methane on the Siberian Arctic shelves: Implications for the marine methane cycle. - Natalia Shakhova, Igor Semiletov and Gleb Panteleev (2005)
http://onlinelibrary.wiley.com/doi/10.1029/2005GL022751/abstract

3. Anomalies of methane in the atmosphere over the East Siberian shelf: Is there any sign of methane leakage from shallow shelf hydrates? - N. Shakhova, I. Semiletov, A. Salyuk and D. Kosmach (2008)
http://meetings.copernicus.org/www.cosis.net/abstracts/EGU2008/01526/EGU2008-A-01526.pdf

4. Siberian Sea Shelf Study, International Arctic Research Center, University of Alaska Fairbanks
http://research.iarc.uaf.edu/SSSS/data2010.php

5. Explosive volcanism on the ultraslow-spreading Gakkel ridge, Arctic Ocean. - Sohn RA et al. (2008)
http://www.ncbi.nlm.nih.gov/pubmed/18580949

6. The Degradation of Submarine Permafrost and the Destruction of Hydrates on the Shelf of East Arctic Seas as a Potential Cause of the “Methane Catastrophe”: Some Results of Integrated Studies in 2011. - V. I. Sergienko et al., in Oceanology (Sept. 2012)
http://link.springer.com/article/10.1134/S102833

7. On carbon transport and fate in the East Siberian Arctic land–shelf–atmosphere system. - Semiletov et al. (2012)
http://iopscience.iop.org/1748-9326/7/1/015201

8. Methane release from the East Siberian Arctic Shelf and the Potential for Abrupt Climate Change. - Natalia Shakhova and Igor Semiletov (2010), Presentation at Symposium, November 30, 2010
http://symposium2010.serdp-estcp.org/content/download/8914/107496/version/3/file/1A_Shakhova_Final.pdf

9. High Methane Readings continue over Depth of Arctic Ocean
http://arctic-news.blogspot.com/2013/10/high-methane-readings-continue-over-depth-of-arctic-ocean.html


Tuesday, October 15, 2013

High Methane Readings continue over Depth of Arctic Ocean

The image below contains 12 frames, with methane readings recorded over 12 days in the first half of October 2013.

[ click on image to enlarge ]
As discussed in earlier posts at this blog, high methane readings have been recorded recently over the depth of Arctic Ocean. Above image shows that these high readings are continuing. The image below shows that at 469 mb, the altitude at which the highest reading was recorded on the afternoon of October 13, methane shows up very prominently over the Arctic Ocean.

The fact that little methane shows up elsewhere indicates that methane is present at high levels, at times over 2200 ppb, over the depth of the Arctic Ocean, and that these high levels result from methane that originates from hydrates under the seabed.

The image below, with methane readings over the past few days (from October 12 10:00 pm to October 14 11:23 pm), shows high levels of methane over the depth of the Arctic Ocean.


The image below shows methane readings at 586 mb, the altitude at which the highest methane reading was recorded on the afternoon of October 14 (a reading of 2248 ppb). Again, methane is present very prominently over the depth of the Arctic Ocean.