CO₂ levels just reached another record high. On February 9, 2019, an average daily CO₂ level of 414.27 ppm was recorded at Mauna Loa, Hawaii.
The image below shows hourly (red circles) and daily (yellow circles) averaged CO₂ values from Mauna Loa, Hawaii, for the last 31 days.
As the image shows, average hourly levels well above 414 ppm were recorded on January 21, 2019, but no daily average was recorded for that day. February 9, 2019, was the first time an average daily CO₂ level above 414 ppm was formally recorded and such levels have not been reached earlier over the past 800,000 years, as illustrated by the image below.
CO₂ levels can be expected to keep rising further this year to reach a maximum level in April/May 2019.
How much can CO₂ levels be expected to grow over the next decade?
A
recent Met Office forecast expects annual average CO₂ levels at Mauna Loa to be 2.75 ppm higher in 2019 than in 2018. The image below shows NOAA 1959-2018 CO₂ growth data (black) and uses this Met Office forecast used for 2019 (brown). The growth figures for 2018 and 2019 are spot on a trend that is added in line with an
earlier analysis.
Strong CO₂ growth is forecast for 2019, due to a number of factors including rising emissions, the added impact of El Niño and less uptake of carbon dioxide by ecosystems. A
recent study warns that global warming will
enhance both the amplitude and the frequency of eastern Pacific El Niño events and associated extreme weather events. Another
recent study warns that, while the terrestrial biosphere now absorbs some 25% of CO₂ emissions by people, the rate of land carbon uptake is likely to fall with reduced soil moisture levels in a warmer world. Furthermore, fire hazards can be expected to grow due to stronger winds and higher temperatures, each of which constitutes a factor on their own, while they jointly also increase two further factors, i.e. drying out of soils, groundwater and vegetation, and the occurrence of more lightning to ignite fires and to also cause more ground-level ozone that further deteriorates vegetation health.
The warming impact of CO₂ can therefore be expected to increase over the next decade, given also that the warming impact of CO₂ reaches a peak ten years after emission. The
earlier analysis furthermore warns about strong growth in CO₂ emissions due to fires in forests and peatlands, concluding that CO₂ emissions could cause an additional global temperature rise of 0.5°C over the next ten years.
Rise in methane is accelerating
Methane levels are also rising and this rise is accelerating, as illustrated by the image below.
The graph shows July 1983 through October 2018 monthly global methane means at sea level, with added trend. Note that higher methane means can occur at higher altitude than at sea level. On Sep 3, 2018, methane means as high as 1905 ppb were recorded at 307 mb, an altitude at which some of the strongest growth in methane has occurred, as discussed in earlier posts such as
this one.
What does the historic record tell us?
A 10°C higher temperature is in line with such high greenhouse gas levels, as illustrated by the graph below, based on 420,000 years of ice core data from Vostok, Antarctica, from an
earlier post.
Tipping points
The threat is that a number of tipping points are going to be crossed, including the buffer of latent heat, loss of albedo as Arctic sea ice disappears, methane releases from the seafloor and rapid melting of permafrost on land and associated decomposition of soils, resulting in additional greenhouse gases (CO₂, CH₄, N₂O and water vapor) entering the Arctic atmosphere, in a vicious self-reinforcing cycle of runaway warming.
A 10°C rise in temperature by 2026?
Above image shows how a 10°C or 18°F temperature rise from preindustrial could eventuate by 2026 (from
earlier post).
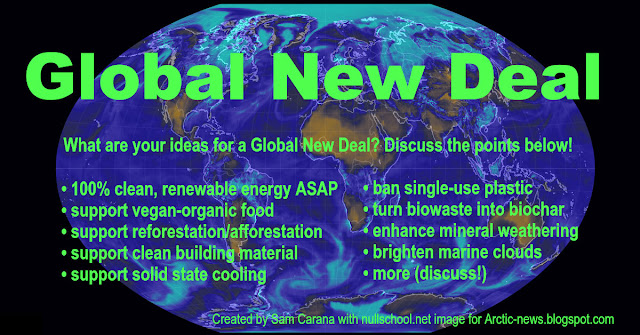
The situation is dire and calls for comprehensive and effective action, as described at the
Climate Plan.
Links
• NOAA Mauna Loa CO2 annual mean growth rates 1959-2018
ftp://aftp.cmdl.noaa.gov/products/trends/co2/co2_gr_mlo.txt
• NOAA monthly global methane means at sea level
ftp://aftp.cmdl.noaa.gov/products/trends/ch4/ch4_mm_gl.txt
• Faster CO₂ rise expected in 2019
https://www.metoffice.gov.uk/news/releases/2019/2019-carbondioxide-forecast
• Increased variability of eastern Pacific El Niño under greenhouse warming, by Wenju Cai et al.
https://www.nature.com/articles/s41586-018-0776-9
• El Niño events will intensify under global warming, by Yoo-Geun Ham
https://www.nature.com/articles/d41586-018-07638-w
• Large influence of soil moisture on long-term terrestrial carbon uptake, by Julia Green et al.
https://www.nature.com/articles/s41586-018-0848-x
• 2018 Continues Record Global Ocean Warming, by Lijing Cheng et al.
https://link.springer.com/article/10.1007/s00376-019-8276-x
• Blue Ocean Event
https://arctic-news.blogspot.com/2018/09/blue-ocean-event.html
• What Does Runaway Warming Look Like?
https://arctic-news.blogspot.com/2018/10/what-does-runaway-warming-look-like.html
• Extinction
https://arctic-news.blogspot.com/p/extinction.html
• Climate Plan
https://arctic-news.blogspot.com/p/climateplan.html


