Showing posts with label NASA. Show all posts

Wednesday, September 19, 2012

NSIDC calls record 2012 low

This NASA satellite image shows how the Arctic sea ice extent, on Sept. 16, 2012, compares to the average
minimum extent over the past 30 years (in yellow). Credit: NASA/Goddard Scientific Visualization Studio.
Arctic sea ice cover likely melted to its minimum extent for the year on September 16, says the National Snow and Ice Data Center (NSIDC), adding the note that this number is preliminarychanging weather conditions could still push the ice extent lower.

Sea ice extent—defined by NSIDC as the total area covered by at least 15 percent of ice—fell to 3.41 million square kilometers (1.32 million square miles), now the lowest summer minimum extent in the 33-year satellite record.

NSIDC adds that this minimum is 49% below the 1979 to 2000 average, as illustrated by the table below.

Table 1. Previous minimum Arctic sea ice extents
 YEARMINIMUM ICE EXTENTDATE
IN MILLIONS OF SQUARE KILOMETERSIN MILLIONS OF SQUARE MILES
20074.171.61September 18
20084.591.77September 20
20095.131.98September 13
20104.631.79September 21
20114.331.67September 11
20123.411.32September 16
1979 to 2000 average6.702.59September 13
1979 to 2010 average6.142.37September 15

NSIDC adds that the six lowest seasonal minimum ice extents in the satellite record have all occurred in the last six years (2007 to 2012). In contrast to 2007, when climatic conditions (winds, clouds, air temperatures) favored summer ice loss, this year’s conditions were not as extreme. Summer temperatures across the Arctic were warmer than average, but cooler than in 2007. The most notable event was a very strong storm centered over the central Arctic Ocean in early August. It is likely that the primary reason for the large loss of ice this summer is that the ice cover has continued to thin and become more dominated by seasonal ice. This thinner ice was more prone to be broken up and melted by weather events, such as the strong low pressure system just mentioned. The storm sped up the loss of the thin ice that appears to have been already on the verge of melting completely.

NASA says that this year, a powerful cyclone formed off the coast of Alaska and moved on August 5 to the center of the Arctic Ocean, where it churned the weakened ice cover for several days. The storm cut off a large section of sea ice north of the Chukchi Sea and pushed it south to warmer waters that made it melt entirely. It also broke vast extensions of ice into smaller pieces more likely to melt.

“The storm definitely seems to have played a role in this year's unusually large retreat of the ice”, said Claire Parkinson, a climate scientist at NASA Goddard Space Flight Center, Greenbelt, Md. “But that exact same storm, had it occurred decades ago when the ice was thicker and more extensive, likely wouldn't have had as prominent an impact, because the ice wasn't as vulnerable then as it is now.”

In the press release, NSIDC lead scientist Ted Scambos said that thinning ice, along with early loss of snow, are rapidly warming the Arctic. “But a wider impact may come from the increased heat and moisture the warmer Arctic is adding to the climate system,” he said. “This will gradually affect climate in the areas where we live,” he added. “We have a less polar pole—and so there will be more variations and extremes.”

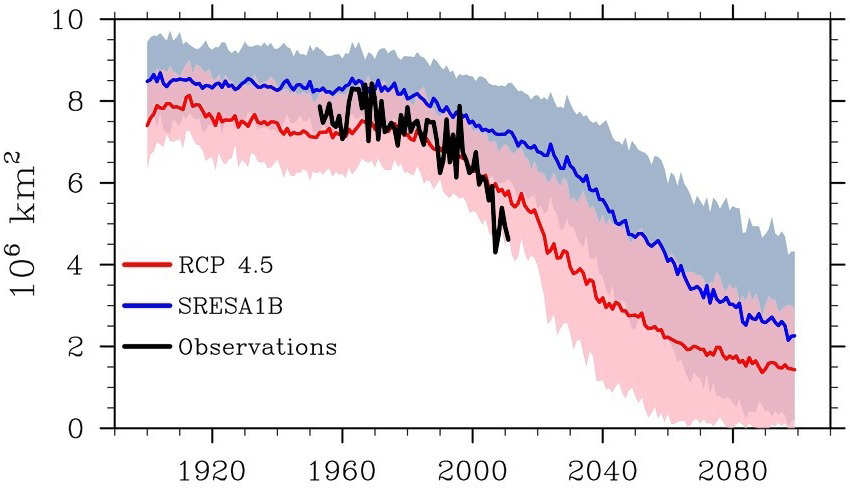
The image below, from Arctic Sea Ice Blog, shows Arctic sea ice observations (in red) against the backdrop of models used in IPCC AR4 (2007) for projection of sea ice up to the year 2100.


The image below, from NSIDC sea ice news, shows the observed September sea ice extent for 1952-2011 (black line) against a backdrop of projections used by IPCC AR4 (blue) as well as proposed for use in IPCC AR5 (red).

Note: The record low value for 2012 still has to be added on this image. Credit: NSIDC, Stroeve et al.
The image shows that the recently observed decline in sea ice extent is steeper than the CMIP3 models with a “business as usual” SRESA1B greenhouse gas emissions scenario (blue line), as used by the IPCC in AR4.

It is also steeper than the more recent CMIP5 models using a RCP 4.5 scenario (pink line) that are proposed to be used by the IPCC in AR5.

RCP 4.5 is a scenario in which the global temperature rise would would soon exceed 2 degrees Celsius. Since the Arctic experiences accelerated warming, such a scenario would clearly be catastrophic. Looking at sea ice volume, rather than extent, would show this even more clearly.

Below, a NOAA animation showing sea ice decline in 2012 and a NASA animation showing the Arctic cyclone.

Thursday, September 6, 2012

Noctilucent clouds indicate more methane in upper atmosphere

Noctilucent clouds [credit: NASA]

The inner solar system is littered with meteoroids of all shapes and sizesfrom asteroid-sized chunks of rock to microscopic specks of dust. Every day Earth scoops up tons of the material, mostly the small stuff. When meteoroids hit our atmosphere and burn up, they leave behind a haze of tiny particles suspended 70 km to 100 km above Earth's surface.

Inside the meteor smoke zone, at a height of 83 km, so-called noctilucent clouds can occur, describes a NASA article. Meteor dust is the nucleating agent around which such clouds form. Specks of meteor smoke act as gathering points where water molecules can assemble themselves and grow into ice crystals to sizes ranging from 20 to 70 nanometers.

While noctilucent clouds appear most often at Arctic latitudes, they have been sighted in recent years as far south as Colorado, Utah and Nebraska. Question is: Why are the clouds brightening and spreading?

Prof. James Russell of Hampton University believes that more in methane in the atmosphere is causing this. Russell explains: "When methane makes its way into the upper atmosphere, it is oxidized by a complex series of reactions to form water vapor. This extra water vapor is then available to grow ice crystals for noctilucent clouds."

In conclusion, this greater occurrence of octilucent clouds is an indication that more methane is escaping into the upper atmosphere.

Graphic prepared by Prof. James Russell of Hampton University showing how methane, a    
greenhouse gas, boosts the abundance of water at the top of Earth's atmosphere. This water
then freezes around "meteor smoke" to form icy noctilucent clouds.              [Credit:  NASA] 

Below, a new ScienceCast video explains how "meteor smoke" seeds noctilucent clouds.


Tuesday, July 24, 2012

Greenland is melting at incredible rate

The combination-image below shows how much the ice on Greenland melted between July 8 (left) and July 12 (right).

On July 8, about 40% of the ice sheet had undergone thawing at or near the surface. In just a few days, the melting had dramatically accelerated and some 97% of the ice sheet surface had thawed by July 12. 

In the image, the areas classified as “probable melt” (light pink) correspond to those sites where at least one satellite detected surface melting. The areas classified as “melt” (dark pink) correspond to sites where two or three satellites detected surface melting. The satellites are measuring different physical properties at different scales and are passing over Greenland at different times. Credit: Nicolo E. DiGirolamo, SSAI/NASA GSFC, and Jesse Allen, NASA Earth Observatory.
For several days this month, Greenland's surface ice cover melted over a larger area than at any time in more than 30 years of satellite observations. Nearly the entire ice cover of Greenland, from its thin, low-lying coastal edges to its two-mile-thick center, experienced some degree of melting at its surface, according to measurements from three independent satellites analyzed by NASA and university scientists.

On average in the summer, about half of the surface of Greenland's ice sheet naturally melts. At high elevations, most of that melt water quickly refreezes in place. Near the coast, some of the melt water is retained by the ice sheet and the rest is lost to the ocean. But this year the extent of ice melting at or near the surface jumped dramatically. According to satellite data, an estimated 97% of the ice sheet surface thawed at some point in mid-July.

This extreme melt event coincided with an unusually strong ridge of warm air, or a heat dome, over Greenland. The ridge was one of a series that has dominated Greenland's weather since the end of May. "Each successive ridge has been stronger than the previous one," said Mote. This latest heat dome started to move over Greenland on July 8, and then parked itself over the ice sheet about three days later. By July 16, it had begun to dissipate.

As the ice warms, it loses albedo, i.e. less sunlight is reflected back into space. Darker surface absorbs more sunlight, accelerating the melting. The image below shows the Greenland ice sheet albedo from 2000 to 2011.

Credit: NOAA Arctic Report Card 2011.

The image below, from the meltfactor blog and by Jason Box and David Decker, shows the steep fall in reflectivity for altitudes up to 3200 meters in July 2012. 


The image below, from the meltfactor blog, shows how the year 2012 compares with the situation at approximately the same time in previous years, 2011 and 2010, which are recognized as being record melt years. 


The photo below shows how dark the ice sheet surface can become.

Photo shot by Jason Box on August 12, 2005
Loss of albedo occurs as the darker bare ground becomes visible where the ice has melted away. Darkening of snow and ice can start even before melting takes place. Warming changes the shape and size of the ice crystals in the snowpack, as described at this NASA Earth Observatory page. As temperatures rise, snow grains clump together and reflect less light than the many-faceted, smaller crystals. Additional heat rounds the sharp edges of the crystals, and round particles absorb more sunlight than jagged ones. 

Dirty ice surrounds a meltwater stream near the margin of the ice sheet. Compared to fresh snow and clean ice, the dark surface absorbs more sunlight, accelerating melting. © Henrik Egede Lassen/Alpha Film, from the Snow, Water, Ice, and Permafrost in the Arctic report from the U.N. Arctic Monitoring and Assessment Programme. From NOAA Climatewatch.
Another factor contributing to darkening is aerosols, in particular soot (i.e. black carbon) from fires and combustion of fuel, dust and organic compounds that enter the atmosphere and that can travel over long distances and settle on ice and snow in the Arctic. 

The July data since 2000, from the meltfactor blog, suggest a exponential fall in reflectivity that, when projected into the future (red line, added by Sam Carana), looks set to go into freefall next year. 

Is a similar thing happening all over the Arctic? Well, the map below, edited from a recent SSMIS Sea Ice Map, shows that sea ice concentration is highest around the North Pole. 


So, can water be expected to show up at the North Pole? Well have a look at the photo from the North Pole webcam below. 


Photo from the North Pole webcam
It does look like melting is going on at the North Pole. Water is significantly darker than ice, meaning the overall reflectivity will be substantially lowered by this water. 

It's important to realize that surface albedo change is just one out of a number of feedbacks, each of which deserves a closer look. 

As shown on the image below, the IPCC describes four types of feedbacks with a joint Radiative Forcing of about 2 W/sq m, i.e. water vapor, cloud, surface albedo and lapse rate. 


The image below, from James Hansen et al., may at first glance give the impression that all aerosols have a cooling effect. 


When components are split out further, it becomes clear though that some aerosols are reflective and have a cooling effect, whereas black carbon has a warming effect, while changes in snow albedo also contribute to warming. On the interactive graph below, you can click on or hover over each component to view their radiative forcing. When isolated from other factors, it's clear that snow albedo has an increasing warming effect.
How much could Earth warm up due to decline of snow and ice? Professor Peter Wadhams estimates that the drop in albedo in case of total loss of Arctic sea ice would be a 1.3 W/sq m rise in radiative forcing globally, while additional decline of ice and snow on land could push the the combined impact well over 2 W/sq m.

Locally, the impact could be even more dramatic. The image below, from Flanner et al., shows how much the snow and ice is cooling the Arctic. 


Image, edited by Sam Carana, from Mark Flanner et al. (2011).
Conversely, above image shows how much the Arctic could warm up without the snow and ice. Due to albedo change, sunlight that was previously reflected back into space will instead warm up the Arctic. What could have a big impact locally is that, where there's no more sea ice left, all the heat that previously went into melting will raise temperatures instead, as described at Warming in the Arctic.

The big danger is methane. Drew Shindell et al. show in Improved Attribution of Climate Forcing to Emissions that inclusion of aerosol responses will give methane a much higher global warming potential (GWP) than the IPCC gave methane in AR4, adding that methane's GWP would likely be further increased by including ecosystem responses. Indeed, as pictured in the image below, accelerated warming in the Arctic could trigger methane releases which could cause further methane releases, escalating into runaway global warming


Tuesday, April 10, 2012

High methane levels in Arctic - April 2012

Below are two images produced with NASA GES DISC Giovanni data system, showing methane levels for early April 2012.

The top image shows where methane levels exceed 1.9 parts per million.


The image below is a polar projection; note the different scale on the right, which is the default one that is automatically calculated and exceeds 2 parts per million.


Below the same image as the above one, this time with the same custom scale as the top image. 


Below is an animation showing the recent surface temperature anomalies 
This animation is a 774 kb file and may take some time to fully load. 


Methane levels at Mauna Loa, Hawaii (directly below) and Barrow, Alaska (further down below).