Thursday, November 20, 2014

Ocean Temperature Rise Continues


Ocean Temperature Rise

Of all the excess heat that results from people's emissions, 93.4% goes into oceans. Accordingly, the temperature of oceans has risen substantially.

NOAA analysis shows that the most recent 12-month period, November 2013–October 2014, broke the record (set just last month) for the all-time warmest 12-month period in the 135-year period of record. The global oceans were the warmest on record for October. For January–October, the average global sea surface temperature was also record high.


The danger is that ocean temperatures will continue to rise, especially in the North Atlantic, and that the Gulf Stream will keep carrying ever warmer water from the North Atlantic into the Arctic Ocean, threatening to unleash huge methane eruptions from the Arctic Ocean's seafloor, in turn causing even higher temperatures and more extreme weather events, wildfires, etc.


High Methane Levels

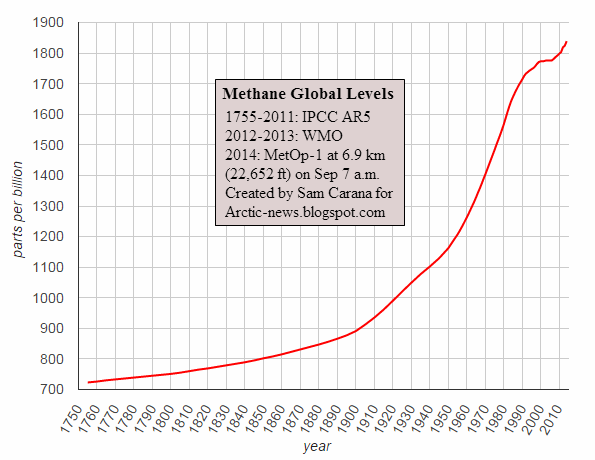
High methane levels were recorded over the Arctic Ocean in October, as discussed in this earlier post, and were sustained in November, as discussed in this post. Methane levels as high as 2717 ppb were recorded on November 16, 2014, p.m, by the MetOp-1 satellite at 469 mb (i.e. 19,820 ft or 6,041 m altitude), as the image below shows.

Methane levels as high as 2549 ppb were recorded on November 19, 2014, p.m, by the MetOp-2 satellite at 586 mb (i.e. 14,385 ft or 4,384 m altitude), as the image below shows.

Above image further confirms earlier indications that these high methane levels do indeed result from large methane eruptions from the seafloor of the Arctic Ocean.

Greenhouse gas levels in general are very high over the Arctic, as earlier discussed in a recent post and as illustrated by the image below, showing carbon dioxide levels as high as 420 ppm at high latitudes, while the global mean was 403 ppm, on November 19, 2014, p.m., at 945 mb (i.e. 1,916 ft or 584 m altitude).


As said, sustained instances of large abrupt methane eruptions from the seafloor of the Arctic Ocean threaten to strongly accelerate warming in the Arctic even further, in turn resulting in ever more methane being released, as illustrated in the image below, from an earlier post.


Self-reinforcing Feedback Loops


Such methane eruptions are part of a number of self-reinforcing feedback loops that can strongly accelerate warming in the Arctic. Above image, from an earlier post, illustrates two such feedbacks, i.e. albedo changes due to snow and ice demise, and methane releases. Further feedbacks are described in this post and this post, and in the image below.

For a discussion of these and further feedbacks, see this page at the Climate Plan blog 
The threat is that such rapid temperature rises will appear at first in hotspots over the Arctic and eventually around the globe, while also resulting in huge temperature swings that could result in depletion of supply of food and fresh water, as further illustrated by the above image, from an earlier post, and the image below, from another earlier post.
[ click on image at original post to enlarge ]


IPCC warnings not strong enough


In above paragraph, the IPCC warns about the risk of methane eruptions from the seafloor of the Arctic Ocean further accelerating global warming. While the IPCC does model for a temperature rise that could exceed 12 degrees Celsius in a 'business as usual' scenario (i.e. without action taken), the IPCC does not anticipate that such a rise could occur before the year 2250, as illustrated by the image below.


The situation could be much worse than foreseen by the IPCC, due to a number of reasons, including:
  1. The non-linear way feedbacks can hugely increase temperature rises.
  2.  The IPCC's underestimation of the amount of methane contained in sediments under the Arctic Ocean and prone to be released as temperatures rise. Shakhova et al. estimate the accumulated methane potential for the Eastern Siberian Arctic Shelf (ESAS) alone as follows:
    - organic carbon in permafrost of about 500 Gt;
    - about 1000 Gt in hydrate deposits; and
    - about 700 Gt in free gas beneath the gas hydrate stability zone.
    Back in 2008, Shakhova et al. considered release of up to 50 Gt of predicted amount of hydrate storage as highly possible for abrupt release at any time.
    Furthermore, mantel methane could add to our predicament, as discussed in an earlier post.
  3. Back in 2002, Malcolm Light already warned that seismic events could trigger destabilization of methane hydrates. Furthermore, huge temperature swings can combine with pressure swings and storms, and with swings between expansion and contraction of soil and ice, resulting in severe shocks to ecosystems, as described in an earlier post
  4. The IPCC's ignoring of large methane eruptions from the seafloor of the Arctic Oceans and the resulting growth of mean global methane levels at higher altitudes, as discussed in an earlier post.
Steven Sherwood et al. wrote back in 2010 that peak heat stress, quantified by wet bulb temperature, across diverse climates today never exceeds 31 degrees Celsius (see also this update). Some may believe that this doesn't apply to the Arctic and the higher altitudes in mountain regions. However, at the June Solstice the amount of solar radiation received in the Arctic is higher than anywhere else on Earth, An increased occurence and intensity of heatwaves could expose large areas of the Arctic and mountain regions to sustained heatwaves exceeding peak heat stress temperatures. In addition, ocean acidification and oxygen depletion in the Arctic Ocean would make it hard for fish, seals, polar bears and further wildlife to survive. Furthermore, the short growth season combined with a long, cold winter limits vegetation in the Arctic, while ecosystems are also becoming increasingly exposed to wild weather swings and wildfires.


Risk Assessment

When taking above points into acount, an absence of action seems to guarantee human extinction by the year 2050. Little action will be ‘too little, too late’ and will merely delay human extinction by a few years, as illustrated by the graph below.


The graph identifies the years 2030 and 2040 as critical. Beyond the year 2030, the risk that humans will go extrinct grows larger than 1% in the absence of action. By the year 2040, the risk of human extinction will have increased substantially, especially if no action will have been taken, but also if too little action will have been taken up to 2040, while even with the best possible programs put in place by the year 2015, there will be a 2% risk of human extinction by 2040, e.g. due to war over what action to take, or due to political opposition or errors making such programs ineffective or even counter-productive.

In conclusion, it is highly likely that the risk of human extinction already now is intolerably high and rising with every moment passing with little or no action taken to reduce the risk. The situation is dire and calls for comprehensive and effective action, as described in the Climate Plan.


Links

• Intergovernmental Panel on Climate Change (IPCC) WGI Fifth Assessment Report (AR5), Final Draft (7 June 2013), page 168.
http://www.climatechange2013.org/images/uploads/WGIAR5_WGI-12Doc2b_FinalDraft_Chapter02.pdf

• Intergovernmental Panel on Climate Change (IPCC) WGI Fifth Assessment Report (AR5), Final Draft (7 June 2013), Figure 12.5.
http://www.climatechange2013.org/images/uploads/WGIAR5_WGI-12Doc2b_FinalDraft_Chapter12.pdf

• An adaptability limit to climate change due to heat stress - by Steven C. Sherwood & Matthew Huber
http://www.pnas.org/content/early/2010/04/26/0913352107.full.pdf

• Ocean Temperature Rise - by Sam Carana
https://arctic-news.blogspot.com/2014/10/ocean-temperature-rise.html

• Methane release from the East Siberian Arctic Shelf and the Potential for Abrupt Climate Change - by Natalia Shakhova & Igor Semiletov
http://symposium2010.serdp-estcp.org/content/download/8914/107496/version/3/file/1A_Shakhova_Final.pdf

• Anomalies of methane in the atmosphere over the East Siberian shelf: Is there any sign of methane leakage from shallow shelf hydrates? - by Shakhova, Semiletov, Salyuk & Kosmach  http://www.cosis.net/abstracts/EGU2008/01526/EGU2008-A-01526.pdf

• Mantle Methane - by Malcolm Light
https://arctic-news.blogspot.com/2014/02/mantle-methane.html

• Evidence linking Arctic amplification to extreme weather in mid-latitudes - by Jennifer A. Francis and S.J. Vavrus, in: Geophysical Research Letters 39 (6):. doi:10.1029/2012GL051000
http://onlinelibrary.wiley.com/doi/10.1029/2012GL051000/abstract

• Near-Term Human Extinction - by Sam Carana
https://arctic-news.blogspot.com/2014/04/near-term-human-extinction.html

• Warm waters threaten to trigger huge methane eruptions from Arctic Ocean seafloor - by Sam Carana
https://arctic-news.blogspot.com/2014/08/warm-waters-threaten-to-trigger-huge-methane-releases-from-arctic-ocean-seafloor.html

• How many deaths could result from failure to act on climate change? - by Sam Carana
https://arctic-news.blogspot.com/2014/05/how-many-deaths-could-result-from-failure-to-act-on-climate-change.html

• Methane linked to Seismic Activity in the Arctic - by Malcolm P. Light & Sam Carana
https://arctic-news.blogspot.com/p/seismic-activity.html

• Wild Weather Swings - by Sam Carana
https://arctic-news.blogspot.com/2014/10/wild-weather-swings.html

• Four Hiroshima bombs a second: how we imagine climate change - by Sam Carana
https://arctic-news.blogspot.com/2013/08/four-hiroshima-bombs-second-how-we-imagine-climate-change.html

• Polar jet stream appears hugely deformed
https://arctic-news.blogspot.com/2012/12/polar-jet-stream-appears-hugely-deformed.html

• Near-Term Human Extinction
https://arctic-news.blogspot.com/2014/04/near-term-human-extinction.html

• Climate Plan
https://arctic-news.blogspot.com/p/climateplan.html


Sunday, November 2, 2014

Methane Erupting From East Siberian Arctic Shelf

Methane is erupting in huge amounts from the seafloor of the Arctic Ocean, as illustrated by the images below, showing methane over the East Siberian Arctic Shelf on October 31, 2014.

The top image on the right shows methane at an altitude of 19,820 feet (6,041 m), on October 31, 2014, pm, as captured by the MetOp1 satellite.

The middle image shows the location of the seas north of Siberia, and shows methane over the Arctic Ocean close to sea level, for reference.

The bottom image is an animation, starting at an altitude close to sea level and rising over 25 frames to an altitude of 19,820 feet (6,041 m).

As altitude increases, the methane can be seen emerging from the Laptev Sea at first, then spreading over further parts of the Arctic Ocean.

The yellow color indicates that methane is present at levels of 1950 ppb or higher.

High CO2 levels over Arctic Ocean

As in the previous post, an image has been added (below) showing recent carbon dioxide levels. Close to ground level (or rather sea level), mean CO2 level increased to 402 ppm on November 1, 2014 am, as measured by the MetOp-1 satellite.


The image below shows a comparison between CO2 (left) and methane (right).

[ Image added later, Ed. Click on image to enlarge ]
Above images indicate that large amounts of methane are broken down at higher latitudes on the Northern Hemisphere, especially over the Arctic Ocean.

Large methane eruptions from the seafloor of Arctic Ocean continue

The two images below [added later, ed.] further confirm the huge size of the methane erupting from the seafloor of the Arctic Ocean. The image directly below shows that levels as high as 2362 ppb were recorded on November 5, 2014 p.m.by the MetOp-1 satellite at an altitude of 14,385 ft (4,384 m) altitude. The image also shows that the methane is predominantly visible over the Arctic Ocean, further confirming that this is indeed the cause of the continued high methane levels.


The recent methane eruptions from the seafloor of the Arctic Ocean also appear to be pushing up methane levels at Mauna Loa, Hawaii, as measured by NOAA on November 6, 2014, as illustrated by the combination image below showing daily averages (left) and hourly averages (right).


Methane eruptions from Arctic Ocean seafloor look set to continue for months to come

As oceans keep warming, the Gulf Stream
will keep moving ocean heat into the Arctic Ocean, and ever more methane threatens to erupt from the seafloor of the Arctic Ocean.

The image on the right shows the huge sea surface temperature anomalies off the coast of North America and in the Arctic. Heat in the North Atlantic will take some time to travel to the Arctic Ocean, so this heat has yet to arrive there and contribute to cause further methane eruptions.

Nations are ignoring the growing dangers and keep each seeking a bigger share of a 'carbon budget', but in reality there is no carbon budget to divide. Instead, there is a huge debt built up by a joint failure of nations to act on pollution.

Increased methane eruptions from the seafloor of the Arctic Ocean threaten to further accelerate warming in the Arctic, in turn resulting in ever more methane being released, as illustrated in the image below, from an earlier post.

Methane in historic perspective

The image below shows that global methane levels have risen from 723 ppb in 1755 to 1839 ppb in 2014, a rise of more than 254%. Growth did flatten down for a few years in the early 2000s, but the overall rise does not appear to slow down.

The right-end of this graph is shown in greater detail on the image below, which also has a trendline extended to the year 2021, against a background of methane levels measured by the MetOp-1 satellite on November 2, 2014, p.m.

Note that the image used as background in the plot area has different axis labels, i.e. latitude for the vertical axis and longitude for the horizontal axis. The image below gives the levels associated with the colors on the background image, with yellow indicating levels of 1950 parts per billion (ppb) and higher.


Remember that the level of 723 ppb in 1755 was not a paleo-historic low, but instead was the high peak of a Milankovitch Cycle. The image below further illustrates this point.


And so does the image below, by Reg Morrison.


Comprehensive and effective action needed

The situation is dire and calls for comprehensive and effective action. The Climate Plan seeks emission cuts, removal of pollution from soils, oceans and atmosphere, and further action, as illustrated by the image below, from an earlier post.


Sunday, October 26, 2014

Ocean Temperature Rise

Ocean Temperatures

Of all excess heat resulting from people's emissions, 93.4% goes into oceans. Accordingly, the temperature of oceans has risen substantially.

Globally, the average September ocean temperature marked a record high for that month in 2014, at 0.66°C (1.19°F) above the 20th century average, breaking the previous record that was set just one month earlier. On the Northern Hemisphere, the temperature of the ocean in September 2014 was 0.83 °C (or 1.49 °F) above the 20th century, 


The anomaly was 0.84 °C in August 2014, as illustrated by the image below.

On specific days, anomalies were much higher. On August 19, 2014, the Northern Hemisphere showed a sea surface temperature anomaly of 1.78 °C, while the North Atlantic sea surface temperature was 1.82 °C above average (CFSR 1979-2000 Baseline) on October 16, 2014, as illustrated by the image below.


Sea surface temperature anomalies are at the top end of the scale in many places in the Arctic, as well as off the coast of North America. The danger is that the Gulf Stream will keep carrying ever warmer water from the North Atlantic into the Arctic Ocean, threatening to unleash huge methane eruptions from the Arctic Ocean's seafloor, in turn causing even higher temperatures and more extreme weather events, wildfires, etc.


Above image shows methane levels as high as 2666 ppb, as measured by the MetOp-2 Satellite at 14,385 ft (~4.4 km) altitude on October 26, 2014 am.

Is 2666 ppb as high as it will get?

Sadly, methane releases from the seafloor of the Arctic Ocean are becoming increasingly larger around this time of year and they look set to get even larger than this. Note that the amount of methane actually erupting from the seafloor of the Arctic Ocean is even larger than what is visible on above image, for the following three reasons.

  1. No data were available for some areas, as the IASI (Infrared Atmospheric Sounding Interferometer) instrument measuring methane only covers a certain width. The white shapes showing up on above images are areas where no measurements were taken, resulting from the way the polar-orbiting satellite circum-navigates the globe, as pictured on the image on the right.

    Furthermore, quality control failed in the grey areas on above images, indicating reading difficulties due to high moisture levels (i.e. snow, rain or water vapor), as also discussed in an earlier post. Accordingly, high methane levels (above 1950 ppb) as show up in the yellow areas could also be present in the many grey areas over the Arctic Ocean.

    When also looking at methane levels on days following the high 2666 ppb reading, methane is persistently present over most of the Arctic Ocean, as illustrated by the above October 29, 2014, combination image, confirming that high methane levels were likely present in areas where no data were available on October 6, 2014.
       
  2. Much of the methane that is released from the Arctic Ocean's seafloor is broken down by microbes as it rises up in the water. The SWERUS-3 research team recently found methane in the waters of the East Siberian Sea at levels that equate to atmospheric levels of  3188 ppb.
       
  3. Much methane is broken down in the atmosphere by hydroxyl, as illustrated by the image below, showing carbon dioxde levels on October 27, 2014, that indicate that large amounts of methane are broken down at higher latitudes on the Northern Hemisphere.

The latter point could explain the sudden recent rise in carbon dioxide levels, as also detected at Mauna Loa, Hawaii, as illustrated by the image below.


In conclusion, the amount of methane that is erupting from the seafloor of the Arctic Ocean is larger than what is visible on satellite images, and the water will be highly saturated with methane at locations where the methane is escaping from the seafloor, highlighting the danger that, in case of large abrupt releases from the Arctic Ocean's seafloor, microbes and hydroxyl will quickly get depleted locally, resulting in little of the methane being broken down, as discussed at an earlier post.

Why are such huge amounts of methane starting to get released from the Arctic Ocean's seafloor now?  

As the image below shows, temperature at 2 meters was below 0°C (32°F, i.e. the temperature at which water freezes) over most of the Arctic Ocean on October 26, 2014. The Arctic was over 6°F (3.34°C) warmer than average, and at places was up to 20°C (36°F) warmer than average.


Above image illustrates the enormous amount of heat that has until now been transferred from the waters of the Arctic Ocean to the atmosphere. Underneath the surface, water temperatures are much higher than they used to be and, as around this time of year the Arctic Ocean freezes over, less heat will from now on be able to escape to the atmosphere. Sealed off from the atmosphere by sea ice, greater mixing of heat in the water will occur down to the seafloor of the Arctic Ocean.

As land around the Arctic Ocean freezes over, less fresh water will flow from rivers into the Arctic Ocean. As a result, the salt content of the Arctic Ocean increases, making it easier for ice in cracks and passages in sediments at the seafloor of the Arctic Ocean to melt, allowing methane contained in the sediment to escape. Furthermore, the sea ice makes that less moisture evaporates from the water, which together with the change of seasons results in lower hydroxyl levels at the higher latitudes of the Northern Hemisphere, in turn resulting in less methane being broken down in the atmosphere over the Arctic.

This situation will continue for months to come. Salty and warm water (i.e. warmer than water that is present in the Arctic Ocean) will continue to be carried by the Gulf Stream into the Arctic Ocean, while less heat and moisture will be able to be transferred to the atmosphere.

In conclusion, high methane levels threaten to further accelerate warming in the Arctic, in a vicious cycle escalating into runaway warming and resulting in death, destruction and extinction at massive scale.

So, what can be done to reduce the risk?

Climate Plan

- Emission Cuts

It is imperative that large emissions cuts are made quickly. The Climate Plan calls for 80% emission cuts by 2020, as one of multiple lines of action that need to be implemented in parallel.

- Greenhouse Gas Removal and Storage

The IPCC points at the need for carbon dioxide removal and also warns about ocean warming continuing for centuries (text below).


Indeed, even if all emissions by people could somehow be brought to an abrupt end, this alone will not stop the rise of ocean temperatures, at least not for a long time. For starters, air temperatures would start rising within days, in response to the disappearance of aerosols that now mask the full wrath of global warming. Furthermore, such a temperature rise would further accelerate feedbacks such as snow and ice decline, methane hydrate destabilization, etc., in turn feeding further temperature rises.

The Climate Plan therefore calls for carbon dioxide removal, as well as for active removal of other greenhouse gases from the atmosphere, and for further lines of action.

- Further Action

Again, merely implementing the above lines of action will not suffice to quickly bring down ocean temperatures. Paleo-climate records show that falls in temperature go hand in hand with falls of carbon dioxide in the atmosphere to levels under 280 ppm, as opposed to current carbon dioxide levels that are around 400 ppm.


Raising Funding for Further Action

The Climate Plan calls for comprehensive and effective action that includes additional lines of action. Such additional action will require U.N. supervision, which may make it hard for the necessary action to obtain sufficient funding.

In earlier posts, it was suggested that, besides having fees imposed on facilities that burn fossil fuel and on sales of fossil fuel itself, additional fees could be imposed on commercial international flights. As long as it seems too hard to substantially reduce emissions associated with such flights, it seems appropriate to explore further ways to minimize such flights, e.g. by imposing additional fees that could help fund further action.

There are a number of ways such fees could be implemented. Such fees could be calculated based on the distance traveled or as a percentage of the fare.

Fees could also be calculated on the basis of the traveler's flying history, e.g. in the form of frequent flyer fees. Such fees could be collected either by the respective airline or airport.

In the box on the right, Ekta Kalra gives further details about how the latter idea could be implemented.

What do you think?


References and related posts

- Four Hiroshima bombs a second: how we imagine climate change
http://arctic-news.blogspot.com/2013/08/four-hiroshima-bombs-second-how-we-imagine-climate-change.html

- Arctic Methane Release and Rapid Temperature Rise are interlinked
http://arctic-news.blogspot.com/2013/11/arctic-methane-release-and-rapid-temperature-rise-are-interlinked.html

- Climate Change Accelerating
http://arctic-news.blogspot.com/2014/10/climate-change-accelerating.html

- NOAA, Global Analysis - September 2014
http://www.ncdc.noaa.gov/sotc/global/2014/9

- NOAA Ocean temperature anomalies
http://www.ncdc.noaa.gov/cag/time-series

- Methane Hydrates
http://methane-hydrates.blogspot.com/2013/04/methane-hydrates.html

- Climate Plan
http://climateplan.blogspot.com


Friday, October 17, 2014

U.S. hit by numerous earthquakes?

During the past decade from December 2004 to present, no less than 18 great (Mw ≥ 8.0) earthquakes occurred globally (~1.8 per year), compared to 71 from 1900 to mid-2004 (~0.68 per year), yielding an effective rate increase of 265%, says seismologist Thorne Lay of the University of California at Santa Cruz.

What about smaller earthquakes? As the image below illustrates, of the 1495 earthquakes that hit the world over a period of seven days up to October 17, 2014, 05:04:30, UTC, 1404 occured in the map area of the image below. However, the U.S. is over-represented, the USGS map doesn't show smaller earthquakes (under magnitude 4) outside the U.S.

[ click on image to enlarge ]
Can we expect more earthquakes to hit the U.S.? If so, why?

First of all, as said, many earthquakes do appear to hit the U.S. when looking at above image, but the above USGS map doesn't show smaller earthquakes (under magnitude 4) outside the U.S.

Nonetheless, there can be other reasons why so many earthquakes have recently hit the U.S., so let's explore some of them further.

It's a well-known phenemenon that, during the northern summer, more earthquakes do hit the Northern Hemisphere, rather than the Southern hemisphere. That's a natural phenomenon, but there can also be ways in which people can contribute to the incidence of earthquakes.

Isostatic rebound and changing stress conditions due to meltwater run-off can trigger seismic events. For months now, a huge amount of seismic activity has hit faultlines along the boundaries of the North American Plate, as earlier discussed in the earlier post Ring of Ice.

Bill McGuire, Emeritus Professor of Earth Sciences at the University College London, recently said the following in post at ClimateState.com:

“There may be a threat of submarine landslides around the margins of Greenland, which are less well explored. Greenland is already uplifting, reducing the pressure on the crust beneath and also on submarine methane hydrates in the sediment around its margins, and increased seismic activity may be apparent within decades as active faults beneath the ice sheet are unloaded. This could provide the potential for the earthquake or methane hydrate destabilisation of submarine sediment, leading to the formation of submarine slides and, perhaps, tsunamis in the North Atlantic.

We see evidence of the Earth ‘waking up’ specifically in relation to seismic activity in areas of Alaska where dramatic ice loss (up to 1km vertical thickness) has occurred over the last 100 years, and also in relation to the correlation in many high mountains terrains of increased landslide occurrence and heatwaves.

There is no unequivocal evidence for a specific volcanic response, unless the high level of recent activity at the Icelandic volcanoes is a reflection of unloading due to melting of the Vatnajokull Ice Cap. Certainly this whole region is uplifting by a few centimetres a year, so such a suggestion would not be completely unreasonable, even if we don’t (yet?) have any hard evidence.”


Particularly dangerous in this respect are earthquakes along the fault that crosses the Arctic Ocean, such as the 4.5 M earthquake indicated by the blue dot on the top map, also indicated on the map below. The danger here is that such earthquakes could destabilize methane hydrates that are highly prominent in sediments under the Arctic Ocean.

Map, created with methanetracker.org, with recent earthquakes on the northern boundery of the North American Plate
[click on image to enlarge]
As discussed in earlier posts, wild weather swings could also contribute to destabilization of methane hydrates. Furthermore, a study published this year suggests that human-caused groundwater depletion contributed to the prominence of earthquakes in California. Similar suggestions were made in a study focusing on a 2011 earthquake in Spain.

[ click on image to enlarge ]
Besides the above wild weather swings, wild weather itself could similarly be destructive. As hurricane Sandy approached the U.S. coast in 2012, the force of waves slamming into other waves shook the seafloor, which was recorded by earthquake sensors. The energy generated by Sandy was similar to small earthquakes between magnitudes 2 and 3, seismologists at the University of Utah estimated.

Did typhoon VongFong cause earthquakes around Japan? The image on the right shows earthquakes that occured around Japan during the seven days up to October 16, 2014. Again, the map doesn't show the smaller quakes, so further studies may be needed to shed more light on this.

[ click on image to enlarge ]
As above image shows, some 1500 earthquakes hit the world over a period of seven days up to October 17, 2014, 03:59:21, UTC. Of all these earthquakes, some 1300 hit the U.S. alone. This points at a further cause, i.e. fracking. A recent study has confirmed that fracking is linked to more earthquakes than previously believed.

“Earth to Obama . . .”

from: FAQs
Rob Howarth, Ph.D. and Professor of Ecology and Environmental Biology at Cornell University, comments:

“By once again failing to announce strong, decisive action to combat methane at the recent Climate Summit at the United Nations, Obama missed a major opportunity to demonstrate global leadership on climate change. Global emissions of methane equal or exceed the global emissions of carbon dioxide, when the methane emissions are converted to their equivalency for causing global warming using an integrated 10-year time period.”

Meanwhile, the EPA is still underreporting methane's Global Warming Potential, as earlier discussed at Myth #7 and despite a call by Rob Howarth and other methane experts to accurately account for warming effects of methane.

Update

Below is an updated map with more recent data, showing that over a period of 7 days up to October 18, 2014, 01:39:12 UTC, some 1400 earthquakes hit the U.S. Again, note that the USGS map doesn't show earthquakes under magnitude 4 outside the U.S.


References

- A global surge of great earthquakes from 2004-2014 amd implications for Cascadia - by Thorne Lay
https://gsa.confex.com/gsa/2014AM/webprogram/Paper242140.html

- Ring of Ice
http://arctic-news.blogspot.com/2014/08/ring-of-ice.html

- Methane hydrate destabilisation is clearly a real worry, particularly in the context of warming ocean waters in the East Siberian Continental Shelf
http://climatestate.com/2014/10/16/methane-hydrate-destabilisation-is-clearly-a-real-worry-particularly-in-the-context-of-warming-ocean-waters-in-the-east-siberian-continental-shelf

- Wild Weather Swings
http://arctic-news.blogspot.com/2014/10/wild-weather-swings.html

- Uplift and seismicity driven by groundwater depletion in central California
http://www.nature.com/nature/journal/v509/n7501/full/nature13275.html

- The 2011 Lorca earthquake slip distribution controlled by groundwater crustal unloading
http://www.nature.com/ngeo/journal/v5/n11/full/ngeo1610.html

- Superstorm Sandy's Energy Jolted U.S., Detected By Earthquake Sensors In Pacific Northwest
http://www.huffingtonpost.com/2013/04/18/superstorm-sandy-energy_n_3112814.html

- Sandy Shook US Like an Earthquake
http://www.livescience.com/24726-sandy-earthquake-movie.html

- Fracking Linked to More Ohio Earthquakes
http://www.livescience.com/48294-fracking-caused-ohio-earthquakes.html

- Characterization of an Earthquake Sequence Triggered by Hydraulic Fracturing in Harrison County, Ohio
http://srl.geoscienceworld.org/content/early/2014/10/09/0220140127.extract

- Climate change, Obama, and methane
http://thehill.com/blogs/congress-blog/energy-environment/219704-climate-change-obama-and-methane