 |
| [ click on image to enlarge ] |
Additionally, no data were available for the areas colored darker grey on above image. At lower altitudes, this absence of data can be due to mountains in the area. It can also be that measurements are obscured by clouds, in which case no data are visible for the respective area; again, this doesn't imply that no methane was present there.
So, while there are no data for some areas in the Laptev Sea on Nov. 17, the conclusion must noretheless be that methane was actually present at very high levels all the way from the Laptev Sea to the East Siberian Sea. This conclusion is supported by data from earlier days, e.g. as shown in this post.
Therefore, the situation in the Laptev Sea is worse that it looks at first glance and levels may actually have been even higher on Nov. 17 than the peak reading of 2304 ppb that was recorded on that day. Similarly, more methane may actually be present closer to the North Pole than is showing up on above images.
Why methane is rising from the Arctic seabed
For some time now, huge amounts of methane have been released from the seabed of the Arctic Ocean, reaching the atmosphere at levels of up to 2662 ppb (on November 9, 2013). What caused this? Before examining this further, let's first go back to what was said in an earlier post about warm water off the coast of North Anmerica.
 |
| A dust storm approaches Stratford, Texas, in 1935. From: Wikipedia: Dust Bowl |

Rapid creation of farms and use of gasoline tractors had caused erosion at massive scale.
Extensive deep plowing of the virgin topsoil of the Great Plains in the preceding decade had removed the natural deep-rooted vegetation that previously kept the soil in place and trapped moisture even during periods of drought and high winds.
So, when the drought came, the dust storms emerged. But what caused the drought?
A 2004 study concludes that the drought was caused by anomalous tropical sea surface temperatures (SST) during that decade and that interactions between the atmosphere and the land surface increased its severity (see image above right with SST anomalies).
As the above chart shows, SST anomalies in the days of the Dust Bowl were not greater than 1°C. It is in this context that the current situation in the Arctic must be seen. In 2013, SST anomalies of 5°C or more showed up in virtually all areas in the Arctic Ocean where the sea ice disappeared; some areas are exposed to sea surface temperature anomalies even higher than 8°C (14.4°F), as discussed in the post Arctic Ocean is turning red.

As the above Naval Research Laboratory image shows, strong winds can push a lot of sea ice out of the Arctic Ocean. The resulting absence of sea ice can disrupt vertical sea currents that would otherwise cool the seabed. Furthermore, strong winds can boost warming of the seabed of the Arctic Ocean by mixing warm surface water down the vertical water column. Such feedbacks have been discussed in earlier posts such as the Diagram of Doom. Changes that take place in the Arctic can also cause extreme weather patterns elsewhere, as discussed in an earlier post on changes to the Polar Jet Stream.
Indeed, events can be closely interlinked and the world is now stumbling from one extreme weather event into another. Moreover, things look set to get worse every year. And this can in turn make things even worse in the Arctic. Water off the coast of North America, after reaching 'Record Warmest' temperatures in July 2013, proceeded to travel to the Arctic Ocean, where it is now warming up the seabed.
 |
| NOAA: part of the Atlantic Ocean off the coast of North America reached record warmest temperatures in July 2013 |
Pollution clouds pouring eastwards off the coast of Canada and the United States are the main culprits in heating the Gulf Stream as this region has the highest oceanic evaporation on Earth.

While the mean speed of the Gulf Stream is 4 miles per hour (6.4 km/hour or 1.78 metres/second), the water slows down as it travels north.
 In the much wider North Atlantic Current, which is its North Eastern extension, water flows at about 0.51 metres/second (3.5 times slower), while the West Spitzbergen (Svalbard) current flows at about 0.35 metres/second (5 times slower).
Consequently, it will take quite some time for the summer-heated Gulf Stream waters to reach the Laptev Sea.
In addition, because the Gulf Stream does a closed circuit in the tropical Atlantic, passing close to West Africa (Canary Current) and returning back to the Gulf along the hurricane tracks (North Equitorial Current), it is able to continuously feed hot water into the North Atlantic Current over a very long time period.
This explains why methane is continuously boiling off the subsea methane hydrates from the Eurasian Basin and Laptev Sea during September to November this year and will continue to be emitted past January 2014.
This explains why methane is continuously boiling off the subsea methane hydrates from the Eurasian Basin and Laptev Sea during September to November this year and will continue to be emitted past January 2014.
How much will temperatures rise?
The atmospheric temperature increase in Australia this year (0.22oC) indicates that in 10 years it will exceed 2.2oC and in 30 to 40 years, 6.6oC to 8.8oC.
This is the same as the predicted temperature increase from the Arctic methane build up and will lead to total global deglaciation and our extinction by the middle of this century.
There is in addition a delayed carbon dioxide and methane temperature anomaly of 12oC to 20oC. The 20oC methane delayed temperature anomaly is the same as the temperature anomaly of the hot clouds that have been blowing around the Arctic this year, indicating that the Arctic has almost caught up with the methane delayed global warming heating.
The stage is therefore set for a giant firestorm, drought and sea level rise mostly caused by the uncontrolled build up of methane in the atmosphere due to the carbon dioxide induced global warming destabilization of the Arctic permafrost and subsea methane hydrates.
So, what to do?
The power, prestige and massive economy of the United States have been built on cheap and abundant fossil fuels and Canada is now trying to do the same. Will the US and Canada, in the short time frame we have left (3 decades), be able to eliminate their extreme carbon footprints? Note that Australia, Saudi Arabia and the United Arab Emirates have similar extreme carbon footprints as well. An additional problem is that reducing emissions from coal-fired power plants will also reduce sulfur emissions that currently mask the full wrath of global warming.
A Comprehensive Climate Plan must include ways to reduce methane levels
What we have got to do is eliminate as much of the atmospheric methane by whatever means we are able to devise, to bring its concentration down to about 750 ppb. This level will eliminate the methane delayed temperature anomaly and give the massive industrial nations a little leaway to get their houses in order.
All the scientific expenditure and ingenuity of the major industrial nations should be engaged in developing methods of breaking down atmospheric methane without burning it. Methods of increasing the tropospheric and stratospheric hydroxyl concentrations and using radio - laser systems such as the Alamo - Lucy projects and their applications to HAARP must be developed and tested with the utmost urgency as should local methods of converting carbon dioxide and methane via catalysts into other products. We have to get rid of this methane monster before it devours us all. A French group of scientists and engineers have started work on the Alamo-Lucy projects in Europe. If we fail to reduce the fast growing methane content of the atmosphere in the next few decades we are going to go the same way as the dinosaurs.
I cannot emphasise more, how serious humanity’s predicament is and what we could do to try to prevent our certain extinction if we continue down the present path we are following. If we compare ourselves to the Titanic we are only moments away from hitting the iceberg.

Three more images are added to further illustrate Malcolm Light's words. The above image highlights how much temperatures have been rising in the Arctic over the past few decades. In above image, anomalies are visualized by latitude, but are averaged by longitude globally, masking even higher anomalies that can be experienced at specific areas along the same longitude. At times, some areas in the Arctic do already experience anomalies of over 20°C, as also shown by the image below.

Finally, the image below, from a post at the methane-hydrates blog.

All this calls for comprehensive and effective action, as described at the Climate Plan blog.
Related
- Causes of high methane levels over Arctic Ocean
- Climate Plan
- Horrific amounts of methane over Laptev Sea
- Unfolding Methane Catastrophe
- Methane Release caused by Earthquakes
- Temperature Rise
- North Hole
- The LUCY project
- The Alamo Project


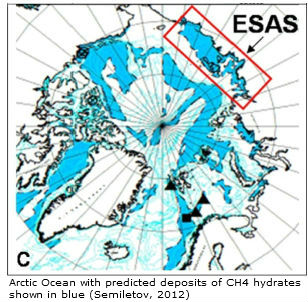 Vast amounts of methane are held in sediments under the Arctic Ocean. The Laptev Sea is part of the Eastern Siberian Arctic Shelf (ESAS, the rectangle on the image on the right). Shakhova et al. (2010) estimate the accumulated methane potential for the ESAS alone as follows:


