Saturday, September 22, 2012

Professor Peter Wadhams calls for action

In the Youtube video below, Professor Peter Wadhams, Professor of Ocean Physics and Head of the Polar Ocean Physics Group of the University of Cambridge and one of the world's top sea-ice experts, joins The Big Picture, a show with Thom Hartmann filmed live and broadcast from the RT America studios in Washington DC.

Professor Wadhams warns that the Arctic sea ice looks set to be completely melted in just a few years. Professor Wadhams adds that action is needed that includes not only emissions cuts, but also geoengineering methods.

It was a Skype connection, so the sound quality was not optimal, but Peter Carter has improved this in the version below. Anyway, the message is important enough to be watched closely and to be further shared and discussed.


The diagram below illustrates this further.

more on this diagram

As the Arctic sea ice retreats, an ever smaller area remains in summer. Snow cover on the ice reflects between 80% and 90% of sunlight, while the dark ocean without ice cover reflects only 7% of the light, explains Stephen Hudson of the Norwegian Polar Institute. As the sea ice cover decreases, less solar radiation is reflected away from the surface of the Earth in a feedback effect that causes more heat to be absorbed and consequently melting to occur faster still.

The image below shows the retreat in September 2012 to date, compared with 7 other recent years.

credit: Arctic Sea Ice Blog
The image below further illustrates the rate at which Arctic sea ice is declining, and thus losing  its reflectivity.

Image produced by Peter Carter based on NSIDC images, showing the now exposed permafrost areas that extend from the continents into the shallow parts of the Arctic Ocean. 

NASA images showing the difference between sea ice cover between 1980 and 2012.

If you like, read more about this at the post Albedo change in the Arctic.

Friday, September 21, 2012

Arctic sea ice gone in September 2014

NSIDC have already made a preliminary call that September 16 was the date that sea ice extent was at its minimum in the year 2012.

Volume is something else and the record low hasn't been called yet. Nonetheless, it's interesting to look at where the trend might point at, once a value for 2012 has been added into the picture. On the interactive graph below, data for September 2nd have been added.

Granted, when making projections, it's good to have sophisticated models. I don't claim to have used those, but I've got a good eye and by the looks of it, sea ice will be gone in September 2014.


I look forward to your comments.

Wednesday, September 19, 2012

NSIDC calls record 2012 low

This NASA satellite image shows how the Arctic sea ice extent, on Sept. 16, 2012, compares to the average
minimum extent over the past 30 years (in yellow). Credit: NASA/Goddard Scientific Visualization Studio.
Arctic sea ice cover likely melted to its minimum extent for the year on September 16, says the National Snow and Ice Data Center (NSIDC), adding the note that this number is preliminarychanging weather conditions could still push the ice extent lower.

Sea ice extent—defined by NSIDC as the total area covered by at least 15 percent of ice—fell to 3.41 million square kilometers (1.32 million square miles), now the lowest summer minimum extent in the 33-year satellite record.

NSIDC adds that this minimum is 49% below the 1979 to 2000 average, as illustrated by the table below.

Table 1. Previous minimum Arctic sea ice extents
 YEARMINIMUM ICE EXTENTDATE
IN MILLIONS OF SQUARE KILOMETERSIN MILLIONS OF SQUARE MILES
20074.171.61September 18
20084.591.77September 20
20095.131.98September 13
20104.631.79September 21
20114.331.67September 11
20123.411.32September 16
1979 to 2000 average6.702.59September 13
1979 to 2010 average6.142.37September 15

NSIDC adds that the six lowest seasonal minimum ice extents in the satellite record have all occurred in the last six years (2007 to 2012). In contrast to 2007, when climatic conditions (winds, clouds, air temperatures) favored summer ice loss, this year’s conditions were not as extreme. Summer temperatures across the Arctic were warmer than average, but cooler than in 2007. The most notable event was a very strong storm centered over the central Arctic Ocean in early August. It is likely that the primary reason for the large loss of ice this summer is that the ice cover has continued to thin and become more dominated by seasonal ice. This thinner ice was more prone to be broken up and melted by weather events, such as the strong low pressure system just mentioned. The storm sped up the loss of the thin ice that appears to have been already on the verge of melting completely.

NASA says that this year, a powerful cyclone formed off the coast of Alaska and moved on August 5 to the center of the Arctic Ocean, where it churned the weakened ice cover for several days. The storm cut off a large section of sea ice north of the Chukchi Sea and pushed it south to warmer waters that made it melt entirely. It also broke vast extensions of ice into smaller pieces more likely to melt.

“The storm definitely seems to have played a role in this year's unusually large retreat of the ice”, said Claire Parkinson, a climate scientist at NASA Goddard Space Flight Center, Greenbelt, Md. “But that exact same storm, had it occurred decades ago when the ice was thicker and more extensive, likely wouldn't have had as prominent an impact, because the ice wasn't as vulnerable then as it is now.”

In the press release, NSIDC lead scientist Ted Scambos said that thinning ice, along with early loss of snow, are rapidly warming the Arctic. “But a wider impact may come from the increased heat and moisture the warmer Arctic is adding to the climate system,” he said. “This will gradually affect climate in the areas where we live,” he added. “We have a less polar pole—and so there will be more variations and extremes.”

The image below, from Arctic Sea Ice Blog, shows Arctic sea ice observations (in red) against the backdrop of models used in IPCC AR4 (2007) for projection of sea ice up to the year 2100.


The image below, from NSIDC sea ice news, shows the observed September sea ice extent for 1952-2011 (black line) against a backdrop of projections used by IPCC AR4 (blue) as well as proposed for use in IPCC AR5 (red).

Note: The record low value for 2012 still has to be added on this image. Credit: NSIDC, Stroeve et al.
The image shows that the recently observed decline in sea ice extent is steeper than the CMIP3 models with a “business as usual” SRESA1B greenhouse gas emissions scenario (blue line), as used by the IPCC in AR4.

It is also steeper than the more recent CMIP5 models using a RCP 4.5 scenario (pink line) that are proposed to be used by the IPCC in AR5.

RCP 4.5 is a scenario in which the global temperature rise would would soon exceed 2 degrees Celsius. Since the Arctic experiences accelerated warming, such a scenario would clearly be catastrophic. Looking at sea ice volume, rather than extent, would show this even more clearly.

Below, a NOAA animation showing sea ice decline in 2012 and a NASA animation showing the Arctic cyclone.

Monday, September 17, 2012

UK MET Office keeps downplaying significance of events in the Arctic

One of the most respected datasets on Arctic sea ice volume is produced by the Pan-Arctic Ice Ocean Modeling and Assimilation System (PIOMAS, Zhang and Rothrock, 2003) developed at the Polar Science Center, Applied Physics Laboratory, University of Washington. The graph below shows PIOMAS data for annual minimum Arctic sea ice volume (black dots) with an exponential trend added (in red).


The Arctic Methane Emergency Group (AMEG), in a February 12, 2012, written submission to the U.K.  Environmental Audit Committee (EAC), pointed at the graph:
 . . summer volume [is] less than 30% of its value 20 years ago. The trend in volume is such that if one extrapolates the observed rate forward in time, by following an exponential trend line, one obtains a September near-disappearance of the ice by 2015.

The MET Office, in a March 8, 2012, written submission:
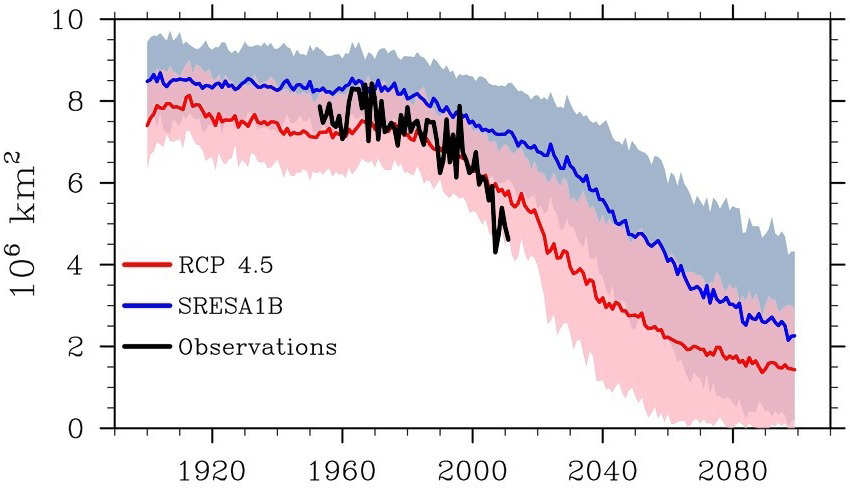
Climate models project the Arctic will become ice-free during summer at some point this century – though likely not before 2040. . . In September 2007, sea ice extent reached an all-time low, raising the question of whether the sea ice is likely to melt more quickly than has been projected. There is, however, no evidence to support claims that this represents an exponential acceleration in the decline. Indeed, modelling evidence suggests that Arctic sea ice loss would be broadly reversible if the underlying warming were reversed.

Professor Slingo, Chief Scientist, MET Office, elaborated on this in a March 14, 2012, oral submission:
Q114 Chair: . . when the Arctic will be ice free in summer. . .
Professor Slingo: . . Our own model would say between 2040 and 2060 . .

Q115 Chair: You would rule out an icefree summer by as early as 2015, for example?
Professor Slingo: Yes we would . . .

Q117 Chair: . . In terms of the modelling that you are using, does that cover . . . volume of ice?
Professor Slingo: We run quite a sophisticated sea ice model. . . and we are looking forward now to the new measurements from CryoSat-2.

Q118 Chair: . . evidence that we had suggested that the volume of ice had already declined by 75%, and that further decreases may cause an immediate collapse of ice cover.
Professor Slingo: I wouldn’t [give credence to that]. We don’t know what the thickness of ice is across the whole Arctic with any confidence. . . I probably would [rule it out altogether] . . . to say we have lost 75% of the volume is inconsistent with our assessments.

Professor Laxon, director of Centre for Polar Observation and Modelling, where CryoSat-2 data is being analysed, in an August 24, 2012, written submission:
. . [analysis of] CryoSat-2 and ICESat data . . suggest a decrease in ice volume over the period 2003–12 at least as large as that simulated by PIOMAS, and possibly higher.

The Met Office, in an August 31, 2012, supplementary written submission:
The changes in observed sea-ice volume only extends [sic] over a few years and cannot in isolation be interpreted as representative of a long term trend. . . . The extrapolation of short-term trends in ice volume is not a reliable way to predict when the Arctic will be seasonally ice free as negative feedbacks and changing weather patterns may slow the rate of ice loss. . . it is worth noting that climate models can show a period of recovery in ice volume following periods of large ice volume loss.

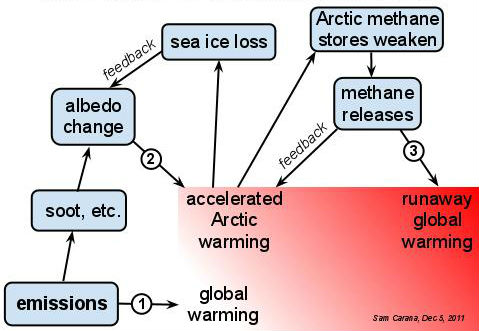
For some curious reason, some people seek to downplay the significance of the events taking place in the Arctic, as well as the risk of methane releases. Here's more on that.

AMEG added, in its above February 12, 2012 written submission:
The catastrophic risk of global warming leading to very large emissions of methane from large Arctic carbon pools, especially from subsea methane hydrate, is documented in the 2007 IPCC assessment.

By collaborating with others to protect the Arctic, a climate of cooperation can be engendered to protect the whole planet for the benefit of ourselves and future generations.

Professor Lenton, in a Feb 21, 2012, oral submission:
. . the Hadley Centre [has] permafrost in the latest state-of-the-art model . . . their best estimate is we may get 0.1°C of extra warming at the end of the century from the loss of methane from the northern high latitudes.

Professor Slingo, in the above March 14, 2012, oral submission:
Q126 Dr Whitehead:. . what sort of modelling factors may be accounted for by the possibility of tipping points or feedback attached to these? For example, the argument that follows very substantially from the extent of continental shelf that there is within the Arctic Basin and, therefore, the particular relationship that warming on that relatively shallow sea has on trapped methane-for example, the emergence of methane plumes in that continental shelf, apparently in quite an anomalous way-leading possibly to the idea that there may be either tipping points there or catastrophic feedback mechanisms there, which could then have other effects on things, such as more stabilised caps like the Greenland ice cap and so on. I rapidly collated all the possible catastrophe theories, but I mean how are those factored into the modelling process?

Professor Slingo: . . we are not looking at catastrophic releases of methane. . . We don’t see catastrophic change in the Arctic that would lead to catastrophic releases of methane, or very large changes in the thermohaline circulation, within the next century. Our understanding of the various feedbacks-and it is a very complex system-both through observations and modelling, suggests that we won’t see those catastrophic changes, in terms of the physical system.

Note that the above are excerpts, to make things easier to read. For the full text, click on the respective links.

Below an update of the image, produced earlier this month, with recent volume data for 2012 added. On September 2, 2012, PIOMAS recorded a volume of 3407 cubic km of ice, i.e. very close to what the exponential line projected. The volume is likely to continue to fall further before reaching its final 2012 minimum.
The image below shows Arctic sea ice extent (total area of at least 15% ice concentration) for the last 7 years, compared to the average 1972-2011, as calculated by the Polar View team at the University of Bremen, Germany.