Friday, August 31, 2012

Paul Beckwith on ice speed and drift - update 1


Above image shows Arctic sea ice extent (total area of at least 15% ice concentration) for the last 7 years, compared to the average 1972-2011, as calculated by the Polar View team at the University of Bremen, Germany.

View Paul Beckwith's August 30 presentation on sea ice speed and drift by clicking on the following link:
https://docs.google.com/file/d/0ByLujhsHsxP7VTlsczIyalpjNDQ/edit


Or, view the presentation in the window below (it may take some time for the file to fully load).

Two earthquakes off the coast of Jan Mayen Island

Two earthquakes struck the waters off the coast of Jan Mayen Island on August 30, 2012. One had  a magnitude of 6.8 on the Richter Scale and occurred at 13:43 pm (UTC), and was followed eight minutes later by a second one with a magnitude of 5.2 on the Richter Scale that took place on 13:51 pm (UTC).

The location of the earthquakes is indicated by the blue square on the top left of the USGS map below.


The Google map below shows that the location is on fault line extending north into the Arctic Ocean.


The map below shows the two earthquakes at the top in orange. The map shows all earthquakes with a magnitude 5.0 or higher that happened worldwide from August 1 to 30, 2012.


The largest earthquake in August 2012 was a magnitude 7.7 quake on August 14 in the Sea of Okhotsk, close to Sakhalin, Russia's largest island.  With a depth of 626 km (389 miles), it was a "deep-focus" earthquake. Such quakes can be felt at great distance from their epicenters.

As the above map shows, this 7.7 M earthquake and the two recent ones off the coast of Jan Mayen Island occurred on the same fault line that goes over the Arctic. The danger is that further earthquakes on this fault line could destabilize methane hydrates in the Arctic, triggering release of huge amounts of methane.

The map below, from this page, shows fault lines and elevation in meters.


In 2011, a number of posts were added on this topic at knol, which has meanwhile discontinued. These posts have been preserved at the following pages:
Methane linked to Seismic Activity in the Arctic
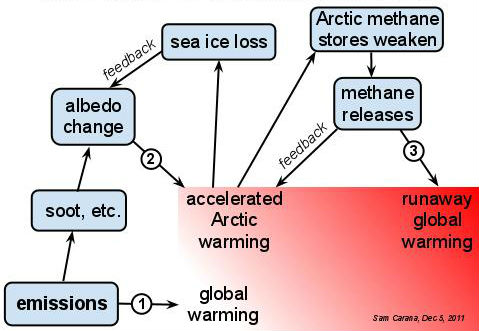
Runaway warming
Thermal expansion of the Earth's crust necessitates geoengineering


Wednesday, August 29, 2012

Arctic sea ice area already shrank by over 81 percent this year


Arctic sea ice area already shrank by over 81% this year.

Arctic sea ice area was 13.70851 million square km on the 88th day of 2012, as illustrated on the image below by The Cryosphere Today.  The image further below shows that only 2.59449 million square km was left of Arctic sea ice area on the 238th day of 2012. In other words, less than 19% is left of the sea ice area there was earlier this year.

And there's still quite a few days to go in the melting season.


Tuesday, August 28, 2012

Arctic Sea Ice Collapse Food Emergency

Arctic Sea Ice Collapse Food Emergency
a video by Peter Carter of
ArcticClimateEmergency.com


Diagram of Doom


Above diagram was part of a poster displayed at the 2011 AGU meeting in San Francisco by the Arctic Methane Emergency Group (AMEG). It was accompanied by the following text: In the Arctic, three problems are compounding one another: emissions causing global warming, sea ice loss causing accelerated warming, and methane releases further accelerating Arctic warming, with the danger of triggering runaway global warming.

The diagram pictures three kinds of warming and their main causes:
  1. Emissions by people causing global warming, with temperatures rising around the globe, including the Arctic.
  2. Soot, dust and volatile organic compounds settling down on snow and ice, causing albedo change. More heat is absorbed, rather than reflected as was previously the case. This causes accelerated warming in the Arctic.
  3. Accelerated warming in the Arctic threatening to weaken methane stores in the Arctic with the danger that methane releases will trigger runaway global warming.

The diagram also pictures two feedback effects that make things even worse:
  • Albedo feedback: Accelerated warming in the Arctic speeds up sea ice loss, further accelerating albedo change.
  • Methane feedback: Methane releases in the Arctic further add to the acceleration of warming in the Arctic, further contributing to weaken Arctic methane stores and increasing the danger that methane releases will trigger runaway global warming.

Albedo change in the Arctic comprises a number of elements, as depicted in the image below, from the 2004 report Impacts of a Warming Arctic - Arctic Climate Impact Assessmentby the International Arctic Science Committee.  


As described in various posts at this blog over time, there are further points that should be taken into account. Regarding sea ice loss, it's clear that where sea ice retreats, more open water appears, with the result that less sunlight is reflected back into space. Accelerated warming will also affect the integrity of the remaining sea ice, as well as of the snow and ice cover on land, including glaciers. This further adds to the albedo effect, causing less sunlight to be reflected back into space. Similarly, further feedbacks could be added or described in more detail.

Accordingly, ten feedbacks can be identified, and described as follows:
  1. Albedo feedback: Accelerated warming in the Arctic speeds up the decline of ice and snow cover, further accelerating albedo change. 
  2. Methane feedback: Methane releases in the Arctic further add to the acceleration of warming in the Arctic, further contributing to weaken Arctic methane stores and increasing the danger that methane releases will trigger runaway global warming. 
  3. Currents feedback: Sea ice loss can cause vertical sea currents to weaken, reducing the cooling effect they had on the seabed. This can thus further cause sediments to warm up that can contain huge amounts of methane in the form of free gas and hydrates. 
  4. Storms feedback: Increased frequency and intensity of storms can cause substantially more vertical mixing of the sea water column, causing more warming of the seabed, thus further contributing to the warming of sediments, as above. 
  5. Storms feedback: Accelerated warming in the Arctic can result in more storms, causing mixing of cold Arctic air with warmer air from outside the Arctic. The net result is a warmer Arctic. 
  6. Storms feedback: More open waters can result in more storms that can push the ice across the Arctic Ocean, and possibly all the way out of the Arctic Ocean. 
  7. Storms feedback: Storms also cause more waves that break up the sea ice. Smaller pieces of ice melt quicker than large pieces. A large flat and solid layer of ice is also less susceptible to wind than many lighter and smaller pieces of ice that will stand out above the water and capture the wind like the sails of yachts. 
  8. Storms feedback: Storms cause waters to become more wavy. Calm waters can reflect much sunlight back into space, acting as a mirror, especially when the sun shines under a low angle. Wavy waters, on the other hand, absorb more sunlight. 
  9. Fires feedback: More extreme weather comes with heatwaves and storms. Thus, this is in part another storms feedback. The combination of storms and fires can be deadly. Heatwaves can spark fires that, when fueled up by storms, turn into firestorms affecting huge areas and causing huge amounts of emissions. Storms can whip up particles that when deposited on ice, snow or the bare soil, can cause more sunlight to be absorbed. 
  10. Open doors feedback: Accelerated warming in the Arctic causes the polar vortex and jet stream to weaken, causing more extreme weather and making it easier for warm air to enter the Arctic.

These ten feedback are depicted in the diagram below. 


Opening further Doorways to Doom


Until now, the Arctic has been protected from overheating in a number of ways.


Negative Arctic Oscillation conditions are associated with
higher pressure in the Arctic and a weakened polar vortex
(yellow arrows). A weakened jet stream (black arrows) is  
characterized by larger-amplitude meanders in its trajectory
and a reduction in the wave speed of those meanders.
Snow and ice that grows in winter will act as a buffer when temperatures rise in summer. A bright snow and ice cover will reflect most sunlight back into space. Furthermore, a lot of the sunlight that isn't reflected will be consumed by the process of turning snow and ice into water, which occurs while temperatures remain at the melting point of 0°C (32°F, 273.15 K).

The Arctic is further protected from overheating by the polar vortex and jet stream, which act to keep cold air in the Arctic and keep warm air out. However, accelerated warming in the Arctic is now causing the polar vortex and jet stream to weaken. 


Accelerated warming in the Arctic alters the polar jet stream by slowing its speed and by increasing its waviness. Larger swings in the jet stream allow frigid air from the Arctic to plunge farther south, as well as warm, moist tropical air to penetrate northward, explains Jennifer Francis, research
professor at the Institute of Marine and Coastal
Sciences at Rutgers University.

The polar jet stream can travel at speeds greater than 100 mph. Here, the fastest winds are colored red; 
slower winds are blue. View animated version here. Credit: NASA/Goddard Space Flight Center

What is described above can be regarded as an "open doors feedback". It's like leaving the doors open when it's cold inside and hot outside.

Accelerated warming in the Arctic comes with many such feedbacks, e.g. higher temperatures and more open water in the Arctic can also be expected to increase the danger that storms will batter the sea ice with greater ferocity. This is depicted in the image below.


In many ways, this is opening the doorways to doom. The biggest danger is that temperature rises will cause Arctic methane stores to weaken, resulting in huge amounts of methane to be released, triggering warming that could escalate into runaway global warming.  

The image below shows the sea surface temperature anomaly for August 27, 2012, by the National Oceanic and Atmospheric Administration (NOAA).


Rising temperatures in the Arctic threaten to trigger methane releases, as shown on the poster below.


The poster is also part of the presentation below:


Monday, August 27, 2012

Paul Beckwith on ice speed and drift


Above image shows Arctic sea ice extent (total area of at least 15% ice concentration) for the last 7 years, compared to the average 1972-2011, as calculated by the Polar View team at the University of Bremen, Germany.

View Paul Beckwith's August 27 presentation on sea ice speed and drift by clicking on the following link:
https://docs.google.com/file/d/0ByLujhsHsxP7OXliVnN4T3lnekE/edit


Or, view the presentation in the window below (it may take some time for the file to fully load).