Showing posts with label water. Show all posts

Wednesday, February 19, 2014

High methane levels over the Arctic Ocean on February 17, 2014


Above image shows IASI methane readings over the last day or so, when levels as high as 2223 ppb were recorded.

Where does the methane come from?

On above image, methane shows up prominently along the faultline that crosses the Arctic Ocean from the northern tip of Greenland to the Laptev Sea. This indicates that the methane originated from the depths of the Arctic Ocean, where sediments contain large amounts of methane in the form of free gas and hydrates, which have become destabilized.

High methane concentrations have persistently shown up over the Arctic Ocean since October 1, 2013. On January 19, 2014, levels as high as 2363 ppb were recorded over the Arctic Ocean, as illustrated by the image below, from an earlier post.

[ from earlier post, click on image to enlarge ]
Below is a comparison of methane readings for the week from February 9 to 16, 2014, compared to the same period in 2013.

[ from earlier post, click on image to enlarge ]
The above comparison shows that there is a lot of methane over the Arctic Ocean that wasn't there last year. 

Furthermore, high methane readings show up where currents move the sea ice out of the Arctic Ocean, in areas such as Baffin Bay. This indicates that methane that is released from the seafloor of the Arctic Ocean appears to be moving underneath the ice along with exit currents and entering the atmosphere where the sea ice is fractured or thin enough to allow the methane to pass through. 

Also note that more orange areas show up on the southern hemisphere in 2014, indicating that more methane from the northern hemisphere is now spreading south beyond the equator. This in addition to indications that more methane is rising and building up at higher altitudes, as discussed in an earlier post.

Causes

What made these high releases from the seafloor of the Arctic Ocean persist for so long? At this time of year, one might have thought that the water in the Arctic Ocean would be much colder than it was, say, on October 1, 2013.

Actually, as the combination image below shows, sea surface temperatures have not fallen much at the center of the Arctic Ocean between early October, 2013 (left) and February 17, 2014 (right). In the area where these high methane concentrations occured, sea surface temperatures have remained the same, at about zero degrees Celsius.

[ click on image to enlarge ]
The above comparison image shows that, while surface temperatures in the Atlantic Ocean may have fallen strongly with the change of seasons, surface temperatures in the Arctic Ocean have changed only little.

In this case of course, what matters more than surface temperatures are water temperatures at greater depth. Yet, even here temperatures in the Arctic Ocean will have decreased only slightly (if at all) compared to early October 2013, since the Gulf Stream has continued to push warmer water into the Arctic, i.e. water warmer than the water in the Arctic Ocean, so the heating impact of the Gulf Stream continues. Also, sea surface temperature anomalies along the path of the Gulf Stream continue to be anomalously high, as the image below shows.


The situation looks even more grim on the Climate Reanalyzer image below, showing sea surface temperature anomalies that are far more profound in the Arctic Ocean.


Note also that, as the sea ice extent increased, there have been less opportunities for the heat to evaporate on the surface and for heat to be transferred from the Arctic Ocean to the air.

Finally, what matters a lot is salinity. The combination image below compares salinity levels between October 1, 2013 (left), and February 17, 2014 (right).

[ click on image to enlarge ]
Salinity levels were low on October 1, 2013, as a lot of ice and snow had melted in the northern summer and rivers had carried a lot of fresh water into the Arctic Ocean. After October 1, 2013, little or no melting took place, yet the Gulf Stream continued to carry waters with higher salt levels from the Atlantic Ocean into the Arctic Ocean.

Annual mean sea surface salinity
Seawater typically has a salinity level of over 3%; it freezes and melts at about −2°C (28°F). Where more saline water from the Atlantic Ocean flows into the Arctic Ocean, the water in the Arctic Ocean becomes more saline. The freezing and melting point of fresh water (i.e. zero salinity) is 0°C (or 32°F). More salinity makes frozen water more prone to melting, i.e. at temperatures lower than 0°C, or as low as −2°C.

As the salinity levels of the water on the seafloor of the Arctic Ocean increased, the ice that had until then held the methane captive in hydrates on the seafloor of the Arctic Ocean started to melt. Indeed, the areas in the Arctic Ocean where the high methane releases occurred on January 14, 2014 (top image) show several practical salinity units (psu) increase since October 1, 2013.

Higher salinity levels are showing up closer to the faultline that runs through the Arctic Ocean from the top of Greenland to the Laptev Sea.

Thursday, January 16, 2014

High methane levels over the Arctic Ocean on January 14, 2014

[ click on image to enlarge - note that 'level' is the peak reading for the respective altitude ]
Above image shows IASI methane levels on January 14, 2014, when levels as high as 2329 ppb were recorded. This raises a number of questions. Did these high methane levels originate from releases from the Arctic Ocean, and if so, how could such high methane releases occur from the seafloor of the Arctic Ocean at this time of year, when temperatures in the northern hemisphere are falling?

Location

Let's first establish where the methane releases occurred that caused these high levels. After all, high methane concentrations are visible at a number of areas, most prominently at three areas, i.e. at the center of the Arctic Ocean, in Baffin Bay and over an area in Asia stretching out from the Taklamakan Desert to the Gobi Desert.

Closer examination, illustrated by the inset, shows that the highest methane levels were recorded in the afternoon, and at altitudes where methane concentrations over these Asian deserts and over Baffin Bay were less prominent, leading to the conclusion that these high methane levels did indeed originate from the seafloor of the Arctic Ocean.

The image below, showing 1950+ ppb readings over the past few days, illustrates the magnitude of the methane concentrations over the Arctic Ocean.


High concentrations persist over the Arctic Ocean

High methane concentrations have persistently shown up over the Arctic Ocean from October 1, 2013, through to January 2014. On January 19, 2014, levels as high as 2363 ppb were recorded over the Arctic Ocean, as illustrated by the image below.

[ click on image to enlarge ]
Causes

What caused these high releases from the seafloor of the Arctic Ocean to persist for so long? At this time of year, one may have thought that the water in the Arctic Ocean would be much colder than it was, say, on October 1, 2013.

Actually, as the combination image below shows, sea surface temperatures have not decreased much at the center of the Arctic Ocean between early October, 2013 (left) and January 14, 2014 (right). In the area where these high methane concentrations occured, sea surface temperatures have remained the same, at about zero degrees Celsius.

[ click on image to enlarge ]
Furthermore, as the above image shows, surface temperatures in the Atlantic Ocean may have fallen dramatically with the change of season, but temperatures in the Arctic Ocean have changed only little.

In this case of course, what matters more than surface temperatures are water temperatures at greater depth. Yet, even here temperatures in the Arctic Ocean will have decreased only slightly since early October 2013, as the Gulf Stream has continued to push warmer water into the Arctic, i.e. water warmer than the water in the Arctic Ocean. In other words, the heating impact of the Gulf Stream has continued.

Furthermore, as the sea ice extent increased, there have been less opportunities for the heat to evaporate on the surface and for heat to be transferred from the Arctic Ocean to the air.

Finally, what matters a lot is salinity. The combination image below compares salinity levels between October 1, 2013 (left), and January 14, 2014 (right).

[ click on image to enlarge ]
Salinity levels were low on October 1, 2013, as a lot of ice and snow had melted in the northern summer and rivers had carried a lot of fresh water into the Arctic Ocean. After October 1, 2013, little or no melting took place, yet the Gulf Stream continued to carry waters with higher salt levels from the Atlantic Ocean into the Arctic Ocean.

Annual mean sea surface salinity
Seawater typically has a salinity level of over 3%; it freezes and melts at about −2°C (28°F). Where more saline water from the Atlantic Ocean flows into the Arctic Ocean, the water in the Arctic Ocean becomes more saline. The freezing and melting point of fresh water (i.e. zero salinity) is 0°C (or 32°F). More salinity makes frozen water more prone to melting, i.e. at temperatures lower than 0°C, or as low as −2°C.

As the salinity levels of the water on the seafloor of the Arctic Ocean increased, the ice that had until then held the methane captive in hydrates on the seafloor of the Arctic Ocean started to melt. Indeed, the areas in the Arctic Ocean where the high methane releases occurred on January 14, 2014 (top image) show several practical salinity units (psu) increase since October 1, 2013.

Higher salinity levels are now reaching the faultline that runs through the Arctic Ocean from the top of Greenland to the Laptev Sea, where major releases are taking place now, as illustrated by the image below, with faultlines added on the insets.

[ click on image to enlarge ]
Above image shows methane levels recorded on the evening of January 16, 2014 (main image). The top left inset shows all methane readings of 1950 ppb and higher on January 15 and 16, 2014, while the bottom left inset shows methane readings of 1950 ppb and higher on January 16, 2014, p.m. only and for seven layers only (from 469 to 586 mb), when levels as high as 2353 ppb were reached (at 469 mb).

Quantities

These high levels of methane showing up over the Arctic Ocean constitute only part of the methane that did escape from the seafloor of the Arctic Ocean. Where these high concentrations did show up, the ocean can be thousands of meters deep, giving microbes plenty of opportunity to decompose methane rising through the water first. Furthermore, the methane has to pass through sea ice that is now getting more than one meter thick in the area where these high levels of methane showed up on satellite records. In conclusion, the quantities of methane that were actually released from the seafloor must have been huge.

Importantly, these are not one-off releases, such as could be the case when hydrates get destabilized by an earthquake. As the Arctic-news blog has documented, high releases from the seafloor of the Arctic Ocean have been showing up persistently since early October 2013, i.e. three months ago. This blog has warned about the threat for years. This blog has also described in detail the mechanisms that are causing these releases and the unfolding climate catastrophe that looks set to become more devastating every year.

Given that a study submitted in April 2013 concluded that 17 Tg annually was escaping from the East Siberian Arctic Shelf alone, given the vast quantity of the releases from hydrates that show up on IASI readings and given the prolonged periods over which releases from hydrates can persist, I put the methane being released from hydrates under the seafloor of the Arctic Ocean in the highest category, rivaling global emissions from fossil fuel, from agriculture and from wetlands. As said, the amounts of methane being released from hydrates will be greater than the methane that actually reaches the atmosphere. To put a figure on the latter, my estimate is that emissions from hydrates and permafrost currently amount to 100 Tg annually, a figure that is growing rapidly. This 100 Tg includes 1 Tg for permafrost, similar to IPCC estimates.


This is vastly more than the IPCC's most recent estimates, which put emissions from hydrates and permafrost at 7 Tg annually, a mere 1% of the total annual methane emissions globally, as illustrated by the image below.


Impacts and Response

Huge releases from the seafloor of the Arctic Ocean have occurred persistently since early October 2013, even when releases like this may show up for one day in one area without showing up in that same area the next day on satellite images.

This apparent 'disappearance' can be due to the Coriolis effect that appears to move the methane, whereas it is in fact the Earth that is spinning underneath the methane. This doesn't mean that the methane had disappeared. Actually, much of this methane will persist over the Arctic for many years to come and will continue to exercize its very high initial warming potential over the Arctic for years.

Furthermore, even if less methane may show up on satellite images the next day, that doesn't necessarily mean that releases from the seafloor has stopped. Instead, it looks like methane is being released continuously from destabilizing hydrates. The methane may accumulate underneath the sea ice for some time, to burst through at a moment when fractures or ruptures occur in the sea ice, due to changes in wind and wave height.


The threat here is that methane will further warm up the air over the Arctic, causing further weakening of the Jet Stream and further extreme weather events, particularly extreme warming of water all the way along the path of the Gulf Stream from the Atlantic Ocean into the Arctic Ocean, in turn triggering further releases from hydrates at the seafloor of the Arctic Ocean and escalating into runaway global warming. This threat calls for comprehensive and effective action, such as described at the ClimatePlan blog.


Tuesday, October 15, 2013

High Methane Readings continue over Depth of Arctic Ocean

The image below contains 12 frames, with methane readings recorded over 12 days in the first half of October 2013.

[ click on image to enlarge ]
As discussed in earlier posts at this blog, high methane readings have been recorded recently over the depth of Arctic Ocean. Above image shows that these high readings are continuing. The image below shows that at 469 mb, the altitude at which the highest reading was recorded on the afternoon of October 13, methane shows up very prominently over the Arctic Ocean.

The fact that little methane shows up elsewhere indicates that methane is present at high levels, at times over 2200 ppb, over the depth of the Arctic Ocean, and that these high levels result from methane that originates from hydrates under the seabed.

The image below, with methane readings over the past few days (from October 12 10:00 pm to October 14 11:23 pm), shows high levels of methane over the depth of the Arctic Ocean.


The image below shows methane readings at 586 mb, the altitude at which the highest methane reading was recorded on the afternoon of October 14 (a reading of 2248 ppb). Again, methane is present very prominently over the depth of the Arctic Ocean.


Friday, July 26, 2013

Warm water keeps flowing into the Kara Sea

The image below, from methanetracker.org, shows methane levels at 1950 and higher in yellow, for the period of July 17 to July 23, 2013.

[ click on image to enlarge ]
The temperature map below, for July 26, 2013, from Wunderground, shows that high temperatures are still prominent in Russia, at much the same location where most of the methane in above image shows up.


High temperatures warm up the water flowing into the Kara Sea, as shown on the image below for July 26, 2013, from the Danish Meteorological Institute.


Thursday, July 11, 2013

Arctic melt hits food security in bitter taste of life on a hotter planet

by David Spratt
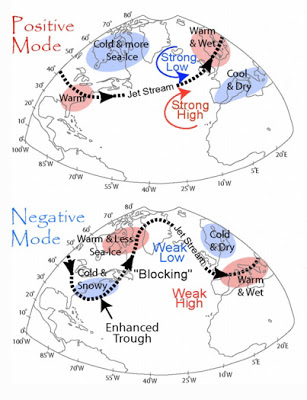
Arctic melt has pushed the Jet Stream into a more
meandering, S-shape pattern, dragging 
down and
stalling cold and wet conditions 
over Europe

A wet summer and autumn, followed by a cold winter and spring, in the UK and Ireland have hit wheat and potato production and cattle feed, a foretaste of how climate change can affect food security, even in the developed economies.

And the culprit in this drama is rapid Arctic melting, which has destabilised the Jet Steam and brought extreme weather – unusual cold, heavy snowfall, record rain and hot spells — to much of northern Europe and North America, and record heat to the Arctic. Following Superstorm Sandy’s battering of the US north-east coast in 2012, flooding in June across central Europe was the worst in 400 years.

Rapid Arctic melting – sea-ice volume in September 2012 was down by four-fifths compared to the summer average 30 years ago – has help change the Jet Stream, the river of high altitude air that works to separates Arctic weather from that of northern Europe, Russia and Canada, and which governs much northern hemisphere weather.

The ice loss has added to ocean and atmospheric heat, pushing the Jet Stream into a more meandering, S-shape pattern, dragging down and stalling cold and wet conditions over Europe, and bringing record heat to the Arctic, as was dramatically experienced in Alaska last month.

Professor Jennifer Francis, of Rutgers Institute of Coastal and Marine Science, says the Arctic-driven changes to the Jet Stream allows “the cold air from the Arctic to plunge much further south. The pattern can be slow to change because the [southern] wave of the jet stream is getting bigger… so whatever weather you have now is going to stick around”.

In March, new research found that “the severe loss of summertime Arctic sea ice — attributed to greenhouse warming — appears to enhance Northern Hemisphere jet stream meandering, intensify Arctic air mass invasions toward middle latitudes, and increase the frequency of atmospheric blocking events like the one that steered Hurricane Sandy west into the densely populated New York City area”.

And a recent study by Liu et al found that “the recent decline of Arctic sea ice has played a critical role in the recent cold and snowy winters” across the northern hemisphere.

Last September, Francis warned that 2012′s record sea ice melt could lead to a cold winter in the UK and northern Europe. And so it turned out, with farmers copping the consequences:

WET SUMMER AND AUTUMN: Six out of the last seven summers in the UK (since the record-smashing Arctic melt of 2007) have seen below-average temperatures and sunshine, and above-average rainfall. 2012 was the UK’s second wettest year on record, with autumn rain almost 50% higher than long-term average. In Ireland, twice the average amount of rainfall was recorded in many parts of the country during the three summer months of 2012. People across the UK and Ireland will readily tell you that “We haven’t had a summer in four or five years”, and unusually, for them, complain of “bitter” and “terrible” winters, with temperatures dropping as low as –18C in Northern Ireland.

COLD WINTER AND SPRING: “It’s been the longest winter on record in this country. Not since the records began 70 years ago has there been a March as cold as this year’s. It’s been followed by the coldest April in 25 years in some areas of the country,” reported the Irish Examiner on 9 May 2013. The Irish spring in 2103 was coldest in 62 years across most of country, and dull and windy. Spring in the UK this year was the coldest in 50 years.

BAD COMBINATION: This combination of events has wrecked farmer’s schedules. Less growth in a dull 2012 summer – combined with water-logged crops and pastures in autumn – reduced yields, and some crops had to be left in the ground. The spring 2013 growing season, including for apples and pears as well as pasture, started up to six weeks late due to the cold, dull conditions. And waterlogged fields meant that across Ireland cattle were still being kept in their winter sheds in the first week of June, ostensibly a summer month. The consequences – whilst mild compared to climate-change impacts on vulnerable communities in the developing world from the African Sahel to Asia’s changing monsoons – show how easily the security of food production can be disrupted:

WHEAT: In the UK, a wet autumn, hard winter and cold spring has resulted in one of the smallest wheat harvests in a generation, 30% below normal. Britain, generality the third biggest wheat grower in the EU, will be a net importer for the first time in 11 years. Charlotte Garbutt, a senior analyst at the industry-financed Agriculture and Horticulture Development Board says: “Normally we export around 2.5m tonnes of wheat but this year we expect to have to import 2.5m tonnes.” The latest analysis from the UK Department for the Environment, Food and Rural Affairs says total farming income decreased by £737million in 2012 to £4.7bn, as farmers faced both crop losses and higher feed costs.

STOCK LOSSES: Late snowstorms across England, Sotland, Wales and Ireland March 2013, with drifts of up to 5 metres, killed an estimated 40,000 newborn lambs. In ireland’s west, one-quarter more animals died in the first three months of 2013 compared to 2012, with some vets trained to look for suicidal behaviour in farmers.

POTATO SHORTAGE: A wet autumn and poor season in 2012 prevented many crops being harvested in Ireland. Supermarket price-squeezing has also driven some farmers out of the industry, together resulting in reduced yields of at least 30 per cent in 2012. By spring 2013, potato prices had almost tripled in many parts of Ireland, with supplies exhausted and a reliance on imports from central Europe.

Limavady farmer, James Wray, told UTV News that said the changing weather in recent weeks had forced the price up: “This year has been a terrible growing season with loads of crops lost and loads of crops not harvested and any crops that have been harvested have produced low yields. There just isn’t any potatoes left in the country, there are no farmers with potatoes left, so whatever potatoes are about, are very, very expensive. If you go to any of the major supermarkets most of their potatoes are coming in from Europe just to bridge the gap.”

Potato shortages have a particular cultural resonance in Ireland as a consequence of the Irish potato famine of the mid-nineteenth century, which killed a million people and forced another million to emigrate.

FEED SHORTAGE: In the last week of May (the final week of spring), farmers in Ireland’s west were queuing for hay and silage imports from England, France and Netherland as their winter feed became exhausted and a lack of pasture growth in spring due to cold and overcast conditions, and wet fields, prevented cattle from being moved from their winter sheds. More than 13000 tonnes of feed was imported, but even so farmer Enda Stenson said local farmers “have neither money nor fodder”. Many had sold down their herds to be able to buy feed for the remainder.

BEES IN TROUBLE: Bad weather and disease is also threatening honey production, with some beekeepers expecting to produce no honey as bees have been unable to mate and hives are decimated. And bees play a crucial role in pollinating many crops.

Jim Donohoe, of the Federation of Irish Beekeepers’ Associations, told the Irish Independent that the problem was weather related: “We’ve had bad summers before, but because of the wind, rain and lack of sunshine, we’ve had serious problems with colonies wanting to swarm, but the queens being unable to mate with drones which refused to fly because there wasn’t calm conditions. This year, we had a delayed winter where bees couldn’t fly. The flowers were delayed coming out, and that crucial period meant bees died from old age. All of this combines to about 50pc of colonies being lost. If we don’t get milder weather, the losses will be closer to 75pc.

These stories may seem trivial compared to the devastating impact of climate change on global food security and prices, and their political consequences. Writing on Egypt’s new political turmoil, Nafeez Ahmed notes that:

“Food price hikes have coincided with devastating climate change impacts in the form of extreme weather in key food-basket regions. Since 2010, we have seen droughts and heat-waves in the US, Russia, and China, leading to a dramatic fall in wheat yields, on which Egypt is heavily dependent. The subsequent doubling of global wheat prices – from $157/metric tonne in June 2010 to $326/metric tonne in February 2011 – directly affected millions of Egyptians, who already spend about 40% of their income on food. That helped trigger the events that led to the fall of Hosni Mubarak in 2011, but the same configuration of factors is worsening.”

And Lester Brown, head of the Earth Policy Institute in Washington, has warned that grain harvests are already shrinking as US, India and China come close to ‘peak water’. He says that 18 countries, together containing half the world’s people, are now over-pumping their underground water tables to the point – known as “peak water” – where they are not replenishing and where harvests are getting smaller each year.

Together these stories paint a compelling picture of the threat to food security from climate change, not just in the Middle East, Asia and Africa, but in the heart of the developed world too.


David Spratt studied at Australian National University.
David co-authored the book Climate Code Red (2008).  

David frequently posts at the Climate Code Red website.
Above article was first posted at Reneweconomy.com.au


Related

- Polar jet stream appears hugely deformed - by Sam Carana, December 20, 2012
http://arctic-news.blogspot.com/2012/12/polar-jet-stream-appears-hugely-deformed.html

- The Threat of Wildfires in the North - by Sam Carana, June 27, 2013

Monday, April 8, 2013

Earth is on the edge of runaway warming


The old picture, with Earth well within
our solar system's habitable zone
How well is Earth's orbit around the sun positioned within the boundaries of the habitable zone? The illustration by the Wikipedia image on the right would give that impression that Earth was comfortably positioned in the middle of this zone.

What is the habitable zone? To be habitable, a planet the size of Earth should be within certain distances from its Sun, in order for liquid water to exist on its surface, for which temperatures must be between freezing point (0° C) and boiling point (100° C) of water.

In the Wikipedia image, the dark green zone indicates that a planet the size of Earth could possess liquid water, which is essential since carbon compounds dissolved in water form the basis of all earthly life, so watery planets are good candidates to support similar carbon-based biochemistries.

If a planet is too far away from the star that heats it, water will freeze. The habitable zone can be extended (light green color) for larger terrestrial planets that could hold on to thicker atmospheres which could theoretically provide sufficient warming and pressure to maintain water at a greater distance from the parent star.

A planet closer to its star than the inner edge of the habitable zone will be too hot. Any water present will boil away or be lost into space entirely. Rising temperatures caused by greenhouse gases could lead to a moist greenhouse with similar results.

The distance between Earth and the Sun is one astronomical unit (1 AU). Mars is often said to have an average distance from the Sun of 1.52 AU. A recent study led by Ravi Kopparapu at Penn State mentions that early Mars was warm enough for liquid water to flow on its surface. However, the present-day solar flux at Mars distance is 0.43 times that of Earth. Therefore, the solar flux received by Mars at 3.8 Gyr was 0.75 × 0.43 = 0.32 times that of Earth. The corresponding outer habitable zone limit today, then, would be about 1.77 AU, i.e. just a bit too far away from the Sun to sustain water in liquid form. Venus, on the other hand, is too close to the Sun (see box below).

Kopparapu calculates that the Solar System’s habitable zone lies between 0.99 AU (92 million mi, 148 million km) and 1.70 AU (158 million mi, 254 million km) from the Sun. In other words, Earth is on the edge of runaway warming.

Image by Kopparapu et al. New calculations show that Earth is positioned on the edge of the habitable zone
(
green-shaded region), boundaries of which are determined by the moist-greenhouse
(inner edge, higher flux values) and maximum greenhouse (outer edge, lower flux values)

Kopparapu says that if current IPCC temperature projections of a 4 degrees K (or Celsius) increase by the end of this century are correct, our descendants could start seeing the signatures of a moist greenhouse by 2100.

Kopparapu argues that once the atmosphere makes the transition to a moist greenhouse, the only option would be global geoengineering to reverse the process. In such a moist-greenhouse scenario, not only are the ozone layer and ice caps destroyed, but the oceans would begin evaporating into the atmosphere's upper stratosphere.


Venus' runaway greenhouse effect a warning for Earth
by Sam Carana - first posted November 28, 2007, at:
http://global-warming.gather.com/viewArticle.action?articleId=281474977189423

Venus was transformed from a haven for water to a fiery hell by an runaway greenhouse effect, concludes the European Space Agency (ESA), after studying data from the Venus Express, which has been orbiting Venus since April 2006.

Venus today is a hellish place with surface temperatures of over 400°C (752°Fahrenheit), winds blowing at speeds of over 100 m/s (224 mph) and pressure a hundred times that on Earth, a pressure equivalent, on Earth, to being one km (0.62 miles) under the sea.

Hakan Svedhem, ESA scientist and lead author of one of eight studies published on Wednesday in the British journal Nature, says that Earth and Venus have nearly the same mass, size and density, and have about the same amount of carbon dioxide. In the past, Venus was much more Earth-like and was partially covered with water, like oceans, the ESA scientists believe.

How could a world so similar to Earth have turned into such a noxious and inhospitable place? The answer is planetary warming. At some point, atmospheric carbon triggered a runaway warming on Venus that boiled away the oceans. As water vapour is a greenhouse gas, this further trapped solar heat, causing the planet to heat up even more. So, more surface water evaporated, and eventually dissipated into space. It was a “positive feedback” -- a vicious circle of self-reinforcing warming which slowly dessicated the planet.

“Eventually the oceans began to boil”, said David Grinspoon, a Venus Express interdisciplinary scientist from the Denver Museum of Nature and Science, Colorado, USA. “You wound up with what we call a runaway greenhouse effect”, Hakan Svedhem says. Venus Express found hydrogen and oxygen ions escaping in a two to one ratio, meaning that water vapor in the atmosphere the little that is left of what they believe were once oceans is still disappearing.

While most of Earth's carbon store remained locked up in the soil, rocks and oceans, on Venus it went into the atmosphere, resulting in Venus' atmosphere now consisting of about 95% carbon dioxide.

“Earth is moving along the curve that connects it to Venus”, warns Dmitry Titov, science coordinator of the Venus Express mission.

References

- Venus Express - European Space Agency (ESA)

- Venus inferno due to 'runaway greenhouse effect', say scientists

- Probe likens young Venus to Earth

- European mission reports from Venus


References

- Habitable zones around main-sequence stars: new estimates
Ravi Kumar Kopparapu et al. 2013

- Habitable Zone - Wikipedia

- Earth is closer to the edge of Sun's habitable zone

- Updated model for identifying habitable zones around stars puts Earth on the edge


Friday, October 26, 2012

Open Letter to Canadian MPs

Paul Beckwith
Food is the new oil. Land is the new gold.

The world food situation is deteriorating. Grain stocks have dropped to a dangerously low level. The World Food Price Index has doubled in a decade. The ranks of the hungry are expanding. Political unrest is spreading.

On the demand side of the food equation, there will be 219,000 people at the dinner table tonight who were not there last night. And some 3 billion increasingly affluent people are moving up the food chain, consuming grain-intensive livestock and poultry products.

At the same time, water shortages and heat waves are making it more difficult for farmers to keep pace with demand. As grain-exporting countries ban exports to keep their food prices down, importing countries are panicking. In response, they are buying large tracts of land in other countries to grow food for themselves. The land rush is on.

Could food become the weak link for us as it was for so many earlier civilizations? This slideshow presentation, based on Lester Brown's latest book, Full Planet, Empty Plates: The New Geopolitics of Food Scarcity, explains why world food supplies are tightening and tells what we need to do about it.
http://www.earth-policy.org/books/fpep/fpep_presentation

My video clip filmed about 3 weeks ago on Parliament Hill explains the clear connections between crop failures/droughts/floods/extreme weather/sea ice/greenhouse gases/climate change...
http://www.youtube.com/watch?feature=player_embedded&v=zw1GEp8UBj4

This is my presentation on Parliament Hill (Center blog) a few months ago at the All-Party Climate Change Caucus meeting.
https://docs.google.com/file/d/0ByLujhsHsxP7NG42RjVQLXBrV1k/edit

This is a longer version of the linkages between food shortages and declining sea ice.
https://docs.google.com/file/d/0ByLujhsHsxP7NThkM05iN1BXZ2s/edit


Please let me know what your plan is to deal with this coming turmoil.
I look forward to your response.


Sincerely,

Paul Beckwith (B.Eng. Engineering Physics, M.Sc. Physics, presently working on Ph.D. in climatology)

Sunday, March 18, 2012

Warming in the Arctic

Note: this is a 3.4 MB animation that may take some time to fully load. 

Loss of snow and ice can change local temperatures significantly, especially in April/May.

The changes contribute to accelerated warming in the Arctic, which - as the image left shows - is projected to reach 10 degrees Celsius in the 2040s.

Temperatures could rise even faster in the Arctic as methane gets released from hydrates. 

Methane's global warming potential is 105 times as much as carbon dioxide over a 20-year period, and even higher over a shorter period. 

How much methane is there?


Of all the methane located in the Arctic, 50 Gt is ready for abrupt release at any time in the ESAS alone (squared area, image left). 

Such a release would dwarf warming by carbon dioxide from fossil fuels (~ 33 Gt/y), given methane's high immediate global warming potential. 

When released from a hydrate, much of the methane will remain concentrated locally, amplifying local warming.  

For this reason, even a much smaller release could already cause dramatic local warming. There are further reasons why this is the case.  

Such a release will extend methane's lifetime, while lack of hydroxyl in the Arctic (image left) could further make the methane stay there for decades, at a high global warming potential, while triggering further releases.

Meanwhile, rising temperatures will cause firestorms to rage over the tundras of Canada and Siberia, releasing huge amounts of greenhouse gases and soot from peatlands and soil carbon. 

The recent firestorms in Russia provide a gloomy preview of what could happen as temperatures keep rising in the Arctic.  

The image below illustrates how much organic carbon is present in the melting permafrost.  

Much of the soot from firestorms in Siberia could settle on the ice in the Himalaya Tibetan plateau, melting the glaciers there and causing short-term flooding followed by rapid decrease of the flow of ten of Asia’s largest river systems that originate there, with more than a billion people’s livelihoods depending on the continued flow of this water.