Showing posts with label volume. Show all posts

Tuesday, April 30, 2024

Arctic sea ice under threat

The image below indicates that Arctic sea ice volume has meanwhile passed its annual maximum. Over the coming months, volume can be expected to decrease rapidly. The image also highlights that, over the past few months, Arctic sea ice volume has been the lowest on record for the time of year.


The image below illustrates the decline of Arctic sea ice volume over the years. The image also confirms that the annual maximum volume was recently reached and that it was the lowest maximum for the 24 years on record. 

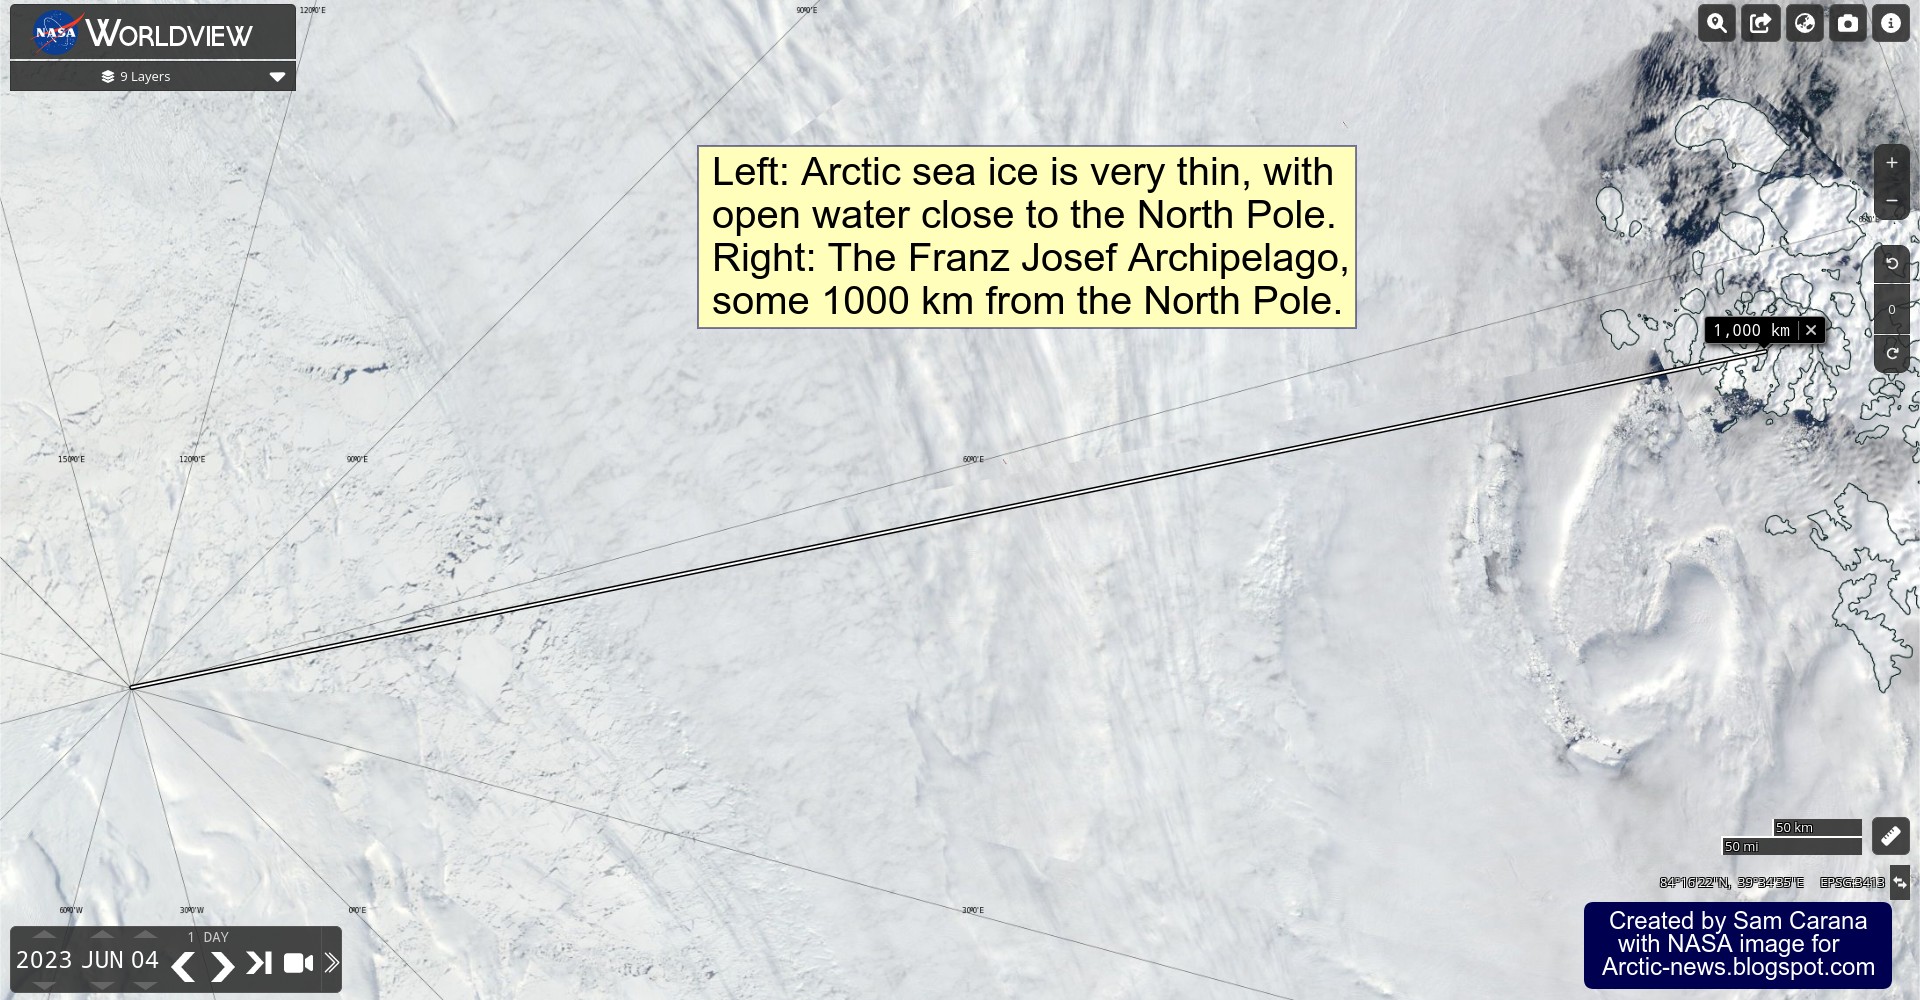
Given that Arctic sea ice currently is still relatively extensive, this record low volume indicates that sea ice is indeed very thin, which must be caused by ocean heat melting sea ice from below, since little or no sunshine is yet reaching the Arctic at the moment and air temperatures are still far below freezing point, so where ocean heat may be melting sea ice away from below, a thin layer of ice will quickly be reestablished at the surface, keeping sea ice extent relatively large for now.

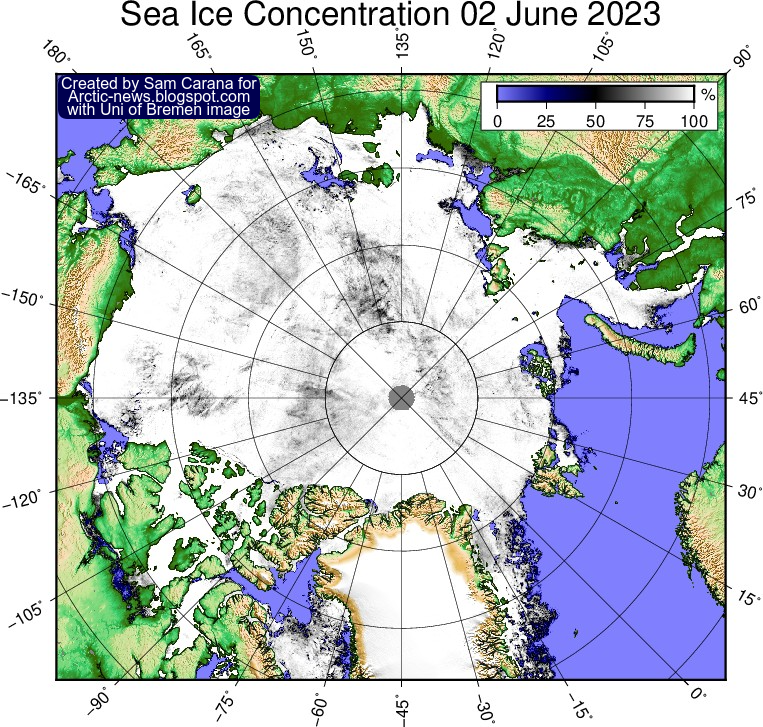
This situation looks set to dramatically change over the next few months, as air temperatures will rise and as more ocean heat will reach the Arctic Ocean. Moreover, as illustrated by the map below, much of the thicker sea ice is located off the east coast of Greenland. This sea ice and the purple-colored sea ice can be expected to melt away quickly with the upcoming rise in temperatures over the next few months.

Sea surface temperatures at record high

The image below, created with Climate Reanalyzer screenshots, shows that the sea surface temperature (SST 60°S - 60°N mean) was 21.2°C on April 24, 2024, reaching yet another record high.

[ image from earlier post ]

These record high sea surface temperatures are reached as long-term sea surface temperatures are falling and as El Niño is predicted to weaken, which is fueling fears that feedbacks are kicking in with accelerating ferocity.

The image below, adapted from NOAA, shows global ocean temperature anomalies from 1901-2000, with the green line (LOcally Estimated Scatterplot Smoothing) giving a warning that higher temperature anomalies could be coming up.

[ image from earlier post ]

The image below shows that the monthly Atlantic surface temperature anomaly in March 2024 was 1.422°C when compared to a 1901-2000 base.


The high anomalies over the past two months indicate how much heat has accumulated in the Atlantic, and these anomalies are even higher when using a pre-industrial base, as discussed earlier.

The images also highlight the potential for the slowing down of the Atlantic meridional overturning circulation (AMOC) to contribute to more heat accumulating at the surface of the Atlantic Ocean.

Arctic sea ice under threat

As temperatures rise, many feedbacks are kicking in with greater ferocity, including increased stratification of oceans, loss of sea ice, loss of reflectivity of clouds and increased freshwater due to stronger melting of sea ice and glacial ice, due to heavier runoff from land and rivers and due to changes in ocean circulation.

While this may look to cause less ocean heat to reach the Arctic Ocean for now, the result is that a huge amount of ocean heat is accumulating in the North Atlantic that threatens to abruptly move into the Arctic Ocean. The danger is that an influx of ocean heat can cause large amounts of methane to erupt from the seafloor of the Arctic Ocean.

An enormous amount of ocean heat has accumulated and is still further accumulating in the North Atlantic and much of this heat threatens to abruptly move into the Arctic Ocean. The danger is that, due to strong wind along the path of the Gulf Stream and extensions of this current into the Arctic Ocean, huge amounts of ocean heat will abruptly get pushed into the Arctic Ocean, with the influx of ocean heat causing destabilization of hydrates contained in sediments at the seafloor of the Arctic Ocean, resulting in eruptions of huge amounts of methane.

The danger is growing, due to a number of factors. Firstly, the amount of ocean heat in the North Atlantic is increasing. Secondly, Arctic sea ice volume is at record low, implying that there is little or no buffer left to consume ocean heat flowing from the Atlantic Ocean into the Arctic Ocean.

Latent heat is energy associated with a phase change, such as the energy consumed when solid ice turns into water (i.e. melts). During a phase change, the temperature remains constant. Sea ice acts as a buffer that absorbs heat, while keeping the temperature at zero degrees Celsius. As long as there is sea ice in the water, this sea ice will keep absorbing heat, so the temperature doesn't rise at the sea surface.


The amount of energy absorbed by melting ice is as much as it takes to heat an equivalent mass of water from zero to 80°C. 

The danger is that, as the buffer disappears that until now has consumed huge amounts of ocean heat, further heat will reach methane hydrates at the seafloor of the Arctic Ocean, causing them to get destabilized resulting in release of methane from these hydrates and from free gas underneath that was previously sealed by the hydrates.

[ The Buffer has gone, feedback #14 on the Feedbacks page ]

Strong hurricanes can significantly add to the danger. More hurricanes are forecast for the 2024 Atlantic hurricane season than during 1950-2020, as illustrated by the image below, from an earlier post.


Many of the dangers have been discussed in earlier posts, e.g. the danger that sea currents in the Arctic Ocean will change direction was discussed in this 2017 post.

Climate Emergency Declaration

The situation is dire and the precautionary principle calls for rapid, comprehensive and effective action to reduce the damage and to improve the situation, as described in this 2022 post, where needed in combination with a Climate Emergency Declaration, as discussed at this group.


Links

• Climate Reanalyzer
https://climatereanalyzer.org

• NOAA - Ocean temperature anomalies
https://www.ncei.noaa.gov/access/monitoring/climate-at-a-glance/global/time-series/globe/ocean/1/0/2015-2024?filter=true&filterType=loess

• Atlantic ocean heat threatens to unleash methane eruptions
https://arctic-news.blogspot.com/2024/03/atlantic-ocean-heat-threatens-to-unleash-methane-eruptions.html

• Feedbacks in the Arctic
https://arctic-news.blogspot.com/p/feedbacks.html

• North Atlantic heating up
https://arctic-news.blogspot.com/2024/04/north-atlantic-heating-up.html

• Danish Meteorological Institute - Arctic sea ice thickness and volume
https://ocean.dmi.dk/arctic/icethickness/thk.uk.php

• Transforming Society
https://arctic-news.blogspot.com/2022/10/transforming-society.html

• Climate Plan
https://arctic-news.blogspot.com/p/climateplan.html

• Climate Emergency Declaration
https://arctic-news.blogspot.com/p/climate-emergency-declaration.html


Friday, June 30, 2023

Arctic sea ice under threat - update 5

The NASA Worldview satellite image below shows Arctic sea ice on June 29, 2023, with the North Pole on the left. 


The animation below shows that, while clouds can obscure a closer look, sea ice is clearly very thin with the thickest ice breaking up near the top of Greenland, some 750 km from the North Pole. 


The Uni of Bremen image below shows Arctic sea ice thickness on June 28, 2023.


The danger is that, as El Niño strengthens, there will be massive loss of Arctic sea ice over the coming months, with water in the Arctic Ocean heating up strongly due to loss of the latent heat buffer and loss of albedo, while huge amounts of ocean heat keep entering the Arctic Ocean from the Atlantic Ocean and the Pacific Ocean.

The image below shows that the North Atlantic sea surface temperature was 23.5°C on June 28, 2023 (on the black line), 0.9°C higher than the 22.6°C on June 28, 2022 (on the orange line). A record high of 24.9°C was reached on Sept. 4, 2022, even while La Niña was suppressing the temperature. This time, there's an El Niño. 


The image below, adapted from NOAA, shows ocean heat moving toward the Arctic along the path of the Gulf Stream on June 25, 2023, while sea surface temperatures on the map are as high as 32.6°C.


In addition, the Jet Stream is strongly deformed, and this threatens to strengthen heatwaves extending over the Arctic Ocean and causing hot water from rivers to enter the Arctic Ocean, and to strengthen storms accelerating the flow of ocean heat into the Arctic Ocean, while fires and storms contribute to darkening of the sea ice, further speeding up its demise.

The danger is that, as El Niño strengthens and as ocean heat keeps entering the Arctic Ocean from the Atlantic Ocean and the Pacific Ocean, a huge amount of heat will abruptly be pushed into the Arctic Ocean.

This danger is illustrated by the image on the right, from an earlier post, showing the Jet Stream pushing wind at a speed of 126 km/h (78 mph) up through Fram Strait (at the green circle) into the Arctic Ocean on June 21, 2023.

This situation threatens to cause massive loss of Arctic sea ice over the coming months, with water in the Arctic Ocean heating up strongly due to loss of the latent heat buffer and loss of albedo.

This in turn threatens to trigger methane eruptions from the seafloor of the Arctic Ocean, a threat that has been described many times before, such as here, here and here.

[ Latent heat loss, feedback #14 on the Feedbacks page ]
[ see the Extinction page ]
Loss of Arctic sea ice albedo, loss of the latent heat buffer and eruption of seafloor methane all constitute tipping points that threaten to abruptly accelerate the temperature rise in the Arctic, further speeding up loss of permafrost in Siberia and North America and thus threatening to trigger further releases of greenhouse gases.

In addition, there are further events and developments that could unfold and make things even worse.

The upcoming temperature rise on land on the Northern Hemisphere could be of such a severity that much traffic, transport and industrial activity will grind to a halt, resulting in a reduction in cooling aerosols that are now masking the full wrath of global heating. Without these cooling aerosols, the temperature is projected to rise strongly, while there could be an additional temperature rise due to an increase in warming aerosols and gases as a result of more biomass and waste burning and forest fires. Furthermore, as traffic slows down, there will be less nitrogen oxide emissions, which could result in less hydroxyl to curtail methane.

The bar on the right depicts the threat, as discussed at the Extinction page.

In conclusion, the situation is dire and calls for support for a Climate Emergency Declaration.


Links

• Arctic sea ice under threat

• Arctic sea ice under threat - update 1

• Arctic sea ice under threat - update 2

• Arctic sea ice under threat - update 3
https://arctic-news.blogspot.com/2023/06/arctic-sea-ice-under-threat-update-3.html

• Arctic sea ice under threat - update 4
https://arctic-news.blogspot.com/2023/06/arctic-sea-ice-under-threat-update-4.html

• Climate Reanalyzer - Daily sea surface temperatures
https://climatereanalyzer.org/clim/sst_daily

• NOAA - The National Centers for Environment Prediction Climate Forecast System Version 2  

• NOAA - Climate Prediction Center - ENSO Diagnostic Discussions
https://www.cpc.ncep.noaa.gov/products/analysis_monitoring/enso_advisory/ensodisc.shtml

• NOAA - sea surface temperature
https://www.ospo.noaa.gov/Products/ocean/sst/contour/index.html

• University of Bremen - sea ice concentration and thickness
https://seaice.uni-bremen.de/start

• NASA Worldview
https://worldview.earthdata.nasa.gov


Friday, June 23, 2023

Arctic sea ice under threat - update 4

The image below, created by Eliot Jacobson, shows the North Atlantic sea surface temperature anomaly through June 20, 2023 (versus 1982-2023 mean).

The image below, created by Eliot Jacobson, shows the North Atlantic sea surface temperature on June 21, for the years 1982-2023.

The image below shows that the North Atlantic sea surface temperature was 23.3°C on June 21, 2023 (on the black line), 0.9°C higher than the 22.4°C on June 21, 2022 (on the orange line). A record high of 24.9°C was reached on September 4, 2022, even while La Niña then was suppressing the temperature, whereas now there's an El Niño.

[ click on images to enlarge ]

Global sea ice extent was at a record low for the time of year on June 23, 2023, i.e. only 21.57 million km², as illustrated by the image below.

[ click on images to enlarge ]

Contributing to this is very low Antarctic sea ice extent. The image below shows Antarctic sea ice extent up to June 23, 2023. Values in the column on the left are for February 16; Antarctic sea ice extent reached a record minimum on February 16, 2023. Values in the column on the right are for June 23. Highlighted are three years: 2023 (red), 2022 (blue) and 2016 (black). Antarctic sea ice extent was also very low at the end of the year 2016, which was a strong El Niño year, yet extent was even lower at the very end of the year in 2022, even though that was during a La Niña.


The image on the right, adapted from NOAA, shows ocean heat moving toward the Arctic along the path of the Gulf Stream on June 21, 2023, while sea surface temperatures on the map are as high as 32.5°C.

In addition, the Jet Stream is strongly deformed, and this threatens to strengthen heatwaves extending over the Arctic Ocean and causing hot water from rivers to enter the Arctic Ocean, and to strengthen storms accelerating the flow of ocean heat into the Arctic Ocean, while fires and storms contribute to darkening of the sea ice, further speeding up its demise.

The danger is that, as El Niño strengthens and as ocean heat keeps entering the Arctic Ocean from the Atlantic Ocean and the Pacific Ocean, a huge amount of heat will abruptly be pushed into the Arctic Ocean. 

This danger is illustrated by the image on the right, showing the Jet Stream pushing wind at a speed of 126 km/h (78 mph) up through Fram Strait (at the green circle) into the Arctic Ocean on June 21, 2023.

This situation threatens to cause massive loss of Arctic sea ice over the coming months, with water in the Arctic Ocean heating up strongly due to loss of the latent heat buffer and loss of albedo.

This in turn threatens to trigger methane eruptions from the seafloor of the Arctic Ocean, a threat that has been described many times before, such as here, here and here.

[ Latent heat loss, feedback #14 on the Feedbacks page ]
[ see the Extinction page ]
Loss of Arctic sea ice albedo, loss of the latent heat buffer and eruption of seafloor methane all constitute tipping points that threaten to abruptly accelerate the temperature rise in the Arctic, thus also further speeding up loss of permafrost in Siberia and North America and thus threatening to trigger further releases of greenhouse gases.

In addition, there are further events and developments that could unfold and make things even worse.

The upcoming temperature rise on land on the Northern Hemisphere could be of such a severity that much traffic, transport and industrial activity will grind to a halt, resulting in a reduction in cooling aerosols that are now masking the full wrath of global heating. Without these cooling aerosols, the temperature is projected to rise strongly, while there could be an additional temperature rise due to an increase in warming aerosols and gases as a result of more biomass and waste burning and forest fires. Furthermore, as traffic slows down, there will be less nitrogen oxide emissions, which could result in less hydroxyl to curtail methane.

The bar on the right depicts the threat, as discussed at the Extinction page.

In conclusion, the situation is dire and calls for support for a Climate Emergency Declaration.


Links

• Arctic sea ice under threat

• Arctic sea ice under threat - update 1

• Arctic sea ice under threat - update 2

• Arctic sea ice under threat - update 3

• Eliot Jacobson - North Atlantic sea surface temperature anomaly through June 20, 2023

• Eliot Jacobson - North Atlantic sea surface temperature on June 21, for the years 1982-2023
https://twitter.com/EliotJacobson/status/1672232859409723392/photo/1

• Climate Reanalyzer - Daily sea surface temperatures
https://climatereanalyzer.org/clim/sst_daily

• NOAA - The National Centers for Environment Prediction Climate Forecast System Version 2  

• NOAA - Climate Prediction Center - ENSO Diagnostic Discussions
https://www.cpc.ncep.noaa.gov/products/analysis_monitoring/enso_advisory/ensodisc.shtml

• University of Bremen - sea ice concentration and thickness
https://seaice.uni-bremen.de/start

• NASA Worldview
https://worldview.earthdata.nasa.gov

• Wetland emission and atmospheric sink changes explain methane growth in 2020 - by Sushi Peng et al. 

• NOAA - sea surface temperature

• Nullschool.net

• Latent Heat

• Albedo

• Extinction

• Climate Plan
https://arctic-news.blogspot.com/p/climateplan.html

• Climate Emergency Declaration
https://arctic-news.blogspot.com/p/climate-emergency-declaration.html


Monday, June 12, 2023

Arctic sea ice under threat - update 1


The World daily 2-meter Air Temperature (90-90°N, 0-360°E) was 16.77°C on June 9, 2023, an anomaly of 0.9°C for that day. The highest temperature on record is 16.92°C, and it was reached on August 14, 2016, and the anomaly for that day was only 0.75°C. 

The record high of 16.92° actually was a tie between August 13, 2016, August 14, 2016, and July 24, 2022. That latter date is important, since the record high temperature was reached even while there was a strong La Niña, suppressing the temperature. This time, we're in an El Niño, so we can expect even higher temperatures over the next few weeks.

The highest anomaly on record was reached on February 28, 2016, when there was a strong El Niño and the anomaly was 1.15°C. Note that these anomalies are compared to the mean temperature for that day in NOAA's NCEP CFSv2


The above image, from an earlier post, uses monthly NASA Land+Ocean temperature anomalies versus 1886-1915 that are further adjusted by 0.99°C to reflect ocean air temperatures, higher polar anomalies and a pre-industral base.

[ image credit: WTF is Happening? An Overview - by Eliot Jacobson ]

The above image shows sea surface temperature on the North Atlantic (0-60°N, 0-80°W) depicted as anomalies, reaching about 1.1°C above the 1982-2023 mean on June 10, 2023.

The situation is especially critical in the North Atlantic, as vast amounts of ocean heat in the North Atlantic are moving toward the Arctic, threatening to cause rapid melting of Arctic sea ice and thawing of permafrost.

The above image shows the same data for sea surface temperature on the North Atlantic (0-60°N, 0-80°W) reaching 22.7°C on June 10, 2023 (on the black line), 0.7°C higher than the 22.0°C on June 10, 2022 (on the orange line). 

The comparison with 2022 is important, as the North Atlantic sea surface temperature reached a record 24.9°C on Sept. 4, 2022, even while there was a strong La Niña, suppressing the temperature. This time, we have an El Niño, as illustrated by the NOAA image on the right. 

Global sea ice extent was at a record low for the time of year on June 14, 2023, i.e. only 21.42 million km², as illustrated by the image below.  


Contributing to this is very low Antarctic sea ice extent. The image below shows Antarctic sea ice extent up to June 14, 2023. Values in the column on the left are for February 16; Antarctic sea ice extent reached a record minimum on February 16, 2023. Values in the column on  the right are for June 14.  Highlighted are three years: 2023 (red), 2022 (blue) and 2016 (black). Antarctic sea ice extent was also very low at the end of the year 2016, which was a strong El Niño year, yet extent was even lower at the very end of the year in 2022, even though that was during a La Niña.  


The annual Arctic sea ice extent minimum is typically reached in September and the North Atlantic sea surface temperature is critical in regard to melting of the Arctic sea ice. The already high sea surface temperature together with the impact of the El Niño make the outlook for Arctic sea ice for September 2023 look grim.

Sea ice concentration is getting lower in many places and there is open water off the Siberian coast and in parts of the Beaufort Sea and Baffin Bay, as illustrated by the Uni of Bremen image on the right. Rising temperatures in the Arctic threaten to trigger massive loss of Arctic sea ice over the coming months.

The image on the right, from polarportal.dk, shows very low Arctic sea ice volume for the time of year on June 13, 2023, already much lower than the volume on the same date for any of the four previous years.

The NASA Worldview satellite image below shows Arctic sea ice in a very vulnerable state on June 11, 2023, even very close to the North Pole (on the left of the image below). Open water is also visible near the Franz Jozef Archipelago, some 1000 km from the North Pole (on the right of the image below).


The NASA satellite image on the right provides a closer look at the sea ice near the North Pole on June 14, 2023 (click on images to enlarge). 

On the one hand, it's terrible to see open water close to the North Pole so early in the year, yet on the other hand, this may enable ocean heat to escape to the atmosphere and thus delay eruption of seafloor methane (image further below). 

The Uni of Bremen image on the right underneath shows Arctic sea ice thickness on June 13, 2023.

As discussed in earlier posts such as this one, conditions are dire:
• Earth's energy imbalance is at record high
• emissions are at record high
• greenhouse gas concentrations are at record high
• temperatures are very high, especially in the Arctic
• North Atlantic sea surface temperature is at record high
• sea ice is very vulnerable
• the Jet Stream is strongly deformed, threatening to cause:
• heatwaves extending over the Arctic Ocean with
• hot water from rivers entering the Arctic Ocean, with
• storms pushing hot water into the Arctic Ocean, and with
• fires and storms darkening the sea ice

The image on the right shows that carbon dioxide was as high as 427 ppm recently at Mauna Loa, Hawaii. 

The image below shows the extent of the deformation of the Jet Stream on June 6, 2023. No less than 26 circular wind patterns (at 250 hPa) are marked on the image, which also shows sea surface temperature anomalies. The Jet Stream is can also be seen crossing the Equator at the bottom of the image.


Furthermore, there are circumstances that could coincide in a cataclysmic alignment: El Niño is on the way, sunspots are higher than predicted and the Tonga submarine volcano did add large amounts of water vapor high into the atmosphere.

All this looks set to jointly result in massive loss of Arctic sea ice over the coming months, with loss of the latent heat buffer and loss of albedo threatening to trigger eruption of methane from the seafloor of the Arctic Ocean, as has been described many times before, such as in this post, in this post and in this post.

[ Latent heat loss, feedback #14 on the Feedbacks page ]
[ see the Extinction page ]
Both loss of Arctic sea ice and eruption of seafloor methane constitute tipping points that threaten to abruptly accelerate the temperature rise in the Arctic, thus also accelerating loss of permafrost in Siberia and North America that threatens to trigger further releases of greenhouse gases.

In addition, there are further events and developments that could unfold and make things even worse.

The upcoming temperature rise on land on the Northern Hemisphere could be of such a severity that much traffic, transport and industrial activity will grind to a halt, resulting in a reduction in cooling aerosols that are now masking the full wrath of global heating. Without these cooling aerosols, the temperature is projected to rise strongly, while there could be an additional temperature rise due to an increase in warming aerosols and gases as a result of more biomass and waste burning and forest fires. Furthermore, as traffic slows down, there will be less nitrogen oxide emissions, which could result in less hydroxyl to curtail methane.

The bar on the right depicts the threat, as discussed at the Extinction page.

In conclusion, the situation is dire and calls for support for a Climate Emergency Declaration.

In the video below, Jim Massa is interviewed by Sandy Schoelles about the changes taking place in the oceans. 


Links

• Climate Reanalyzer - World Daily 2-meter Air Temperature (90-90°N, 0-360°E)

• NOAA - The National Centers for Environment Prediction Climate Forecast System Version 2  

• Humans may be extinct in 2026

• NASA - GISS Surface Temperature Analysis

• Pre-industrial

• WTF is Happening? An Overview - by Eliot Jacobson
https://climatecasino.net/2023/06/wtf-is-happening-an-overview

• Climate Reanalyzer - Daily sea surface temperatures 
https://climatereanalyzer.org/clim/sst_daily

• NOAA - Climate Prediction Center - ENSO Diagnostic Discussions
https://www.cpc.ncep.noaa.gov/products/analysis_monitoring/enso_advisory/ensodisc.shtml

• University of Bremen - sea ice concentration and thickness
https://seaice.uni-bremen.de/start

• Polar Portal - Arctic sea ice thickness and volume
http://polarportal.dk/en/sea-ice-and-icebergs/sea-ice-thickness-and-volume

• NASA Worldview
https://worldview.earthdata.nasa.gov

• Wetland emission and atmospheric sink changes explain methane growth in 2020 - by Sushi Peng et al. 

• Climate Plan
https://arctic-news.blogspot.com/p/climateplan.html

• Climate Emergency Declaration
https://arctic-news.blogspot.com/p/climate-emergency-declaration.html


Saturday, June 3, 2023

Arctic sea ice under threat

The above image shows high temperature anomalies over the Arctic on June 3, 2023. 

The above image shows sea surface temperature on the North Atlantic (0-60N, 0-80W) depicted as anomalies, reaching 1.04°C above 1982-2023 on June 8, 2023. The situation is especially critical in the North Atlantic, as vast amounts of ocean heat in the North Atlantic are moving toward the Arctic, threatening to cause rapid melting of Arctic sea ice and thawing of permafrost.


The above image shows the same data for sea surface temperature on the North Atlantic (0-60N, 0-80W) reaching 22.5°C on June 7, 2023 (on the black line), 0.6°C higher than the 21.9°C on June 7, 2022 (on the orange line). 

The comparison with 2022 is important, as the North Atlantic sea surface temperature reached a record 24.9°C on Sept. 4, 2022, even while there was a strong La Niña, suppressing the temperature. This time, we have an El Niño, as illustrated by the NOAA image on the right. 

[ click on images to enlarge ]
The annual Arctic sea ice extent minimum is typically reached in September and the North Atlantic sea surface temperature is critical in regard to melting of the Arctic sea ice. The already high sea surface temperature together with the impact of the El Niño make the outlook for Arctic sea ice for September 2023 look grim.

Sea ice concentration is getting lower in many places and there is open water in parts of the Beaufort Sea and Baffin Bay, as illustrated by the Uni of Bremen image on the right.

Rising temperatures in the Arctic threaten to trigger massive loss of Arctic sea ice over the coming months. 

The image on the right, from polarportal.dk, shows very low Arctic sea ice volume for the time of year on June 8, 2023, already much lower than the volume on the same date for any of the four previous years.

The NASA Worldview image below shows, on the left, that Arctic sea ice is very thin on June 4, 2023, with open water close to the North Pole.

On the right of the image below, the Franz Jozef Archipelago, some 1000 km from the North Pole.


The image below shows the situation on June 6, 2023. 


The image on the right, from the Uni of Bremen, shows Arctic sea ice thickness on June 3, 2023.

On the one hand, it's terrible to see open water close to the North Pole so early in the year, yet on the other hand, this may enable ocean heat to escape to the atmosphere and thus delay eruption of seafloor methane (image below). 

As discussed in earlier posts such as this one, conditions are dire:
• Earth's energy imbalance is at record high
• emissions are at record high
• greenhouse gas concentrations are at record high
• temperatures are very high, especially in the Arctic
• North Atlantic sea surface temperature is at record high
• sea ice is very vulnerable
• the Jet Stream is strongly deformed

The image below shows the extent of the deformation of the Jet Stream on June 6, 2023. No less than 26 circular wind patterns (at 250 hPa) are marked on the image, which also shows sea surface temperature anomalies. The Jet Stream is also crossing the Equator.


Furthermore, there are circumstances that could coincide in a cataclysmic alignment: El Niño is on the way, sunspots are higher than predicted and the Tonga submarine volcano did add large amounts of water vapor high into the atmosphere.

All this looks set to jointly result in massive loss of Arctic sea ice over the coming months, with loss of the latent heat buffer and loss of albedo threatening to trigger eruption of methane from the seafloor of the Arctic Ocean, as has been described many times before, such as in this post, in this post and in this post.

[ Latent heat loss, feedback #14 on the Feedbacks page ]
[ see the Extinction page ]
Both loss of Arctic sea ice and eruption of seafloor methane constitute tipping points that threaten to abruptly accelerate the temperature rise in the Arctic, thus also accelerating loss of permafrost in Siberia and North America that threatens to trigger further releases of greenhouse gases.

In addition, there are further events and developments that could unfold and make things even worse.

The upcoming temperature rise on land on the Northern Hemisphere could be of such a severity that much traffic, transport and industrial activity will grind to a halt, resulting in a reduction in cooling aerosols that are now masking the full wrath of global heating. Without these cooling aerosols, the temperature is projected to rise strongly, while there could be an additional temperature rise due to an increase in warming aerosols and gases as a result of more biomass and waste burning and forest fires. Furthermore, as traffic slows down, there will be less nitrogen oxide emissions, which could result in less hydroxyl to curtail methane.

The bar on the right depicts the threat, as discussed at the Extinction page.

In conclusion, the situation is dire and calls for support for a Climate Emergency Declaration.


Links

• Climate Reanalyzer - Daily temperature anomaly
https://climatereanalyzer.org/wx/todays-weather/?var_id=t2anom&ortho=1&wt=1

• Climate Reanalyzer - Daily sea surface temperatures 
https://climatereanalyzer.org/clim/sst_daily

• NOAA - Climate Prediction Center - ENSO Diagnostic Discussions
https://www.cpc.ncep.noaa.gov/products/analysis_monitoring/enso_advisory/ensodisc.shtml

• University of Bremen - sea ice concentration and thickness
https://seaice.uni-bremen.de/start

• Polar Portal - Arctic sea ice thickness and volume
http://polarportal.dk/en/sea-ice-and-icebergs/sea-ice-thickness-and-volume

• NASA Worldview
https://worldview.earthdata.nasa.gov

• Wetland emission and atmospheric sink changes explain methane growth in 2020 - by Sushi Peng et al. 

• Climate Plan
https://arctic-news.blogspot.com/p/climateplan.html

• Climate Emergency Declaration
https://arctic-news.blogspot.com/p/climate-emergency-declaration.html