On April 22nd, 2018, Arctic sea ice extent was only 13.552 million km², a record low for the time of year. In 1987, by comparison, sea ice extent wasn't below 13.574 million km² even on May 22nd.
Meanwhile, CO₂ (carbon dioxide) levels are rising. The image on the right shows that Mauna Loa's CO₂ hourly average level was above 413 ppm recently. The daily average CO₂ level reached 412.37 ppm on April 23, 2018.
Fires are raging near the Amur River in East Siberia, with associated high emissions, as illustrated by the images below.
Above image shows CO₂ levels reaching as high as 973 ppm on April 18, 2018. As the image below shows, carbon monoxide levels at that spot were as high as 43,240 ppb on April 18, 2018.
The NASA satellite image below shows smoke plumes of the fires and burn scars on April 19, 2018.
Stuart Scott has produced two new videos in which he interviews Professor Peter Wadhams,
A Conversation with Dr. Peter Wadhams - Part 1
and the video below, A Conversation with Dr. Peter Wadhams - Part 2
The situation is dire and calls for comprehensive and effective action, as described in the Climate Plan.
The image below shows a forecast of above freezing temperatures over the North Pole on Feb 5, 2018.
Above image shows a forecast of air temperature of 0.2°C or 32.4°F at 1000 hPa over the North Pole on February 5, 2018, 21:00 UTC.
Above image shows a forecast of temperatures of 1.1 °C or 33.9°F at the North Pole at 1000 hPa, on February 5, 2018, 18:00 UTC.
Above image shows a large area around the North Pole forecast to be up to 30°C or 54°F warmer than 1979-2000 on February 5, 2018.
Above image shows sea surface temperatures as high as 15.1°C or 59.2°F near Svalbard on February 9, 2018, in the panel on the left, and air temperatures as high as 6°C or 42.7°F (at 1000 hPa) near Svalbard on February 10, 2018, in the panel on the right.
These high temperatures are caused not only by ocean heat, but also by strong winds pushing warm air and water up from the North Atlantic into the Arctic. Above image shows the Jet Stream moving at speeds as high as 315 km/h or 196 mph (green circle, February 6, 2018, 6:00 UTC), moving in backward direction over Scandinavia, while extending over Antarctica and crossing the Equator at a number of places.
The decreasing temperature difference between the North Pole and the Equator is slowing down the speed at which the jet stream circumnavigates Earth and this is also making the jet stream more wavy.
As a more wavy jet stream extends deeper down over land, it allows cold air from the Arctic to flow down over land. As temperatures over land fall, the difference between ocean temperature and land temperature increases, especially in winter when land temperatures are much lower than ocean temperatures. This increasing difference between land and ocean temperature makes winds stronger and faster over oceans.
[ click on images to enlarge ]
In above image, the left panel shows a wavy jet stream speeding up over the North Atlantic, reaching speeds as high as 345 km/h or 215 mph (at green circle, 250 hPa).
In above image, the right panel shows strong winds pushing warm air from the Pacific Ocean through Bering Strait, resulting in temperatures over Alaska as high as 6.6°C or 44°F (at green circle, at 850 hPa).
The image on the right shows that waves as high as 8.27 m or 27.2 ft (at green circle) are forecast to enter the Arctic Ocean near Svalbard on February 5, 2018, giving an indication of the huge amount of energy that is going into oceans.
Earth is retaining more heat. This translates into higher surface temperatures, more heat getting stored in oceans and stronger winds. This in turn is causing higher waves and more evaporation from the sea surface. The image on the right shows a forecast of total amount of cloud water (in air from surface to space) of 1.5 kg/m² (green circle) in between Svalbard and the North Pole on February 5, 2018.
Warm air, warm water and high waves make it hard for sea ice to form, while evaporation from the ocean adds more water vapor to the atmosphere. Since water vapor is a potent greenhouse gas, this further accelerates warming of the Arctic.
The high temperatures at the North Pole follow high temperatures over East Siberia, as illustrated by the image below.
Above image shows average temperature anomalies for January 31, 2018, compared to 1979-2000. The image below shows open water on the East Siberian coast in the Arctic Ocean that day.
Meanwhile, Arctic sea ice extent is very low. The image below shows that extent on January 30, 2018, was 13.391 million km², a record low for the time of the year.
In the video below, Paul Beckwith discusses the situation.
From the interview, Sam Carana: "Methane releases from the seafloor of the Arctic Ocean have a strong warming impact, especially locally, AND methane releases in the Arctic also act as a catalyst for other feedbacks that are all self-reinforcing and interlinked, amplifying each other in many ways. It could easily become 10°C or 18°F warmer in a matter of years, especially in places where most people are now living."
The image below shows that on February 11, 2018, methane reached peak levels as high as 2925 ppb.
High methane peaks are becoming more common as the water temperature of oceans keeps rising, which also goes hand in hand with more water vapor and less sea ice. As said, these are all warming elements that amplify each other in many ways.
On Feb 8, 2018, Antarctic sea ice extent was 2.382 million km², a record low for the time of the year and 1.811 million km² less than the extent on Feb 8, 2014.
The image on the right illustrates the huge loss of sea ice around Antarctica over the past few years. Antarctic sea ice looks set to reach an all-time low extent later this month, with a difference of close to 2 million km² persisting, compared to just a few years ago.
The image below shows a forecast for February 5, 2018, with as much as 3.84 kg/m² (green circle) Total Cloud Water in between South Africa and Antarctica.
More water vapor in the air contributes to global warming, since water vapor is a potent greenhouse gas. The image below shows a forecast for February 5, 2018, with temperatures on Antarctica reaching as high as 8.9°C or 47.9°F (update Feb. 11, 2018: 7.1°C or 44.7°F at 78°S, 17°E at 1000 hPa on Feb. 5, 2018, 15:00z).
At this time of year, global sea ice is typically at its lowest extent for the year. On February 9, 2018, global sea ice reached the lowest extent on record, as illustrated by the image below by Wipneus.
This means that a huge amount of sunlight that was previously reflected back into space is now instead getting absorbed by oceans.
The situation is dire and calls for comprehensive and effective action, as described in the Climate Plan.
On January 1, 2018, methane levels as high as 2764 ppb (parts per billion) were recorded. The solid magenta-colored areas near Greenland indicate that this very high reading was likely caused by methane hydrate destabilization in the sediments on the seafloor of the Arctic Ocean.
The state of the sea ice is behind this. On January 1, 2018, Arctic sea ice extent was at record low for the time of the year. The smaller the extent, the less sunlight gets reflected back into space and is instead absorbed in the Arctic.
At this time of year, though, hardly any sunshine is reaching the Arctic. So, what triggered this destabilization? As the image below indicates, year-to-date average Arctic sea ice volume has been at record low in 2017, which means that there has been very little sea ice underneath the surface throughout 2017.
Warm water will melt the sea ice from below, which keeps the water at greater depth cool. However, when there is little or no sea ice underneath the surface, little or no heat will be absorbed by the process of melting and the heat instead stays in the water, with the danger that it will reach sediments at the bottom of the Arctic Ocean, as illustrated by the image below.
The image on the right shows warm water from the North Atlantic arriving near Svalbard. How warm is the water beneath the surface of the Arctic Ocean? The image below gives an indication, showing how much warmer the water was from October 1, 2017, to December 30, 2017, at selected areas near Svalbard, where warm water from the North Atlantic dives under the sea ice of the Arctic Ocean, carried by the Gulf Stream.
[ click on images to enlarge ]
In 1981-2011, temperatures were gradually falling by more than one degree Celsius from October 1 to the December 21 Solstice, then started to rise again in line with the change in seasons (blue line). In 2017, temperatures were rising in October. On October 25, 2017, the sea surface was as warm as 17.5°C or 63.5°F, i.e. a 14.1°C or 24.5°F anomaly. On average, it was 12.96°C or 23.35°F warmer during the period from October 1 to December 30, 2017 (red line), compared to the same days in 1981-2011.
The images below further illustrate the situation. Surface temperature of the atmosphere near Svalbard was as warm as 7°C or 44.5°F on January 13, 2018 (at green circle, left panel). The sea surface near Svalbard was as warm as 15.9°C or 60.8°F on January 12, 2018, compared to 2.4°C or 36.4°F on January 12 for the period 1981-2011 (at green circle, center panel). Waves as high as 13.04 m or 42.8 ft (at green circle, right panel) batter the North Atlantic along Norway's coast all the way to Svalbard on January 15, 2018.
The image below shows that waves as high as 16.01 m or 52.5 ft are forecast to batter the North Atlantic on January 16, 2018 (green circle, left panel). 100% relative humidity is recorded over the Arctic Ocean on January 15, 2018 (green circle, center panel). The Jet Stream reaches speeds as high as 426 km/h or 264 mph on January 15, 2018 (green circle, right panel).
Similar extreme weather patterns can be seen elsewhere in the Arctic. The image below on the left shows that temperatures as high as 18.5°C or 65.3°F were recorded on Jan. 14 and 15, 2018 in Metlakatla, Alaska. The image below on the right shows that surface temperatures as high as 7.4°C or 45.2°F were reached on January 16, 2018, in Yukon Territory, Canada (at green circle).
[ click on images to enlarge ]
In conclusion, as the Arctic is warming up faster than the rest of the world, Jet Streams are getting more wavy, resulting in more extreme weather events. Wind speed accelerates over warmer oceans, pushing more heat into the Arctic Ocean, threatening to cause eruptions of huge amounts of methane from the Arctic Ocean seafloor.
The situation is dire and calls for comprehensive and effective action as described at the Climate Plan.
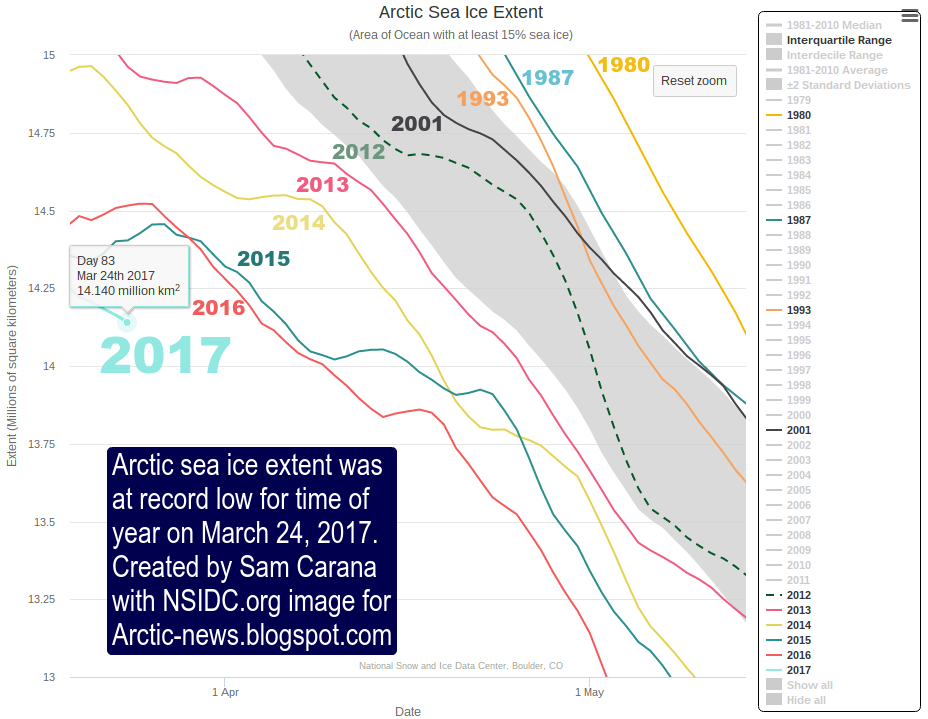
Earth is losing her sea ice. Arctic sea ice was at record low extent for the time of the year on March 24, 2017, as illustrated by the image below.
As the image below shows, on March 24, 2017, Arctic sea ice featured many cracks (top of Greenland is bottom left and Svalbard is on the right).
The poor state of Arctic sea ice is also reflected by the sea ice volume, as depicted by the image below, by Wipneus, showing PIOMAS anomalies up to March 2017.
On March 24, 2017, Antarctic sea ice extent was also much lower than it used to be at this time of year, as illustrated by the image below.
Altogether, global sea ice extent has now been at a record low for many months, as illustrated by the graph by Wipneus below. This means that a huge amount of additional sunlight has been absorbed over these months, instead of getting reflected back into space as before.
As Earth loses her sea ice, tipping point look set to be crossed that could result in rapid acceleration of Earth's temperature, as discussed at the extinction page, which warns that surface temperatures of the atmosphere could rise by some 10°C or 18°F within a decade, i.e. by 2026.
The situation is dire and calls for comprehensive and effective action, as described in the Climate Plan.
On March 2, 2017, Antarctic sea ice extent was at a record low since satellite readings started.
As the image on the right shows, sea ice extent in 2017 (light blue) around Antarctica has been more than 1 million km² lower than the 1981-2010 median.
At the same time, Arctic sea ice extent was at a record low for the time of the year since 1979.
As the image underneath on the right shows, Arctic sea ice extent in 2017 has also been more than than 1 million km² lower than the 1981-2010 median.
[ click on images to enlarge ]
For about half a year now, global sea ice extent has been more than 2 million km² lower than it used to be, not too long ago, as illustrated by the image below, by Wipneus.
This means that a lot of sunlight that was previously reflected back into space, has been absorbed instead by Earth, contributing to global warming, especially at the poles.
Greater warming at the poles has also caused more extreme weather, resulting in stronger winds and waves and in wild weather swings, further accelerating the decline of the sea ice.
The combination of rising ocean heat and stronger winds looks set to devastate the sea ice around Antarctica. Ocean heat is increasing particularly in the top layer (see image on the right).
Warming water is increasingly reaching the coast of Antarctica. The image below illustrates how much sea ice melt has occurred close to the coast of Antarctic over the past few months, while much sea ice has drifted away from the coast due to strong currents and wind.
As said, less sea ice means that a lot of sunlight is no longer reflected back into space, but is instead further warming up the poles. As a result, methane levels can be very high at both poles. The combination image below shows methane levels as high as 2560 ppb on March 1, 2017. The image in the panel on the left shows high methane levels over Antarctica in an area with much grey, indicating that it was hard to get a good reading there. On the image in the panel on the right, high methane levels do show up clearly in that area.
[ click on images to enlarge ]
As discussed before, methane hydrates can be present both on Greenland and on Antarctica underneath thick layers of snow and ice. Due to global warming, wild weather swings are now common at the poles, as illustrated by the image below. This can cause sequences of rapid and extreme expansion, compacting and fracturing of snow and ice, resulting in destabilization of methane hydrates contained in the permafrost.
The image below shows methane levels as high as 2562 ppb, with solid magenta-colored areas showing up over the Laptev Sea on March 4, 2017.
The image below shows that sea surface temperatures in the Arctic Ocean were as high as 12.7°C or 54.9°F on March 3, 2017 (at the location marked by the green circle), i.e. 12°C or 21.6°F warmer than in 1981-2011.
Below is the same image, but in a different projection and showing sea surface temperatures, rather than anomalies. In 1981-2011, the temperature of the water at a spot near Svalbard (green circle) was 0.7°C (33.3°F.). On March 3, 2017, it was 12°C (21.6°F) warmer on that spot.
The danger is that self-reinforcing feedback loops such as albedo decline and methane releases will further accelerate warming and will, in combination with further warming elements, cause a temperature rise as high as 10°C or 18°F by the year 2026, as described at the extinction page.
The situation is dire and calls for comprehensive and effective action as described in the Climate Plan.
On November 2, 2016, Arctic sea ice extent was at a record low for the time of the year, i.e. only 7.151 million km².
The currently very low sea ice extent is further dragging down the average annual sea ice extent, which is also at a record low, as illustrated by the image below, from the blog by Torstein Viðdalr.
Not only is Arctic sea ice extent very low, the sea ice is getting thinner and thinner, as illustrated by the image below, by Wipneus, showing the dramatic recent decline of Arctic sea ice thickness.
As the Naval Research Lab 30-day animation below shows, Arctic sea ice isn't getting much thicker, despite the change of seasons.
Naval Research Lab 30-day animation (new model) up to Nov 1, 2016, with forecast up to Nov 9, 2016
In the two videos below, Paul Beckwith further explains the situation.
Paul Beckwith: "Arctic sea ice regrowth is eff'd this year, in fact is truly horrible. As the ice extent, defined as regions with at least 15% ice, tries to expand via sea water freezing, it is melted out by extremely high sea surface temperatures. Then the cooled surface water mixes via wave action with warmer water down to as much as 200 meters and the warm mixtures at the surface continue the process of sea ice melting. Without strong ice regrowth, we will reach the state we are heading to. Namely, zero sea ice. We must break this vicious cycle, by declaring a global climate emergency, and implementing the three-legged-stool solution set."
As global warming raises the temperature of the sea surface and the atmosphere over the sea surface, ever stronger winds develop, in turn resulting in stronger waves and higher amounts of water in clouds.
The image below shows forecasts for November 9, 2016, of waves as high as 13.76 m (green circle, left panel) and of total amounts of water (from surface to space) as much as 1.38 kg/m² (green circle right panel, near Novaya Zemlya).
[ click on images to enlarge ]
High waves make it hard for sea ice to form, while greater evaporation from warmer oceans adds more water vapor to the atmosphere. More water vapor in the atmosphere results more precipitation. Rain can devastate the sea ice, as discussed in an earlier post. Furthermore, snow can inhibit formation of thicker is, as David Barber explains. Also, being a potent greenhouse gas, water vapor will further accelerate warming of the Arctic.
The dire state of the sea ice indicates that the water of the Arctic Ocean is getting warmer and warmer.
On October 31, 2016, the Arctic Ocean was as warm as 17°C or 62.7°F (green circle near Svalbard), or 13.9°C or 25°F warmer than 1981-2011. This indicates how much warmer the water is beneath the surface, as it arrives in the Arctic Ocean from the Atlantic Ocean.
Below is an update of the situation on methane. Contained in existing data is a trend indicating that methane levels could increase by a third by 2030 and could almost double by 2040.
Why is methane so important? On a 10-year timescale, methane causes more warming than carbon dioxide. Unlike carbon dioxide, methane's Global Warming Potential rises as more of it is released. Methane's lifetime can be extended to decades, in particular due to depletion of hydroxyl in the atmosphere.
Ominously, the image below shows that on November 9, 2016, methane levels were very high over the Laptev Sea (solid magenta color north of Siberia).
The image below shows that methane levels on November 9, 2016, were as high as 2633 parts per billion (at a slightly higher altitude corresponding to a pressure of 469 mb).
Temperatures over the Arctic Ocean are forecast to remain high, reflecting the very high temperature of the water.
The danger is that, as global warming continues and as the Arctic snow and ice cover keeps shrinking, warming of the Arctic Ocean will speed up and destabilize methane hydrates contained in sediments at its seafloor, triggering huge methane eruptions that will further accelerate warming. This could contribute to make global temperature rise by as much as 10°C or 18°F over the coming decade.
The situation is dire and calls for comprehensive and effective action, as described in the Climate Plan.