Showing posts with label IASI. Show all posts

Sunday, December 30, 2012

High methane levels persist in December 2012

The image below was posted earlier at Methane contributes to accelerated warming in the Arctic. As mentioned there, this is a compilation of images produced by Dr. Leonid Yurganov, comparing methane levels between November 21-30, 2008 (below left), and November 21-30, 2012 (below right).


Dr. Yurganov has released two further images this year, i.e. for December 1-10, 2012 (below left), and for December 11-20, 2012 (below right).


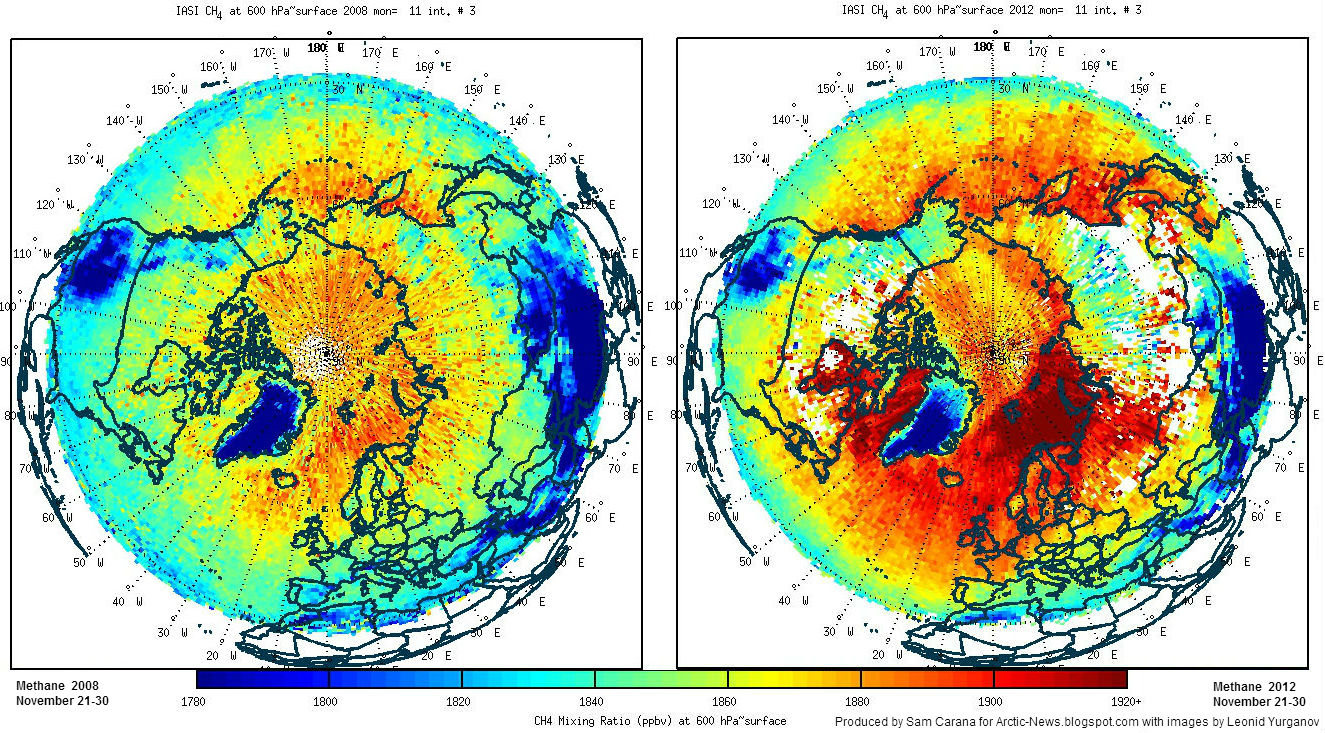
The images show that the highest methane levels show up above the water, as opposed to above land, indicating that methane is being released from the seabed across the Arctic. The images further show that high levels of methane persist in December 2012.

Apart from comparing 10-day periods, we can also look at methane levels for individual days. The NOAA image below shows methane levels up to 2167 ppb on December 27, 2012, for the morning set of measurements.

To better see where the high (yellow) levels of methane were measured, a map with empty data is added below, showing the location of the continents more clearly on the map.


Pressure levels at which measurements are taken are displayed in hectopascals (symbol hPa) which are numerically equivalent to millibars (mb). A pressure of 600 mb (or hPa) corresponds with an altitude of 13794.9 ft (4204.7 m). By comparison, air pressure at mean sea level is 1013.25 hPa (millibar), or 29.92 inches of mercury.

The map below, from apocalypse4realmethane2012, shows methane measurements taken on the same day (December 27, 2012, morning set), but at 718 mb, which corresponds with an altitude that is a bit closer down to sea level. The map focuses on the Arctic and shows geographic names. If you like, click on the map to enlarge it.


Methane measurements were taken with the IASI (Infrared Atmospheric Sounding Interferometer) instrument, fitted onto the European Space Agencys (ESA) MetOp series of polar orbiting satellites.


For further analysis, the NOAA image with surface temperature anomalies for December 28, 2012, is added above, showing anomalies up to 20 degrees Celsius. Furthermore, the NOAA image with sea surface temperature anomalies for December 27, 2012, is added below, showing anomalies up to 5 degrees Celsius.

Friday, May 18, 2012

Striking increase of methane in the Arctic


Click on image to enlarge

Dr. Leonid Yurganov, Senior Research Scientist, JCET, UMBC, and member of AMEG, produced the above images with IASI/METOP satellite data (EUMETSAT).

The images show methane levels for 2008, 1-10 November, and for 2011, 1-10 November.

The images show a striking increase of methane over the shelf areas of the Arctic Ocean.

For reference, the image on the right is added, showing predicted methane hydrates, as published by WWF with surface temperature hotspots added.

Dr. Yurganov points at the threat of large emissions of methane from clathrates (methane hydrates) in the Arctic, and urges others to support his proposals for further satellite methane monitoring.

Current growth of methane is being monitored by the Atmospheric Infrared Sounder (AIRS) facility on NASA's Aqua satellite.

Dr. Yurganov has been using AIRS data for years and points at an image he produced using AIRS data. The image shows that, during the autumn of 2011, the anomaly in the Northern Hemisphere was substantially larger than the anomaly in the Southern Hemisphere.
ftp://asl.umbc.edu/pub/yurganov/methane/AIRS_CH4_2002-2012.pdf

Monthly mean maps of methane are available at Dr. Yurganov's website. The maps have been produced using AIRS data since 2002 up to now, for both the Northern Hemisphere and the Southern Hemisphere. The maps are at:
ftp://asl.umbc.edu/pub/yurganov/methane/MAPS/

Comparisons with other instruments for the Arctic are still few or lacking. Examples are for TANSO, May-November, 2010:
ftp://asl.umbc.edu/pub/yurganov/methane/MAPS/TANSO_2010day&night.jpg