Showing posts with label sea surface temperature. Show all posts

Saturday, March 2, 2024

Arctic sea ice set for steep decline


The February 2024 temperature (at 2 meter) was much higher than in 1951-1980, especially in the Arctic, as the above image shows.


The above image is adapted from NASA and shows an average February 2024 temperature anomaly of 1.44°C above 1951-1980, with anomalies showing up as high as 11°C. 


The above image is created with NASA Land+Ocean monthly mean global temperature anomalies versus a 1900-1923 custom base, further adjusted by 0.99°C to reflect ocean air temperatures, higher polar anomalies and a pre-industrial base. 

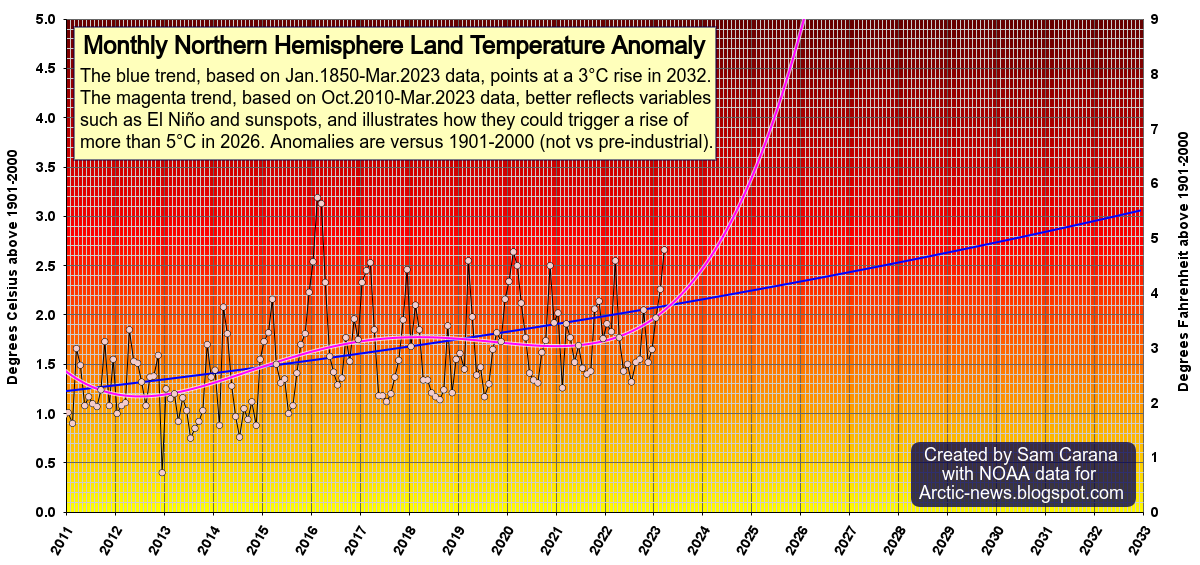
Two trends are added, the blue trend is based on all data (Jan.1880-Feb.2024) and the magenta trend is based on a shorter period (Jan.2010-Feb.2024), to better reflect variables such as El Niño and non-linear feedbacks as discussed in the page Feedbacks in the Arctic and in this recent post

Ocean temperature


Sea surface temperatures (60°S-60°N, 0-360°E) reached a new record high of 21.22°C on March 10, 2024, in the Climate Reanalyzer daily records that go back to 1981. 

Sea surface temperatures may get even higher later this year. What could make the sea surface temperature go up even higher?

[ click on images to enlarge ]
The highest daily sea surface temperatures for the year are typically reached in March. 

This was the case for the previous years on record going back to 1981, except for the year 2023 when the current El Niño started to emerge, resulting in the highest peak for the year occurring in August 2023.

There is a 100% probability that El Niño will be present during the 3 months from February 2024 to April 2024, according to NOAA predictions updated February 26, 2024.

The image below shows the Northern Hemisphere Sea Surface Temperature Anomaly, January 2000-February 2024 NOAA data (degrees Celsius).

After an astonishing rise in 2023, sea surface temperatures have come down only a little bit in Winter on the Northern Hemisphere, raising the potential for a huge rise in ocean heat later in 2024 that threatens to destabilize sediments at the seafloor of the Arctic Ocean and cause huge amounts of methane to erupt and abruptly enter the atmosphere.
[ click on images to enlarge ]
Ocean heat content keeps rising at a rate of change that is non-linear, as illustrated by the image below, by Zack Labe.


North Atlantic

The animation below, from Nahel Belgherze, illustrates how much hotter the North Atlantic has been over the past 365 days, while a big rise in temperature can be expected over the next few months, due to the change in season.


In February 2024, the temperature (at 2 meter) over the North Atlantic was 1.927°C higher than 1951-1980, as illustrated by the image below. 

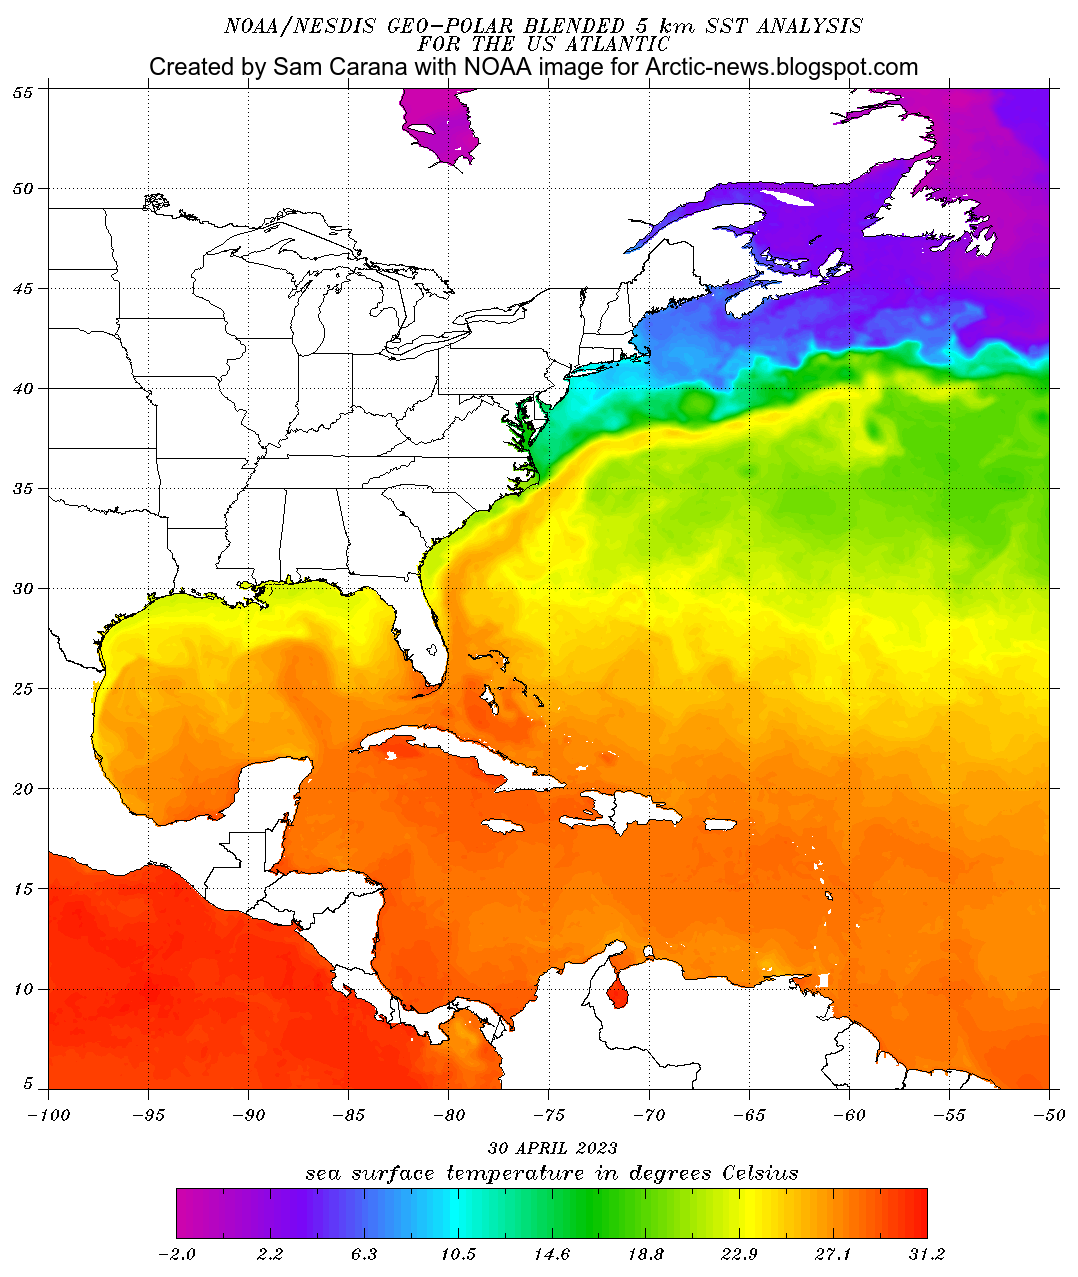
The map below shows the North Atlantic sea surface temperature anomaly versus 1951-1980 in February 2024. 


Arctic surface air temperature

The surface air temperature in the Arctic (66.5-90°N, 0-360°E) was 5.2°C above 1979-2000 on March 3, 2024, the highest anomaly on record for the time of year, as illustrated by the image below. 

[ click on images to enlarge ]

Arctic sea ice

As the atmosphere and the oceans keep heating up, Arctic sea ice keeps declining. As illustrated by the image below, Arctic sea ice extent was 14.746 million km² on March 6, 2024. 


As the above image shows, there are a few years with lower sea ice extent during this time of year than in 2024, which could be due to more water vapor in the air causing more precipitation in the Arctic. At this time of year, Arctic sea ice has typically reached its maximum annual extent and goes into steep descend until half September. With the change in seasons, more sunlight will be reaching the Northern Hemisphere and Arctic sea ice looks set for a steep decline over the next few months. 


As illustrated by the above image, Arctic sea ice volume is already at a record low for the time of year, at a time when little or no sunlight is yet reaching the Arctic. Given that Arctic sea ice currently is not at a record low extent for the time of year, this indicates that the sea ice is very thin, due to ocean heat causing sea ice to melt from below. Moreover, as illustrated by the map below, much of the thicker sea ice is located off the east coast of Greenland. This sea ice and the purple-colored sea ice can be expected to melt away quickly with the upcoming rise in temperatures over the next few months, as also discussed in earlier posts such as this one

Emissions and concentrations of greenhouse gases keep rising

Meanwhile, emissions keep rising. The image below, adapted from IEA, shows the increase in energy-related carbon dioxide emissions, 1900-2023. 


February 2024 CO₂ was about 425 ppm (background image below). February 2023 CO₂ was 420.3 ppm (inset right). The highest annual rise on record is about 3 ppm, reached in 1998 and in 2015/2016 (inset left). 

The threat

The threat of a huge, abrupt temperature rise has been described many times before, e.g. on the Threat page that describes many elements contributing to the threat, both cumulatively and interactively, with some of the content dating back as far as 2007. Another page with more background is the Extinction page.

Further illustrating the threat is the image below, adapted from Climate Reanalyzer and using a CMIP6 SSP585 model. The image shows what the temperature anomaly (at 2 meter and compared to 1851-1900) could be by 2100. Such a temperature rise may unfold much earlier when including numerous feedbacks kicking in strongly.


What can strongly contribute to such a rise is that, without the buffer constituted by thicker sea ice, an influx of ocean heat threatens to destabilize hydrates contained in sediments at the seafloor of the Arctic Ocean, resulting in eruptions of huge amounts of methane.

[ The buffer is gone - Latent Heat Tipping Point crossed ]
Climate Emergency Declaration

The situation is dire and the precautionary principle calls for rapid, comprehensive and effective action to reduce the damage and to improve the situation, as described in this 2022 post, where needed in combination with a Climate Emergency Declaration, as discussed at this group.


Links

• Climate Reanalyzer - daily sea surface temperature (60°S-60°N, 0-360°E)
https://climatereanalyzer.org/clim/sst_daily

• NASA - Temperature Analysis
https://data.giss.nasa.gov/gistemp

• NOAA - ENSO: Recent Evolution, Current Status and Predictions (February 26, 2024 update)
https://www.cpc.ncep.noaa.gov/products/analysis_monitoring/lanina/enso_evolution-status-fcsts-web.pdf

• Ocean heat content - image by Zack Labe

• North Atlantic daily sea surface temperature - animation by Nahel Belgherze
https://twitter.com/WxNB_/status/1765065264109101393

• Polar Portal - Arctic sea ice thickness and volume

• International Energy Agency (IEA) - CO2 Emissions in 2023 report

• Keeling Curve, Scripps Institution of Oceanography, UC San Diego - CO₂ at Mauna Loa, Hawaii 

• NOOA - Monthly Averages CO₂ at Mauna Loa, Hawaii 

• NOAA - annual increase of CO₂ at Mauna Loa, Hawaii 
https://gml.noaa.gov/ccgg/trends/gr.html

• Feedbacks in the Arctic

• The Threat


Monday, April 24, 2023

Humans may be extinct in 2026

Global temperature rise

The image below illustrates the threat that the temperature rise may exceed 3°C. The blue trend, based on January 1880 to March 2023 data, shows how 3°C could be crossed in 2036. The magenta trend, based on January 2010 to March 2023 data, better reflects relatively short-term variables such as El Niño and illustrates how 3°C could be crossed as early as in 2025.


The above image uses monthly NASA Land+Ocean temperature anomalies versus 1886-1915 that are further adjusted by 0.99°C to reflect ocean air temperatures, higher polar anomalies and a pre-industral base, as also illustrated by the image below. 


What could cause the temperature rise to cross 3°C in 2025? This has been discussed in earlier posts such as this one. Briefly, such a rise could be triggered by relatively short-term variables such as the upcoming El Niño, high sunspots and extra water vapor in the atmosphere due to the eruption of a submarine volcano. Together, they could raise temperatures by more than half a degree Celsius, triggering the compound impact of further events including feedbacks kicking in with greater ferocity and tipping points getting crossed, such as the latent heat tipping point and the seafloor methane tipping point.

Indeed, rising temperatures threaten to cause massive loss of sea ice followed by eruptions of methane from the seafloor of the Arctic Ocean. This threat is further illustrated by the image below. 

Sea surface temperature

On April 29, 2023, the sea surface off the coast of South America was as much as 6.1°C or 10.9°F hotter than it was in 1981-2011, as illustrated by the image below that also shows a distorted Jet Stream that is stretched out from pole to pole (wind at 250 hPa).


Sea Surface Temperature World (60S-60N)

On April 28, 2023, the world sea surface temperature (SST between 60°South and 60°North) had been at 21°C or higher for as many as 38 days. Such temperatures are unprecedented in the NOAA record that goes back to 1981.


Recently (e.g. on April 4, 2023), the sea surface temperature in 2023 (black line) was as much as 0.3°C higher than in 2022 (orange line) on April 28, 2023, and this while we're only just entering the upcoming El Niño.

Sea Surface Temperature North Atlantic

The situation is especially critical in the North Atlantic. Last year (in 2022), North Atlantic sea surface temperatures reached a record high of 24.9°C in early September. Recently (e.g. on April 4, 2023), the North Atlantic sea surface temperature was as much as 0.5°C higher (black line) than in 2022 (orange line).


On April 28, 2023, the sea surface temperature in the North Atlantic was 20.6°C, the highest temperature for the time of year in the NOAA record that goes back to 1981. 

As we're moving into the upcoming El Niño, the Arctic Ocean can be expected to receive more and more heat over the next few years, i.e. more heat from direct sunlight, more heat from rivers, more heat from heatwaves and more ocean heat from the Atlantic Ocean and the Pacific Ocean.

Monthly Northern Hemisphere Land Temperature Anomaly

Temperatures have been rising especially fast on land in the Northern Hemisphere, where most people are living. As temperatures keep rising, more extreme weather events can be expected that can make life hard, if not impossible, even at higher latitudes.

The image below shows monthly anomalies up to March 2023, with two trends added. The blue trend, based on January 1850-March 2023 NOAA data, points at a 3°C rise in 2032. The magenta trend, based on October 2010-March 2023 NOAA data, better reflects variables such as El Niño and sunspots, and illustrates how they could trigger a rise of more than 3°C in 2024 and a rise of more than 5°C in 2026. Note that the image displays anomalies versus 1901-2000, anomalies versus pre-industrial would be significantly higher.
  
[ from earlier post ]
Greenhouse gas levels

Carbon dioxide (CO₂) broke three records recently, for the daily, weekly and monthly average. The daily CO₂ average was 425.01 ppm on April 28, 2023, the weekly CO₂ average was 424.4 ppm for the week beginning on April 23, 2023, and the monthly CO₂ average was 423.38 ppm in April 2023, each of them the highest carbon dioxide levels on record at Mauna Loa, Hawaii, as illustrated by the image below.


CO₂ typically reaches its annual high in May or June, so these records can be expected to be broken over the next few months.
[ from earlier post ]

Even more crucially, methane emissions should be cut rapidly and dramatically, as discussed in an earlier post. If a trend such as the one in the above image continues, the Clouds Tipping Point could be crossed as early as in 2027 due to forcing caused by the rise in methane alone, while  this could happen even earlier than in 2027 when further forcing other than just the forcing from methane is taken into account. Crossing the Clouds Tipping Point, at 1200 ppm CO₂e, could on its own cause a further rise of 8°C. 

NOAA's 1924.99 ppb for the December 2022 global methane mean translates into 385 ppm CO₂e when using a 1-year GWP of 200 for methane.

So, adding this 385 ppm CO₂e to 425 ppm CO₂ would leave just 390 ppm CO₂e for further forcing, before the Clouds Tipping Point would get crossed, as the image on the right illustrates.

Methane at higher altitude can reach even higher levels than NOAA's global marine surface data. As illustrated by an image in an earlier post, monthly methane recently rose to above 1950 ppb at Mauna Loa, Hawaii.

Further changes such as caused by sea ice loss and changes in aerosols can also speed up the temperature rise.

El Niño and further variables

We're moving into an El Niño, as illustrated by the image on the right, adapted from NOAA.

Moving from the bottom of a La Niña to the peak of a strong El Niño could make a difference of more than half a degree Celsius, as discussed in an earlier post. El Niño can be expected to reach its full strength within a few years, with a maximum possible in 2026.

Furthermore, sunspots look set to reach a very high maximum within years, while the 2022 Tonga submarine volcano eruption did add a huge amount of water vapor to the atmosphere, as discussed in an earlier post.

In the video below, Guy McPherson gives his views.


Extinction

Vast amounts of ocean heat are moving toward the Arctic, especially in the North Atlantic, threatening to cause rapid melting of Arctic sea ice and thawing of permafrost.

The image on the right, adapted from NOAA, shows ocean heat moving toward the Arctic along the path of the Gulf Stream. 

Rising temperatures of the water in the Arctic Ocean threaten to trigger massive loss of sea ice (and loss of albedo) and eruptions of methane from the seafloor of the Arctic Ocean, as has been described many times before, such as in this post, in this post and in this post.

[ from earlier post ]
The above image illustrates the danger of two tipping points getting crossed, i.e. the Latent Heat Tipping Point and the Seafloor Methane Tipping Point.

Latent heat loss, feedback #14 on the Feedbacks page
[ see analysis at the Extinction page ]
Destabilization of methane hydrates at the seafloor of the Arctic Ocean threatens to result in explosive eruptions of methane, as its volume increases 160 to 180-fold when leaving the hydrates, as illustrated by the above image.

Conclusion

A huge temperature rise thus threatens to unfold over the next few years, as illustrated by the image on the right. The annual rise from pre-industrial to 2026 could be more than 18.44°C by 2026, and monthly anomalies could reach even higher.

Meanwhile, humans are likely to go extinct with a rise of 3°C and most life on Earth will disappear with a 5°C rise, as illustrated by the image below, from an analysis discussed in an earlier post.

This dire situation calls for urgent action as described in the Climate Plan. Reducing emissions alone won't be enough. Carbon also needs to be removed from the atmosphere and oceans, through re-/afforestation, through pyrolysis of biowaste with the resulting biochar (and nutrients) returned to the soil and further methods. Even with a rapid transition to clean, renewable energy, with changes to food, land use, construction and waste management, and with removal of large amounts of carbon from the atmosphere and oceans, still more action is needed.


Marine Cloud Brightening is a good idea, while many further methods may first need more surplus clean energy to be available and/or require more R&D.

Whether action will happen successfully and rapidly enough is indeed a good question, but that question shouldn't be used as an excuse to delay such action, since taking such action simply is the right thing to do.

[ image from Climate Emergency Declaration ]
Accordingly, everyone is encouraged to support and share this Climate Emergency Declaration.


Links

• NASA - customized temperature anomaly

• NOAA - Recent Daily Average Mauna Loa CO2
https://gml.noaa.gov/ccgg/trends/monthly.html

• NOAA - Weekly average CO2 at Mauna Loa
https://gml.noaa.gov/ccgg/trends/weekly.html

• NOAA - Climate Prediction Center - ENSO: Recent Evolution, Current Status and Predictions
https://www.cpc.ncep.noaa.gov/products/analysis_monitoring/lanina/enso_evolution-status-fcsts-web.pdf


• Climate Reanalyzer - Daily sea surface temperatures
https://climatereanalyzer.org/clim/sst_daily

• Pre-industrial

• Dire situation gets even more dire

• High sea surface temperature in North Atlantic

• Temperatures rising fast March 2023
https://arctic-news.blogspot.com/2023/04/temperatures-rising-fast-march-2023.html

• Sea surface temperature at record high
https://arctic-news.blogspot.com/2023/03/sea-surface-temperature-at-record-high.html

• IPCC keeps downplaying the danger even as reality strikes

• Transforming Society

• Climate Plan
https://arctic-news.blogspot.com/p/climateplan.html


Saturday, March 18, 2023

Sea surface temperature at record high


As the above image shows, the daily sea surface temperature between 60°South and 60°North reached a record high level on March 31, 2023, i.e. the highest temperature in the NOAA record that started in 1981. 

This record high sea surface temperature comes as we're moving into an El Niño, as illustrated by the image on the right, adapted from NOAA.

Moving from the bottom of a La Niña to the peak of a strong El Niño could make a difference of more than half a degree Celsius, as illustrated by the image below, adapted from NOAA.


Furthermore, sunspots look set to reach a high maximum within years, and the 2022 Tonga submarine volcano eruption did add a huge amount of water vapor to the atmosphere, as discussed in an earlier post

Even more dangerous than high global sea surface temperatures are sea surface temperatures in the North Atlantic, which have been at a record high for the time of year for some time, climbing to well above 20°C on March 29, 2023, as illustrated by the image below.


Vast amounts of heat moves from the North Atlantic into the Arctic. Around this time of year, North Atlantic sea surface temperatures are at their annual low, in line with changes in the seasons. Last year, North Atlantic sea surface temperatures reached a record high of 24.9°C in early September. 


On March 15, 2023, sea surface temperatures off the east coast of North America were as much as 13.8°C or 24.8°F higher than 1981-2011, as illustrated by the above image. Sea surface temperature anomalies are also high in the Pacific, reflecting an upcoming El Niño. All this spells bad news for Arctic sea ice, which typically reaches its lowest extent in September. 


The above Argo float compilation image illustrates the danger that a cold freshwater lid is forming on top of the North Atlantic.

[ Cold freshwater lid on North Atlantic (2020) ]
Stronger winds along the path of the Gulf Stream can at times speed up sea currents that travel underneath this cold freshwater lid over the North Atlantic. As a result, huge amounts of warm, salty water can travel from the Atlantic Ocean toward the Arctic Ocean, abruptly pushing up temperatures and salinity levels at the bottom of the Arctic Ocean.


The above Argo float image illustrates the danger that heat can reach the seafloor. North of Norway, where the water is less than 400 m deep, temperatures higher than 5°C show up throughout the vertical water column, over a period from May 31, 2022, to March 16, 2023. 


The panel on the left of the above image, from an earlier post, shows sea surface temperatures on June 20, 2020, while the panel on the right shows a bathymetry map indicating that the sea in a large part of the Arctic Ocean is very shallow.


The above map shows the thickness of Northern Hemisphere permafrost on land and below the seabed.


The above image describes how methane can escape from the permafrost and the seafloor of the Arctic Ocean. 

The danger of destabilization of methane hydrates is especially large where methane is present in submarine permafrost and seas are shallow, such as the East Siberian Arctic Shelf (ESAS, see image below).

The above image was created with content from a paper by Natalia Shakhova et al., from an earlier post.

[ click on images to enlarge ]
As illustrated by above compilation image, both the volume and extent of Arctic sea ice are low for the time of year. 

With further melting of sea ice and thawing of permafrost, the Arctic Ocean can be expected to receive more heat over the next few years, more heat from direct sunlight, more heat from rivers, more heat from heatwaves and more ocean heat from the Atlantic Ocean and the Pacific Ocean.


The above image illustrates the danger of two tipping points getting crossed, i.e. the Latent Heat Tipping Point and the Seafloor Methane Tipping Point, resulting in rapid destabilization of methane hydrates at the seafloor of the Arctic Ocean leading to explosive eruptions of methane, as its volume increases 160 to 180-fold when leaving the hydrates.

Latent heat loss, feedback #14 on the Feedbacks page

Climate Emergency Declaration


A catastrophe of unimaginable proportions is unfolding. Life is disappearing from Earth and runaway heating could destroy all life. At 5°C heating, most life on Earth will have disappeared. When looking only at near-term human extinction, 3°C will likely suffice.

Meanwhile, current laws punish people for the most trivial things, while leaving the largest crime one can imagine unpunished: planetary omnicide!

Considering this, a Climate Emergency should be declared, supporting action including:
  • Institutionalization of climate deniers until rehabilitated, under national acts such as the U.S. RICO (Racketeer Influenced and Corrupt Organizations) Act and Sherman Antitrust Act.

  • Holding politicians accountable for omnicide (crimes against humanity and ecocide) and bringing them before the International Criminal Court in The Hague, the Netherlands, if they seek to indemnify themselves for their inadequate action on the unfolding climate catastrophe. 

  • Local implementation of action on climate change, with Local People's Courts ensuring that implementation is based on the best-available scientific analysis, to avoid control by politicians who get bought by looters and polluters.


Links

• Climate Reanalyzer - Daily sea surface temperatures
https://climatereanalyzer.org/clim/sst_daily

• NOAA - Climate Prediction Center - ENSO: Recent Evolution, Current Status and Predictions
https://www.cpc.ncep.noaa.gov/products/analysis_monitoring/lanina/enso_evolution-status-fcsts-web.pdf

• Nullschool
https://earth.nullschool.net

• NOAA - Monthly Temperature Anomalies Versus El Niño
https://www.ncei.noaa.gov/access/monitoring/monthly-report/global/202302/supplemental/page-4

• NSIDC - Chartic interactive sea ice graph
https://nsidc.org/arcticseaicenews/charctic-interactive-sea-ice-graph

• Polar Portal

• Argo Float 4903641


• The Threat of Global Warming causing Near-Term Human Extinction