Wednesday, August 16, 2017

Temperature Rise


How much could temperatures rise by 2026? The above image shows how a rise of 10°C (18°F) could occur by the year 2026, based on temperature anomalies from 1750 for February and on progressive growth of warming elements. The image below shows the same rise in another way.


Such a rise could take place even more rapidly, as discussed in the earlier post 10°C or 18°F warmer by 2021? For more on calculating the temperature rise from 1750 to 2016, see this page and this post.


Crucial will be the decline of snow & sea ice and associated feedbacks. Ominously, global sea ice is at a record low at the moment, as illustrated by the graph below by Wipneus.


[ click on images to enlarge ]
Arctic sea ice extent on August 15, 2017, was the 2nd lowest on record for the time of year (behind only 2012), as illustrated by the image on the right.

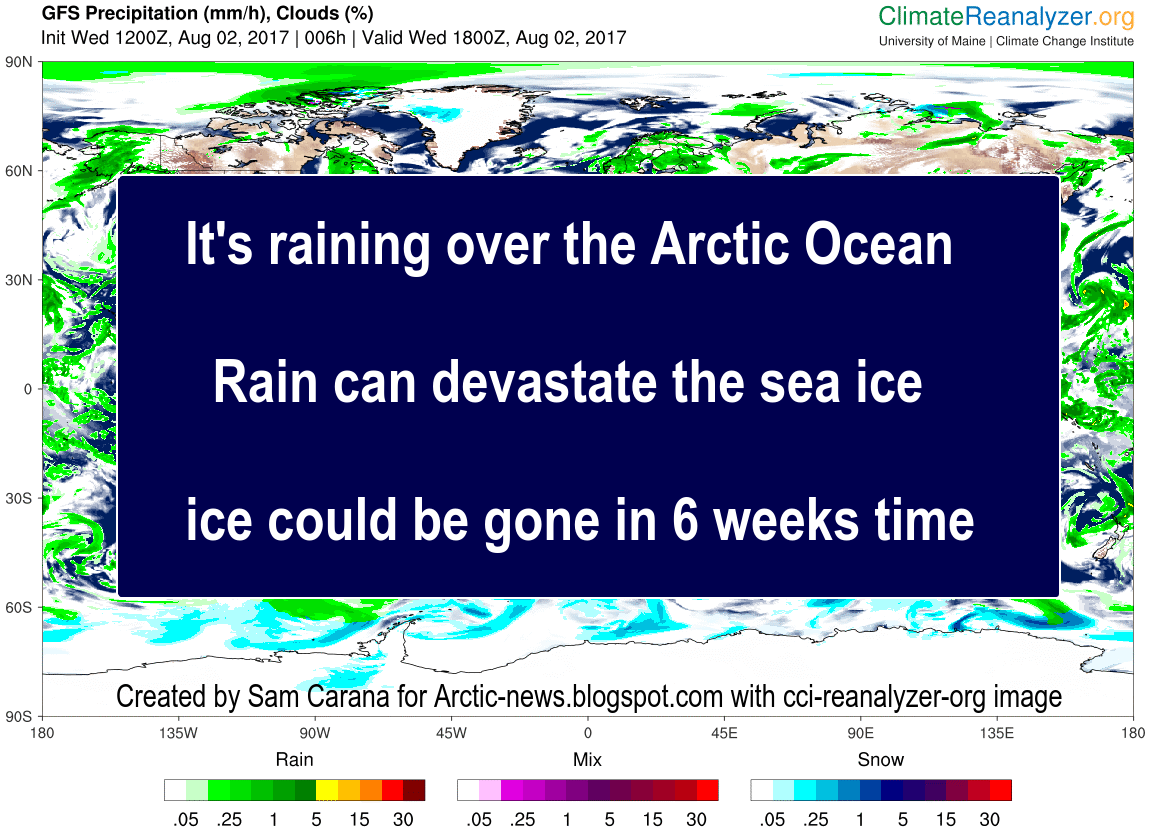
While extent was lower on August 15, 2012, Arctic sea ice is very thin at the moment, as the Arctic Ocean has become warmer, and sea ice could disappear altogether in one month time, as discussed in earlier posts such as this one.

And ominously, July 2017 was the hottest July on record, as illustrated by the image below.


[ click on images to enlarge ]
The July temperature anomaly was particularly high on land on the Southern Hemisphere (1.53°C or 2.75°F, compared to 1901-2000), as illustrated by the image on the right, showing a linear trend over the period 2012-2017.

Above image shows that July 2017 was 2.25°C (4.05°F) warmer than the annual global mean 1980-2015 (seasonal cycle). Only in August 2016 was it warmer (2.29°C), but then again, August 2017 looks set to be warmer than that yet.

The fall in thickness of the sea ice indicates that the buffer has gone that until now has consumed heat entering the Arctic Ocean during the melting season. In the absence of this buffer, where can all this extra heat go? Sea ice will start sealing off much of the surface of the Arctic Ocean by the end of September 2017, making it hard for more heat to escape from the Arctic Ocean by entering the atmosphere.

The Buffer has gone, feedback #14 on the Feedbacks page
The danger is that much of the extra heat will instead reach sediments at the seafloor of the Arctic Ocean that contain huge amounts of methane in currently still frozen hydrates.

[ click on images to enlarge ]
Higher temperatures could destabilize methane hydrates, resulting in huge methane eruptions.

A polynomial trend, based on NOAA July 1983 to January 2017 global monthly mean methane data, points at twice as much methane by 2034, as the image on the right shows. Stronger methane releases from the seafloor could make such a doubling occur even earlier. Over the next decade, methane will cause more warming than CO₂  twice as much methane will cause more than twice as much warming.

Methane reached peaks as high as 2881 ppb at 479 mb on August 18, 2017, as the combination image below shows (left panel, top left corner).
[ click on images to enlarge ]
The image doesn't specify the origin of the peak, but when levels are that much above the mean, the likely cause is either wildfires or clathrate destabilization. As the image in the right panel shows, methane levels at 280 mb were also very high over the Arctic Ocean north of Canada in the morning that day, which is unusual at such an altitude.

The image below shows that mean global methane reached a level of 1881 ppb at 280 mb (MetOp-1, am) on August 15, 2017.


The situation is dire and calls for comprehensive and effective action, as described at the Climate Plan.


Links

• Climate Plan
https://arctic-news.blogspot.com/p/climateplan.html

• Extinction
https://arctic-news.blogspot.com/p/extinction.html

• Temperature rise from 1750 to 2016
https://arctic-news.blogspot.com/p/temperature.html

• How much warming have humans caused?
https://arctic-news.blogspot.com/2016/05/how-much-warming-have-humans-caused.html

• Feedbacks
https://arctic-news.blogspot.com/p/feedbacks.html

• How much warming have humans caused?
https://arctic-news.blogspot.com/2016/05/how-much-warming-have-humans-caused.html

• 10°C or 18°F warmer by 2021?
https://arctic-news.blogspot.com/2017/04/10c-or-18f-warmer-by-2021.html

• Arctic Sea Ice Break Up August 2017
https://arctic-news.blogspot.com/2017/08/arctic-sea-ice-break-up-august-2017.html


Monday, August 14, 2017

Arctic Sea Ice Break Up August 2017

Sun at 8:00 am, captured by Jim Reeve on August 7, 2017 near Sechelt AirPort, B.C., Canada
Arctic sea ice is under attack from all sides.  At this time of year, the sun doesn't set at the higher latitudes.

As the image below shows, it was as hot as 94°F or 34.5°C in North Canada on August 13, 2017 (at the green circle, at 1000 hPa, at 00:00 UTC). Temperatures at surface level were as high as 33.1°C or 91.5°F at that location, where wind was coming from the south and blowing toward the north at a speed of 28 km/h or 17 mph at that time.


Above image shows cyclonic winds over the Arctic Ocean pulling warm air from North Canada over the Arctic Ocean, while pushing cold air out. Winds and rain have been battering the sea ice for some time now, as discussed in an earlier post.

Fires are becoming more devastating, as discussed in an earlier post. The August 2, 2017, satellite image below shows smoke from fires in British Columbia blanketing Vancouver and Seattle. Carbon dioxide (CO₂) levels were as high as 527 ppm, carbon monoxide (CO) levels as high as 12.59 ppm and sulfur dioxide (SO₂) levels as high as 490.77 µg/m³, as these images show.  


The combination image below shows forecasts for August 8, 2017, 13:30 UTC. CO levels were forecast to be as high as 29.05 ppm, CO₂ levels as high as 625 ppm and SO₂ levels as high as 1089.65 µg/m³ (each time at the green circle). Also note the emissions from forest fires in Siberia.


Actual levels were even higher at that spot on August 11, 2017, when CO was as high as 30.97 ppm, CO₂ was as high as 633 ppm and SO₂ was as high as 1150.19 µg/m³, as illustrated by the image below.

[ click on images to enlarge ]
The image below, by Harold Hensel, shows smoke over British Columbia, Washington, and Montana on August 9, 2017.


Winds can carry smoke from forest fires over long distances, all the way to the Arctic sea ice, where the soot can settle and darken the ice, thus speeding up its decline. The image below, also by Harold Hensel, shows smoke from fires in Russia entering the Arctic Ocean near the Laptev Sea on August 9, 2017. 


The image below shows the situation on August 14, 2017.


Canadian wildfires caused PM10 to reach levels as high as 11,599 μg/m³ on August 16, 2017, at the location marked by the green circle. The image below shows PM10 getting blown over the Arctic Ocean.


The thickest sea ice in the Arctic Ocean is located close to the north of Greenland and the Canadian Archipelago. This ice is now breaking up, due to high temperatures and strong cyclonic winds that cause warm rain, high waves and strong sea currents.

Watch the thickest sea ice break up on the animation below. This is a 17 MB file, so it may take some time to fully load. Click here if you do not see the file appear below.

Wednesday, August 2, 2017

Arctic sea ice may well be gone by September 2017

The Arctic Ocean is warming up fast and this is melting the sea ice from below.

Sea surface temperature anomalies are well above 8°C (14.4°F) in several parts of the Arctic Ocean.

The image on the right shows sea surface temperature anomalies from 1961-1990 for the Arctic (60°N - 90°N) on August 2, 2017.

Global sea ice extent is at a record low for the time of the year, as illustrated by the graph below, by Wipneus. Lower sea ice extent means that less sunlight is reflected back into space.


Arctic sea ice extent in 2017 is shrinking along a path that currently looks similar to the years 2012, 2016 and 2007, when sea ice reached 1st, 2nd and 3rd place, respectively, regarding lowest extent (image right).

Arctic sea ice volume has been at record low since the start of 2017 and is currently similar to 2012, as illustrated by the graph below right, by Wipneus (click on images to enlarge them).

Arctic sea ice may look to be similar to what it was in 2012, when extent and volume reached lowest since satellite measurements began.

However, sea ice thickness has fallen dramatically over the years in the areas where previously was the thickest ice.

This is illustrated by the combination image below, showing Arctic sea ice thickness (in m) in July 31, 2012 (left panel) versus thickness on July 31, 2017 (right panel).

[ click to enlarge ]
The navy.mil animation on the right shows sea ice getting thinner recently, with especially the thicker sea ice disappearing fast.

There appear to be discrepancies between the PIOMASS calculation of ice volume and the ice thickness images by navy.mil.
This may be due to the way volume is calculated and may be similar to differences in extent and area.

Sea ice clearly has disappeared most where once the thickest ice was present.


Harold Hensel points out that extent may at first glance show more ice but each cell in a grid may only have 15% of ice present to be labeled 'ice-covered'. Harold adds an image showing ice concentration, which gives another insight in the shape and condition of the sea ice (above image).

Paul Beckwith and Patrick McNulty bluntly conclude that PIOMAS is wrong, as illustrated by the Twitter screenshot on the right.

Clearly, dramatic shrinking of the thicker sea ice has occurred over the past few years and one of the reasons for this is the ever warmer water that is getting pushed into the Arctic Ocean along the Gulf Stream. This is melting the sea ice from below. Warming of the Arctic Ocean heats up the air over the Arctic Ocean, as illustrated by the image below.


[ click on image to enlarge ]
The above image shows a 365-day surface temperature anomaly. The change over time is also illustrated by the animation on the right.

On average, surface temperatures over the Arctic Ocean have been more than 2.5°C (or 4.5°F) warmer than in 1981-2010. The warmer air is now also melting the sea ice from above, as temperatures over the Arctic have risen to well above the freezing point.

High temperatures over the Arctic Ocean means that precipitation no longer takes the form of snow, but instead falls in the form of rain.


Below is a further warning, against a more recent background image (situation on August 6, 2017).


[ click on image to enlarge ]
High temperatures of the surface of the ocean combined with strong winds makes that a lot of moisture is rising from the sea surface to the atmosphere.

The image on the right shows that sea surface temperatures in the Bering Strait were as high as 19°C (or 66.2°F) on July 22, 2017. This is partly the result of warm water from rivers entering the Bering Strait.

Furthermore, cyclones can make winds reach high speeds, as illustrated by the image below, showing Typhoon Noru approaching Japan.

The image shows a forecast for August 5, 2017, 18:00 UTC. Waves have been forecast to be as high as 16.15 m or 53 ft, while winds have been forecast to be as fast as 214 km/h or 133 mph or 116 kn.

[ click on image to enlarge ]
Total precipitable water has been forecast to be as much as 91.000 kg/m² and 3-hr Precipitation Accumulation has been forecast to be as much as 281.3 mm (or 281.3 kg/m²) or 11.07 in.

Back to the Arctic, where strong winds and moist air combine to make a lot of rain, as temperatures are well above freezing in most areas, as illustrated by the image on the right (showing air temperature at 2 m).

The image below shows how strong winds are pushing warm and moist air through the Bering Strait on July 31, 2017 at surface level (left), at 700 hPa (center) and at 250 hPa (right), where the jet stream used to separate the cold air in the Arctic from the warmer air further south.


As above image also shows, the jet stream is getting more and more out of shape, at places crossing the Arctic Ocean. In the video below, Paul Beckwith discusses the situation in the Arctic.


The image below shows trends for both Arctic and Antarctic sea ice area pointing downward.


When looking at sea ice volume, zero sea ice in September 2017 is within the margins of the trendline below on the right.

[ Arctic sea ice, gone by Sept. 2017? ]
Given the speed at which many feedbacks can kick in and the interaction between warming elements, Arctic sea ice volume may well be gone by September 2017.

The low sea ice volume means that there is very little sea ice left to act as a buffer this year. Therefore, a huge amount of heat will not be able to be consumed this year in the process of melting ice and will instead speed up warming of water of the Arctic Ocean.

Less sea ice additionally means that less sunlight will be reflected back into space, and this heat will instead further speed up Arctic warming.

The Buffer has gone, feedback #14 on the Feedbacks page

Where can all this extra heat go? Sea ice is expected to start sealing off much of the surface of the Arctic Ocean by the end of September 2017, which will make it harder for heat to escape the Arctic Ocean by entering the atmosphere.

The danger is that much of the extra heat will instead reach sediments at the seafloor of the Arctic Ocean that contain huge amounts of methane in currently still frozen hydrates.

The image on the right shows that methane reached levels as high as 2583 ppb on July 31, 2017.

The image also shows high methane levels over Antarctica where hydrate destabilization also appears to be taking place, as discussed in an earlier post.

The situation is dire and calls for comprehensive and effective action, as described at the Climate Plan.


Links

• Climate Plan
https://arctic-news.blogspot.com/p/climateplan.html

• 10°C or 18°F warmer by 2021?
https://arctic-news.blogspot.com/2017/04/10c-or-18f-warmer-by-2021.html

• Abrupt Warming - How Much And How Fast?
https://arctic-news.blogspot.com/2017/05/abrupt-warming-how-much-and-how-fast.html

• Accelerating growth in CO₂ levels in the atmosphere
https://arctic-news.blogspot.com/2017/02/accelerating-growth-in-co2-levels-in-the-atmosphere.html

• Feedbacks
https://arctic-news.blogspot.com/p/feedbacks.html

• Extinction
https://arctic-news.blogspot.com/p/extinction.html

• Methane Erupting From Arctic Ocean Seafloor
https://arctic-news.blogspot.com/2017/03/methane-erupting-from-arctic-ocean-seafloor.html

• Warning of mass extinction of species, including humans, within one decade
https://arctic-news.blogspot.com/2017/02/warning-of-mass-extinction-of-species-including-humans-within-one-decade.html