 |
| [ click on image to enlarge ] |
July 2015 was the warmest month ever recorded for the globe. The combined average temperature over global land and ocean surfaces for July was the all-time highest monthly temperature in the 1880-2015 record – it was 16.61°C (61.86°F), i.e. 0.81°C (1.46°F) above the 20th century average.
Sea surfaces were very warm as well, in particular the North Pacific, which on August 22, 2015, was exactly 1°C (1.8°F) warmer than it was compared to the period from 1971 to 2000 (see Climate Reanalyzer image right).
The July globally-averaged sea surface temperature was the highest temperature for any month in the 1880-2015 record. In July 2015, the sea surface on the Northern Hemisphere was 0.87°C (1.57°F) warmer than it was in the 20th century, as illustrated by the NOAA graph below.
The July globally-averaged sea surface temperature was the highest temperature for any month in the 1880-2015 record. In July 2015, the sea surface on the Northern Hemisphere was 0.87°C (1.57°F) warmer than it was in the 20th century, as illustrated by the NOAA graph below.

As the image below shows, the July data for sea surface temperature anomalies on the Northern Hemisphere contain a trendline pointing at a rise of 2°C (3.6°F) before the year 2030. In other words, if this trend continues, the sea surface will be 2°C (3.6°F) warmer in less than 15 years time from now.
 |
| [ click on image to enlarge ] |
As illustrated by the image below, high methane levels are already showing up over the Arctic.
 |
| Methane levels as high as 2565 parts per billion were recorded on August 18, 2015 |
 |
| [ click on image to enlarge ] |
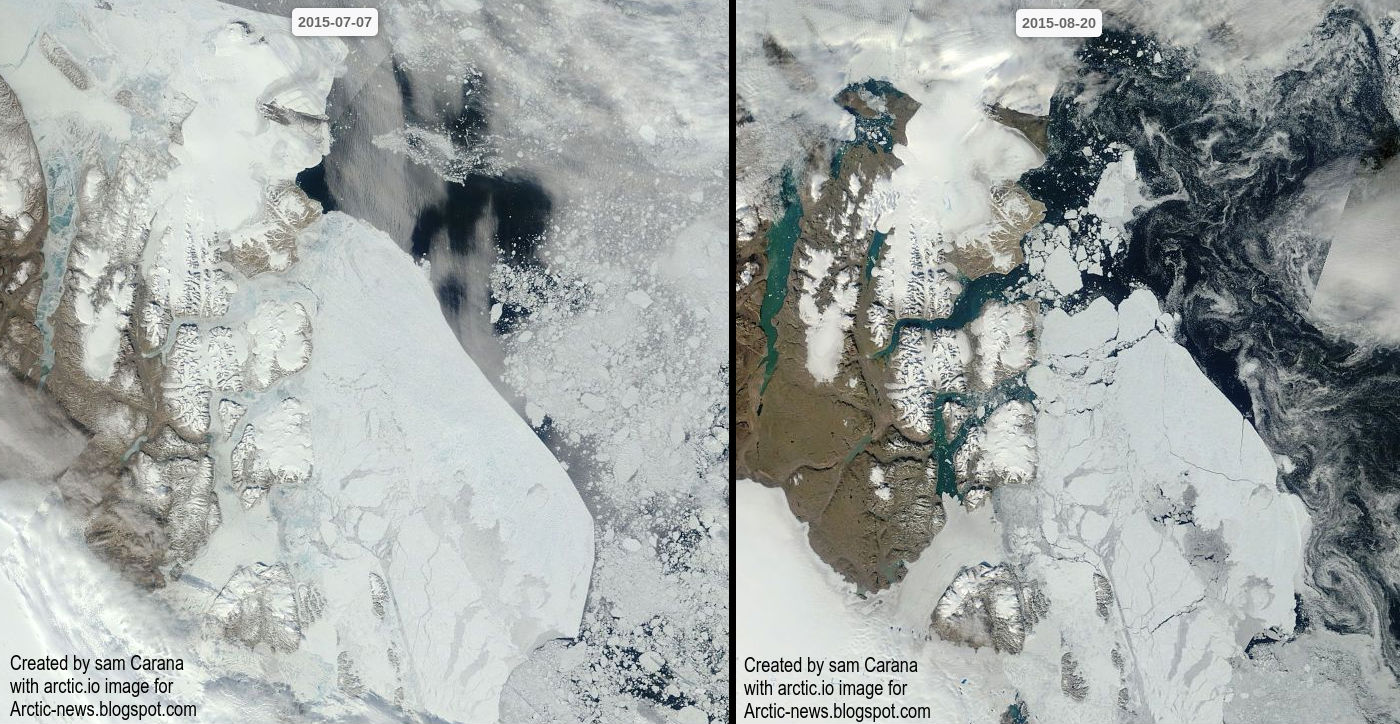
The situation today is even worse than one might conclude when looking at sea ice extent alone. Thick sea ice is virtually absent compared to the situation in the year 2012 around this time of year, as illustrated by the image below that compares sea ice thickness on August 20, 2012 (left) with August 20, 2015 (right).

The comparison below further illustrates this. The left panel shows how thick sea ice is anchored to the north-east tip of Greenland on July 7, 2015. The right panel shows how, on August 20, 2015, this ice has been fractured and shattered into pieces. All this ice looks set to soon flow down Fram Strait and melt away in ever warmer water.
The image below shows sea surface temperature anomalies on August 21, 2015.

On the image below, the green circle at the top of each globe indicates a location where sea surface temperature was 17°C (62.6°F) on August 21, 2015, an anomaly of 11.9°C (21.4°F). This is where warm water is entering the Arctic Ocean from the Atlantic Ocean. At the same time, warm water is entering the Arctic ocean through the Bering Strait from the Pacific Ocean.
There still are a few weeks to go before sea ice can be expected to reach its minimum, at around half September 2015, while sea currents will continue to carry warmer water into the Arctic Ocean for months to come. More open water increases the chance that storms will develop that will push the last remnants of the sea ice out of the Arctic Ocean, as discussed in earlier posts such as this one, while storms can also mix warm surface waters all the way down to the seafloor, as discussed in this earlier post.
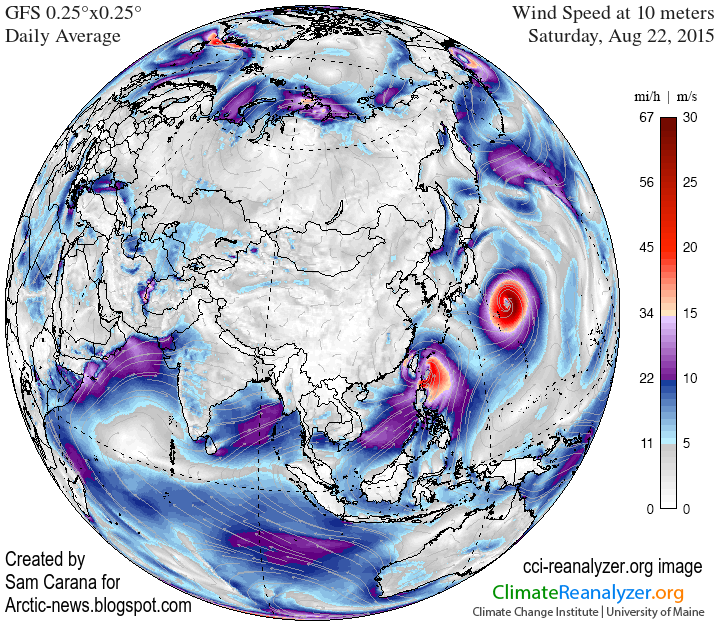
Typhoons increase this danger. The Climate Reanalyzer image below shows typhoons in the Pacific.

Typhoons developing in the Pacific Ocean are getting stronger as the oceans warm. One of the typhoons visible on above map, Typhoon Goni, has just claimed ten lives in the Philippines.
Stronger typhoons come with an increased chance that they will bring strong winds and warm air and water into the Arctic.
Typhoon Goni and the larger Typhoon Atsani are both moving north and look set to move into the direction of the Arctic Ocean, as illustrated by the forecast for the situation on August 26, 2015, on the right.
Atsani was the twelfth typhoon and sixth super typhoon of the year in the western North Pacific—numbers that meteorologists say put the season on a record-breaking track. The NASA image below gives an idea of the size of Typhoon Atsani.
 |
| [ click on image to enlarge ] |
Typhoons increase this danger. The Climate Reanalyzer image below shows typhoons in the Pacific.
 |
| [ click on image to enlarge ] |
Stronger typhoons come with an increased chance that they will bring strong winds and warm air and water into the Arctic.
Typhoon Goni and the larger Typhoon Atsani are both moving north and look set to move into the direction of the Arctic Ocean, as illustrated by the forecast for the situation on August 26, 2015, on the right.
Atsani was the twelfth typhoon and sixth super typhoon of the year in the western North Pacific—numbers that meteorologists say put the season on a record-breaking track. The NASA image below gives an idea of the size of Typhoon Atsani.
 |
| [ Typhoon Atsani - NASA image ] |
The situation is dire and calls for comprehensive and effective action, as discussed in the Climate Plan.
July data for sea surface temperature anomalies on the Northern Hemisphere contain a trendline pointing at a rise of 2°C...
Posted by Sam Carana on Friday, August 21, 2015
1 comment:
Sadly, I had a feeling, .This is so sad, So many people are ignoring this, and we're running out of time, Thank you for your incredible work, and sharing
Post a Comment