Thursday, September 19, 2013

Is the North Pole now ice-free?

Is the North Pole now ice-free? It could well be that, by the time you read this, there will be no ice left at all at the North Pole. The image below, created by Sam Carana from a nowcast from the Naval Research Laboratory, run on September 17, 2013 and valid for September 18, 2013, shows open water extending all the way to a spot very close to the North Pole.


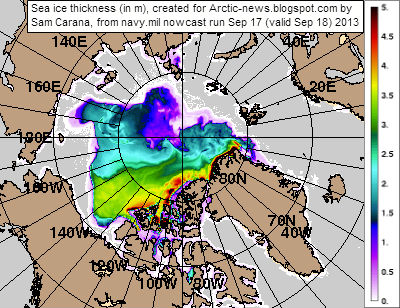
As the color indicates, sea ice thickness in this area is virtually zero (i.e. ice-free). This development of an ice-free area at the North Pole has been discussed in earlier posts such as:
  • Arctic sea ice thickness falls by 2m in 21 days in some areas (June 13, 2013)
  • Open Water In Areas Around North Pole (June 22, 2013), describing areas around the North Pole where sea ice thickness had fallen to virtually zero, i.e. open water. 
  • Open Water at North Pole (July 22, 2013), descibing a wide corridor that had developed with very thin ice between the North Pole and Siberia. The post added that surface water on top of this thin ice could extend along this corridor, all the way from the North Pole to edge of the ice, in which case the surface water effectively becomes part of open water.
  • North Hole (September 2, 2013), describing areas close to the North Pole where ice volume had fallen to virtually zero, while pointing at how devastating the impact of sea surface temperature anomalies can be. 
This sea ice thinning in areas close to the North Pole has been one of the most important developments in 2013. Yet, many people keep watching sea ice extent.

Why was Arctic sea ice not smaller in extent in 2013 than in 2012?

The comparison below shows both volume and the extent of the sea ice for the same day in 2013 (left), respectively 2012 (right). Natural variability can make Arctic sea ice slightly smaller or larger than projected. There are many factors that influence things from year to year, such as weather conditions, sea currents and temperatures of the water in the Atlantic and Pacific Oceans; some factors are discussed in more detail below.


The above comparison shows a lot more ice north of Alaska in 2013 (above left) than in 2012 (above right). The comparison below shows that salinity levels in the Beaufort Sea were lower in 2013 (below left) than in 2012 (below right).


Seawater typically has a salinity level of over 3%; it freezes at about −2°C (28°F). Where mixing occurs with fresh water runoff from melting glaciers and permafrost, the water in the Arctic Ocean can become substantially less saline. Other substances added to the water, such as sand, can also cause a freezing point drop. The freezing and melting point of fresh water (i.e. zero salinity) is 0°C (or 32°F).  Less salinity means the water will remain frozen until the temperature reaches levels closer to 0°C.

Thinning continues

Heatwave conditions in Alaska caused greater melting of the permafrost. The result was more fresh water run-off through the MacKenzie River into the Beaufort Sea. This has contributed to keep sea ice extent larger in 2013. Yet, the warm water has also contributed to further thinning of the ice, reinforcing warnings that the sea ice looks set to disappear altogether within years. 


As illustrated by the above image by Neven, from the Arctic Sea Ice blog, average Arctic sea ice thickness (crudely calculated by dividing PIOMAS (PI) volume numbers with Cryosphere Today (CT) sea ice area numbers) has been very low in 2013.

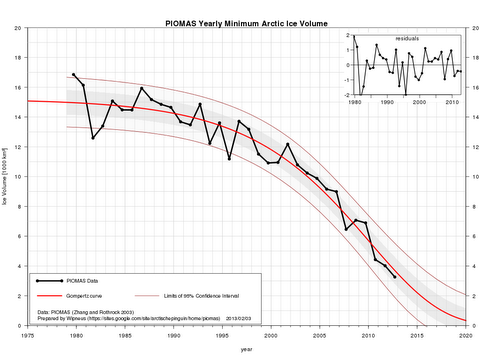
The image below shows that annual minimum volumes appear to follow an exponential trend downward to zero, firstly reached in September 2015, followed by zero ice in the surrounding months over subsequent years.

Some people have objected against using PIOMAS data for such projections, with arguments ranging from suggestions that PIOMAS data were not reliable, that natural variability could prove such projections to be wrong, to questioning whether an exponential trend was appropriate. Nonetheless, it seems that over the years arguments in favor of an exponential trend have only become stronger:
  • Further measurements such as by CryoSat have confirmed that the PIOMAS data are indeed reliable and that the sea ice decline may well be even more dramatic. 
  • Natural variability goes both ways, it can either speed up or slow down ice melt. Had there been less runoff from the MacKenzie River, the sea ice in 2013 may not have been able to refreeze after being hit by cyclones several times. Next year we may not be so lucky and sea ice could disappear altogether, due to natural variability.  
  • Thick ice along the northern coast of Greenland is indeeed more persistent because of on-shore winds that cause the ice to drift and pile-up there. This would favor a Gompertz (or Sigmoid) trend in extrapolations (see image on the right). However, the new development of an ice-free North Pole shows that the sea ice is capable of breaking up abruptly, not only from the outer edges toward Greenland, but also starting at the North Pole and even moving from there toward Greenland. Moreover, as the 30-day animation below shows, thick sea ice north of Greenland can thin very quickly, suggesting it could well disappear altogether within one season.  


Sea ice can thin rapidly, even when it is multiple meters thick 

Earlier in 2013, much warm water entered the Arctic Ocean from the mouths of rivers, as discussed in the post Arctic Ocean is turning red. As said, this resulted in lower salinity levels in the Beaufort Sea that prevented cyclones from demolishing the sea ice altogether. Nonetheless, the joint impact of cyclones and warm water does appear to have caused rapid decline of the thick ice north of Greenland and Canada, as earlier discussed in an earlier post

Furthermore, sea surface temperatures have been recorded close to Svalbard that are far higher than even in the waters closer to the Atlantic Ocean. This phenomenon is illustrated by the image below, showing sea surface temperatures (top) and sea surface temperature anomalies (underneath). 


In some of these spots, sea surface temperatures are well over 10°C (50°F). Where does this heat come from? 

These hot spots could be caused by undersea volcanic activity; this is the more dangerous as the area has seen methane bubbling up from hydrates that have become destabilized; such dangers have been discussed repeatedly, e.g. in the post Runaway Global Warming. Hot spots can also contribute to even more dramatic thinning of the sea ice, including the thickest parts. 

In conclusion, there is no reason to assume that the sea ice in the Arctic will somehow magically recover. Instead, there are many indications that exponential decline of Arctic sea ice will continue. Less salinity may have temporarily prolonged the extent of the sea ice in some areas, but as sea surface temperatures keep rising, the ever thinner ice looks set to collapse within years, with dire consequences. This calls for comprehensive and effective action, such as described at the ClimatePlan blog.  


Related posts

- Arctic sea ice thickness falls by 2m in 21 days in some areas
Arctic-news.blogspot.com/2013/06/arctic-sea-ice-thickness-falls-by-2m-in-21-days-in-some-areas.html

- Open Water In Areas Around North Pole
Arctic-news.blogspot.com/2013/06/open-water-in-areas-around-north-pole.html

- Open Water at North Pole
Arctic-news.blogspot.com/2013/07/open-water-at-north-pole.html

- North Hole
Arctic-news.blogspot.com/2013/09/north-hole.html

- CryoSat - New Dimensions on Ice
esa.int/Our_Activities/Observing_the_Earth/Living_Planet_Symposium_2013/New_dimensions_on_ice

- Arctic Ocean is turning red
Arctic-news.blogspot.com/2013/08/arctic-ocean-is-turning-red.html

- Cyclone raging on thin ice
Arctic-news.blogspot.com/2013/08/cyclone-raging-on-thin-ice.html

- Runaway Global Warming
Geo-engineering.blogspot.com/2011/04/runaway-global-warming.html

- Climate Plan
ClimatePlan.blogspot.com

Monday, September 16, 2013

Is climate change already dangerous?

by David Spratt

Download PDF 
(23 pages)
In a compelling survey, this report answers the question many are afraid to ask: is climate change already dangerous?

This science survey measures the current manifestations and impacts of climate change against the "safe boundaries" metric; surveys the literature on tipping points and non-linear climate events; and provides a detail study of significant recent events in the Arctic.

Three big questions are asked and answered:
  • Is climate change dangerous for just the current increase in global temperature?
  • Is climate change dangerous for the further increases in temperature already implied by the current level of greenhouse gases?
  • By looking at events in climate history where greenhouse gas levels were similar to today, can further light be shone on the "already dangerous" question?
The answers are both shocking, and necessary, if climate policy-making is to escape the delusional paradigm within which it is stuck.

In a concluding section, this report argues that with clear evidence that climate change is already dangerous, we are in an emergency and face "…an unavoidably radical future". And we know from past experience that societies, once in emergency mode, are capable of facing up to and solving seemingly impossible problems.


This post was originally published at:

Sunday, September 15, 2013

Colorado flooding, what does the IPCC say?

Flooding in Colorado has caused at least five death. As of 14 September, more than 500 were unaccounted for. Nearly 19,000 homes are damaged or destroyed.

Paul Beckwith comments:

Total destruction. Roads. Homes. Power lines. Water pipelines. Sewer culverts and pipes. And an oil pipeline. Not to mention the lives lost and disrupted forever.

Just be glad that the oil pipeline was not something like Keystone XL or Line 9 or Line 6.

Wake up people. Isn't it ironic that extreme weather events are accelerating in frequency, magnitude, spatial extent, and duration and are due to the very abrupt climate change that is being rapidly worsened from fossil fuel emissions; from burning the very stuff that is carried by the oil pipeline infrastructure.

And politicians are either very stupid or simply slaves to the fossil fuel companies since they ignore all laws protecting the environment, and even rewrite the legal system to eliminate any laws that slow or prevent pipelines, tar sands, fracking and any other fossil fuel infrastructure from being built. While publishing outright lies slamming renewable energy.

No wonder police forces across the world are becoming branches of the military; they realize that the public will soon be furious at the politicians and corporations and government corruption at all levels.

Meanwhile, according to the dailymail leaked IPCC reports say that "Global warming is just HALF what we said". So, what's going on? For starters, it appears that the IPCC has been fooled into ignoring the dangerous situation in the Arctic, i.e. albedo changes, methane and further feedbacks. The cartoon below illustrates this, please comment and share widely! 


Methane Release caused by Earthquakes


Methane hydrates can become destabilized due to changes in temperature or pressure, as a result of earthquakes and shockwaves accompanying them, severe storms, volcanic activity, coastal collapse and landslides. As an example, an earthquake followed by methane release was discussed in the post Sea of Okhotsk a few months back. Such events can be both primed and triggered by global warming, particularly in the Arctic, as follows:
  • As more ice melts away on Greenland and more water runs off into the sea, there is less weight on the Earth’s crust under Greenland. The crust and mantle can bounce back during a large melt, an effect that is called 'isostatic rebound'. This rebound can not only trigger earthquakes and landslides, it can also suck up the magma in the Earth’s crust to the surface and trigger volcanic eruptions.
  • The added weight of water from melting glaciers stresses the Earth’s crust underneath the sea, which can cause earthquakes. This is especially the case for coastal waters, where the impact of the water that flows into the sea is huge, not only in terms of weight, but also in terms of the currents they cause. 
  • As the permafrost melts, mountain ranges, soil and submarine sediments all become less robust. Where the permafrost previously held things together, we can now expect more coastal collapse, avalanches and landslides, which can send shockwaves through the sea that in turn trigger earthquakes and hydrate destabilization.
  • Methane hydrates that are on the edge of stabilization can be disturbed by global warming in two additional ways, temperature and pressure: Warming of the Earth's crust as heat penetrates sediments on the seafloor. Thermal expansion of the Earth's crust means that the crust will expand slightly in volume, resulting in expansion of the cavity that holds the hydrates. 
  • Finally, there's the additional impact of methane itself. Permafrost previously kept methane stable in sediments. Methane converting from hydrates into free gas will expand some 160 times in volume; this explosive process can trigger further destabilization. Once released into the atmosphere, the methane has a huge local warming potential, adding to the threat that further methane releases will occur locally.   


Back in 2006, Bill McGuire said: "A particular worry is that this in turn will contribute to large-scale releases of methane gas from the solid gas hydrate deposits that are trapped in marine sediments. Gas hydrates have been identified around the margins of all the ocean basins, and outbursts of gas may occur as sea temperatures climb or as rising sea levels trigger underwater quakes in the vicinity."

For more than a decade, Malcolm Light, contributor to the Arctic-news blog, has been warning about the danger of methane hydrate destabilization due to earthquakes (see the poster at the bottom of the page on seismic activity).

With this in mind, let's take a look at the most recent picture of Earth.

September 13, 2013, 3am - Sep 14, 2013 1am    [ click on image to enlarge ]

The large number of yellow spots in the top left corner are related to the flooding in the Basin of the Amur River (Heilong Jiang). Such extreme weather events are becoming ever more prominent, due to global warming and the feedbacks such as methane releases. Similarly, extreme weather events such as droughts and heatwaves lead to wildfires that also produce large amounts of methane.

The image only shows the Northern Hemisphere, but on the Southern Hemisphere, high levels of methane have been recorded for a long time on Antarctica. While huge amounts of snow fall on Antartica, the amount of snow and ice that melts each year is even larger, widening the difference between the weight the snow and ice exercize between periods. This difference in weight could similarly cause rebounds of the Earth's crust, sucking up the magma and causing methane hydrates to be destabilized, as described in the earlier post Antarctic methane peaks at 2249 ppb.

The image also shows fault lines. Several yellow spots are present on the fault line over the Arctic, including some that point at the coast of Norway; they appear to be caused by seismic activity along the fault line, as discussed in the recent post Methane reaches 2571 ppb.

Meanwhile, methane readings peaked at 2416 ppb on September 14, 2013. Very worrying are also the high methane readings close to the Gakkel Ridge, the fault line at the center of the Arctic Ocean, and the spots closer to the Laptev Sea.

Finally, there are high readings along the Aleutian Islands, Alaska. The islands, with their 57 volcanoes, are in the northern part of the Pacific Ring of Fire and they have experienced a lot of seismic activity lately, including an earthquake with a magnitude of 7 on the Richter scale on August 30, 2013, and several more recent earthquakes with a higher magnitude than 6 on the Richter scale.

[Editor: The images below, added September 24 and 26, 2013, show high methane releases at a spot just north of Greenland that was hit by an earthquake with a magnitude of 4.5 on the Richter scale on September 1, 2013, as also discussed in the post Methane reaches 2571 ppb. The two bottom images also show the magnitude 5 earthquake that hit Russia on September 24, 2013.]

September 20, 2013, 11am - Sep 22, 2013 3pm    [ click on image to enlarge ]

Sept. 25, 2013 am - the orange spot just north of Greenland indicates a recent earthquake [ click on image to enlarge ]

Map specifying details of two recent earthquakes. Size of spots indicating earthquakes on the map is relative. [ click image to enlarge ]

References and related posts

- Climate Change: Tearing the Earth Apart, by Bill McGuire (2006)

- Seismic activity, by Malcolm Light and Sam Carana (2011)
Arctic-news.blogspot.com/p/seismic-activity.html

- Thermal expansion of the Earth's crust necessitates geoengineering (2011)
Arctic-news.blogspot.com/p/thermal-expansion.html

- Runaway Warming (2011)
Arctic-news.blogspot.com/p/runaway-warming.html

- Methane reaches 2571 ppb (2013)

- Sea of Okhotsk (2013)

- Is Global Warming breaking up the Integrity of the Permafrost? (2013)

- Antarctic methane peaks at 2249 ppb (2013)