A video featuring Paul Beckwith, climate scientist at University of Ottawa, who gives an update on the state of climate change, October 2012.
Paul adds that it was off the cuff and unscripted. "I wandered by Parliament Hill to see the people who were doing a climate change fast and ended up talking about the Arctic with them."
Paleogeographic reconstruction of the Early Triassic world (Smithian substage) around 250 million years ago, with
a ‘dead zone’ in the tropics. Presence of marine reptiles (ichthyosaurs), terrestrial tetrapods and fish was almost exclusively in higher latitudes (>30 °N and >40 °S) with rare exceptions. Credit: Yadong Sun, University of Leeds
The end-Permian mass extinction, which occurred around 250 million years ago, wiped out nearly all the world's species. Typically, a mass extinction is followed by a 'dead zone' during which new species are not seen for tens of thousands of years. In this case, the dead zone, during the Early Triassic period which followed, lasted for five million years.
A study jointly led by the University of Leeds and China University of Geosciences (Wuhan), in collaboration with the University of Erlangen-Nurnburg (Germany), shows the cause of this lengthy devastation was a temperature rise to lethal levels in the tropics: around 50-60°C (122-140°F) on land, and 40°C (104°F) at the sea-surface.
Lead author Yadong Sun, who is based in Leeds while completing a joint PhD in geology, says: “Global warming has long been linked to the end-Permian mass extinction, but this study is the first to show extreme temperatures kept life from re-starting in Equatorial latitudes for millions of years.”
The dead zone would have been a strange world – very wet in the tropics but with almost nothing growing. No forests grew, only shrubs and ferns. No fish or marine reptiles were to be found in the tropics, only shellfish, and virtually no land animals existed because their high metabolic rate made it impossible to deal with the extreme temperatures. Only the polar regions provided a refuge from the baking heat.
Before the end-Permian mass extinction the Earth had teemed with plants and animals including primitive reptiles and amphibians, and a wide variety of sea creatures including coral and sea lillies.
This broken world scenario was caused by a breakdown in global carbon cycling. In normal circumstances, plants help regulate temperature by absorbing carbon dioxide and burying it as dead plant matter. Without plants, levels of carbon dioxide can rise unchecked, which causes temperatures to increase.
Professor Paul Wignall from the School of Earth and Environment at the University of Leeds, one of the study's co-authors, said: “Nobody has ever dared say that past climates attained these levels of heat. Hopefully future global warming won't get anywhere near temperatures of 250 million years ago, but if it does we have shown that it may take millions of years to recover.”
Paul Beckwith, B.Eng, M.Sc. (Physics), Ph.D. student (Climatology) and Part-time Professor, University of Ottawa
by Paul Beckwith
Is death by lead worse than death by climate? That depends on your perspective. If you are the person dying then death by climate most likely means death by starvation. Or by dehydration. Or by painful vomiting and diarrhea from drinking contaminated water. It seems to me that this slow, painful death by climate would be much worse than catching a lead projectile from afar most likely with little or no warning.
If you are a journalist then penning death by lead stories allows you to write things that appeal to the visceral; namely to write about human conflict between “good” and “evil” and showing vivid images. People seem to innately enjoy reading about the competition of war or battle or insurgency and be able to cheer for a victor. To arms suppliers, it allows them to increase their profit margins. In addition, it allows politicians to have a rallying patriotic cry about the responsibility of their respective country to exercise some muscle with the pretense that they actually care about the well-being people being killed in another far off country. Or say that it is necessary to restore or create some democracy in such a country while ignoring the loss of democracy in their own country. Clearly hypocrisy. Almost inevitably armed intervention leads to a magnification of death and destruction.
How can western politicians, backed by an incredibly supportive and unquestioning main stream media and catering to the interests of large corporations make so much rah-rah about 20,000 people that have experienced death by lead in an internal conflict in one specific year in some other country while completely ignoring the deaths, every single year of 400,000 people?
That is the number of people, mostly children that are dying each year from climate change and carbon economies according to the DARA study that was released September 27th. Somehow this has been ignored up to now. However what politicians cannot ignore so easily is the claim in the same report that the global economy is losing 1.6% of GDP every year due to climate change. Today. Not in a decade or a century but today. This cannot be ignored so easily. In fact the Saturday Globe and Mail discussed the vanishing Arctic sea ice causing global extreme weather events causing global food supply disruption in a lengthy article on the front page of the Sept. 27th Business section. An image of the sea ice minimum of September 16th was even on the next page. Never before in the history of the Globe have I seen such a thing! Why was the article there? Not because of concern for sea ice or worry of extreme weather but because of the 1.6% GDP loss occurring today. Expected to rise to 3.5% of GDP loss 2030. Things are different now. Our world is changing rapidly, in real-time, before our very eyes. Just watch a video of the ice this summer. We have never experienced abrupt climate change before.
For decades, many climatologists have been warning that the energy balance of the earth is out of wack. Now, to the tune of the equivalent of 0.6 Watts per square meter over the entire surface of the planet. Isn’t this small, a Christmas tree bulb is a Watt or two? No. James Hansen calculated that this imbalance is equivalent to the energy of 300,000 Hiroshima sized bombs popping off every single second on every day of the year, year in and year out. Half of this energy is warming the atmosphere and half is warming the ocean. It is not small at all. Sounds like insanity to me. But I am biased. I live and breathe climatology and meteorology. Thus I know the dangers that climate change can bring much more deeply than others and I want to bring others up to speed. Quickly.
Methane locked under the Arctic ice could take climate change to a whole new level. Antonio Delgado Huertas
The risk with climate change is not with the direct effect of humans on the greenhouse capacity of Earth’s atmosphere. The major risk is that the relatively modest human perturbation will unleash much greater forces. The likelihood of this risk is intimately tied to the developments over the next decade in the Arctic.
Accelerating ice loss and warming of the Arctic is disturbing evidence that dangerous climate change is already with us. As I have argued earlier, now that we have realised this our efforts should be directed at managing the situation in the Arctic and avoiding the spread of dangerous climate change elsewhere.
Whereas the term tipping point was initially introduced to the climate change debate in a metaphoric manner, it has since been formalised and introduced in the context of systems exhibiting rapid, climate-driven change, such as the Arctic. Tipping points have been defined in the context of earth system science as the critical point in forcing at which the future state of the system is qualitatively altered.
Tipping elements are defined, accordingly, as the structural components of the system directly responsible for triggering abrupt changes once a tipping point is passed. This is because they can be switched into a qualitatively different state by small perturbations.
Of the many tipping elements in the Arctic, that with potentially greatest consequences if perturbed is the vast methane deposit. Methane is a greenhouse gas. A molecule of methane has 20 times the greenhouse effect of a CO₂ molecule, and the release of methane has been linked to climatic transitions along the history of planet Earth.
The Arctic contains vast reserves of methane stored as methane hydrate, a gel-like substance formed by methane molecules trapped in frozen water. The methane hydrate deposits are estimated at between 1,000 and 10,000 Gigatons (109 tons) of CO₂-equivalents as methane, much of which is present in the shallow sediments of the extensive Arctic shelves. This amount of greenhouse gas is several times the total CO₂ release since the industrial revolution.
Even moderate (a few degrees C) warming of the overlying waters may change the state of methane from hydrates to methane gas, which would be released to the atmosphere. If this release is gradual, methane will add a greenhouse effect to the atmosphere. This will only be temporary, as it will be oxidised to CO₂, with a decline in the greenhouse effect of 20-fold per unit carbon.
However, if the state shift is abrupt it may lead to a massive release of methane to the atmosphere, which could cause a climatic jump several-fold greater than the accumulated effect of anthropogenic activity.
Data collected on a recent cruise confirm methane is being emitted. Antonio Delgado Huertas
Recent assessments have found bubbling of methane on the Siberian shelf. Models suggest that global warming of 3°C could release between 35 and 94 Gt C of methane, which could add up to an additional 0.5°C of global warming. Moreover, frozen soils and sediments contain large amounts of methane hydrates that can be released to the atmosphere. Indeed, rapid thawing of the Arctic permaforst has been reported to lead to the release of large amounts of methane.
In our most recent cruise this summer (June 2012) along the Fram Strait and Svalbard Islands we found concentrations of methane in the atmosphere of about 1.65 ppm. However our equilibrium experiments (air atmospheric with Arctic surface water) reached values that were generally between 2.5 ppm and 10 ppm, with maximum values up to 35 ppm. These results confirm that this area of the planet is emitting large amounts of methane into the atmosphere.
Understanding and forecasting the response of Arctic methane hydrate deposits to rapid warming and thawing in the Arctic is of the utmost importance.
Provided the magnitude of these risks, and those associated with other tipping elements in the Arctic, our collective response to climate change appears to be a careless walk on the razor edge.
Carlos Duarte receives funding from the Spanish Ministry of Economy and Competitiveness and the EU R&D 7th Framework Program to conduct research in the Arctic. He is affiliated, through a joint appointment, with the Spanish National Research Council (CSIC).
Antonio Delgado Huertas receives funding from Ministry of Economy and Competitiveness (Spain).
Mark Flanner et al. calculated in 2011 that snow and ice on the Northern Hemisphere had a combined cooling effect of 3.3 Watts per square meter (of which 2 W/m² relates to the snow cover on land and 1.3 W/m² to the sea ice).
This cooling effect is diminishing rapidly, as temperatures rise and snow and ice cover declines. Snow and ice on the Northern Hemisphere had already declined substantially over the years and was reflecting 0.45 watts less energy per square meter in 2011 than it did in 1979 (Flanner, 2011).
As discussed in Albedo change in the Arctic, Professor Peter Wadhams calculates that the loss of the Arctic sea ice cooling effect alone can be compared to the net global warming caused by people's emissions (1.66 W/m², IPCC, 2007b).
The exponential trends added by Wipneus to PIOMAS Arctic sea ice volume data show that the Arctic Ocean looks set to be ice-free from 2015 onwards for the period from August through to October, while July and November look set to follow from 2017, respectively 2018 onwards with June following closely thereafter. In other words, we could soon face an Arctic Ocean that is ice-free for half the year.
Snow cover on land takes up an even larger area than sea ice. The chart below illustrates the decline of snow cover on land in the Northern Hemisphere (without Greenland) for the month June.
What trends could fit these data? On the image below, I've added trendlines and I encourage others to come up with better ones.
Clearly, a lot of snow and ice looks set to disappear over the next few years. Note that what happens in winter doesn't matter as much, as little sunlight reaches the Arctic in winter. What matters most is how much sunlight is reflected when insolation in the Arctic is high. Insolation during the months June and July is higher in the Arctic than anywhere else on Earth, as shown on the image below, by Pidwirny (2006).
While Greenland remains extensively covered with snow and ice, the reflectivity of its cover shows rapid decline, as illustrated by the image below. The July data since 2000, from the meltfactor blog with projection in red added by Sam Carana, suggest a exponential fall in reflectivity that looks set to go into freefall next year.
A drop of as little as 1% in Earth’s albedo corresponds with a warming roughly equal to the effect of doubling the amount of carbon dioxide in the atmosphere, which would cause Earth to retain an additional 3.4 watts of energy for every square meter of surface area (NASA, 2005; Flanner et al., 2011).
Combined, the snow line retreat, loss of sea ice and decline of Greenland's reflectivity constitute a huge loss of summer cooling in the Arctic.
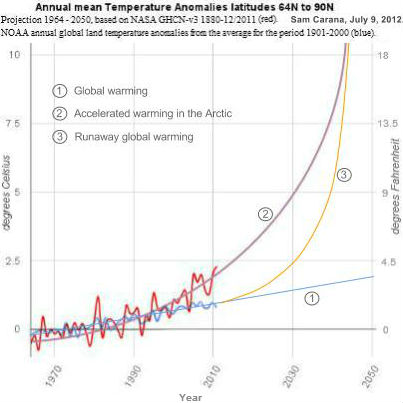
As a result, summer temperatures in the Arctic look set to rise rapidly over the next few years, threatening to unleash massive amounts of methane from sediments below shallow waters of the Arctic Ocean, spiraling Earth into runaway global warming.
If you are also concerned about this development, please share the image below at Facebook, with a link to this post.
Northern Hemisphere snow and ice map , October 14, 2012 (credit: NSIDC, NOAA)
Snow covers more than 33% of lands north of the equator from November to April, reaching 49% coverage in January. The role of snow in the climate system includes strong positive feedbacks related to albedo and other, weaker feedbacks related to moisture storage, latent heat and insulation of the underlying surface, which vary with latitude and season (IPCC, 2007a8).
Ice caps and glaciers cover 7% of the Earth—more than Europe and North America combined—and are responsible for reflecting 80–90% of the Sun’s light rays that enter our atmosphere and maintain the Earth’s temperature7. They are also a natural carbon sink, capturing a large amount of carbon dioxide7.
Snow and ice on the Northern Hemisphere has a cooling effect of 3.3 watts per square meter, peaking in May at ~ 9 watts per square meter. Snow and ice on the Northern Hemisphere has declined over the years and is now reflecting 0.45 watts less energy per square meter than it did in 1979 (Flanner, 2011). As discussed in Albedo change in the Arctic, this compares to warming of 1.66 watts per square meter for the net emission by people (IPCC, 2007b9).
A recent press release7 announced that researchers from the Massachusetts Institute for Technology have shown that the material strength and fracture toughness of ice are decreased significantly under increasing concentrations of carbon dioxide molecules, making ice more fragile and making ice caps and glaciers more vulnerable to cracking and splitting into pieces.
“If ice caps and glaciers were to continue to crack and break into pieces, their surface area that is exposed to air would be significantly increased, which could lead to accelerated melting and much reduced coverage area on the Earth,” said lead author of the study Professor Markus Buehler.
Buehler, along with his student and co-author of the paper, Zhao Qin, used a series of atomisticlevel computer simulations to analyse the dynamics of molecules to investigate the role of carbon dioxide molecules in ice fracturing, and found that carbon dioxide exposure causes ice to break more easily.
Notably, the decreased ice strength is not merely caused by material defects induced by carbon dioxide bubbles, but rather by the fact that the strength of hydrogen bonds—the chemical bonds between water molecules in an ice crystal—is decreased under increasing concentrations of carbon dioxide. This is because the added carbon dioxide competes with the water molecules connected in the ice crystal.
It was shown that carbon dioxide molecules first adhere to the crack boundary of ice by forming a bond with the hydrogen atoms and then migrate through the ice in a flipping motion along the crack boundary towards the crack tip.
The carbon dioxide molecules accumulate at the crack tip and constantly attack the water molecules by trying to bond to them. This leaves broken bonds behind and increases the brittleness of the ice on a macroscopic scale7.
A drop of as little as 1% in Earth’s albedo corresponds with a warming roughly equal to the effect of doubling the amount of carbon dioxide in the atmosphere, which would cause Earth to retain an additional 3.4 watts of energy for every square meter of surface area (NASA, 200510; Flanner et al., 2011b6).
Below, a video by Dr. Peter Carter4, showing loss of snow and ice albedo on the Northern Hemisphere from 1997 to 2009, using NOAA images, and also showing the relationship to global food security and Arctic methane.
Methane is now being expelled into the Arctic atmosphere by the subsea methane hydrates at a fast increasing rate and that this expulsion began in earnest in August 2010 (Figure 1; Arctic atmospheric methane concentrations at ca 7 km altitude - Yurganov 2012; Carana 2011 a,b,c; 2012 a,b; Light 2002 a,b; 2011 a,b,c; 2012 a,b,c; Light and Carana 2011). The methane is rising into the stratosphere and mesosphere where some of it is being oxidised to produce larger quantities of noctilucent clouds between 76 and 85 km altitude. These noctilucent clouds were seen north of Norway but are now occurring at much lower latitudes over Colorado. An early figure from NASA indicates that noctilucent clouds were originally confined to the southern polar regions (Figure 2).
Prof. James Russel of Hampton University argues that the build up of methane in the atmosphere is the reason for the increase in noctilucent clouds. Prof Russel says that "When methane makes its way into the upper atmosphere it is oxidised by a complex series of reactions to form water vapour. This extra water vapour is then available to grow ice crystals for noctilucent clouds". Therefore if we succeed in breaking down the methane in the stratosphere and mesosphere using the HAARP - IRIS (Ionospheric Research Instrument) using the 13.56 MHz methane destruction frequency it could lead to an increase in noctilucent cloud formation in a circular zone directly above the HAARP transmitters which could be detected by optical cameras or radar. The HAARP tests should be conducted in the summer when the temperatures are at their lowest in Alaska (140o to 160o Kelvin) increasing the chances of noctilucent cloud formation from the radio frequency oxidised methane. The HAARP IRIS transmitters normal frequency range is from 2.8 MHz to 10 MHz (Wales 2012). If for example a 10 MHz carrier wave is modulated by a 3.56 MHz signal it will produce and Upper Side Frequency of 13.56 MHz the required methane destruction frequency and a Lower Side Frequency of 6.44 MHz (see Table 3)(Penguin Dictionary of Physics, 2000)
NASA modelling shows a wide equatorial band of stratospheric methane reaching 1.8 ppmv, much higher than occurs in the troposphere indicating that the methane is rising up into the stratosphere where it is now accumulating and it will soon form a continuous global warming veil causing extreme heating of the Earth's surface by trapping the suns heat below it (Figure 3)(Light 2011c).
The problem is that the methane being released into the Arctic atmosphere from destabilization of the submarine methane hydrates has an extremely high global warming potential compared to carbon dioxide, close to 100 times for the first 15 years of its life (Wales 2012; Dessuse et al. 2008). Hence a methane concentration of 2 ppmv is approximately equivalent to adding 200 ppmv of carbon dioxide to the atmosphere, i.e. multiplying the present carbon dioxide content by 1.5. But 2 ppmv is only 2 ten thousands of a percent of methane and you need about 15 percent of methane in the air for it to burn (Wales 2012). Therefore you cannot burn these giant clouds of methane erupting into the Arctic atmosphere and they are rising so fast through the troposphere into the stratosphere that they become impossible to deal with without some action at a distance method such as radio waves or laser. We could of course try to get chemicals up there and into the Arctic but that would lead to even more pollution in the long run. Vibrating the ionosphere at the correct methane destruction radio frequency using HAARP may help to oxidise some of the methane throughout the entire stratosphere and troposphere but more localised radio/laser destruction of the rising methane clouds will also be required if we are going to make any dent at all in the volume of methane that is now being released into the atmosphere from the Arctic ocean.
We are dealing with oceanic methane being released in increasing quantities into the atmosphere from destabilised methane hydrates over which we have no control at all and once it is in the air and in the stratosphere we presently have no way to break it down. This Stratospheric methane reservoir is going to increase in density, thickness and extent until it encompasses the entire Earth and will eventually cause catastrophic global warming and the extinction of all life on earth (Light 2011c). Furthermore because the methane remains mostly in the stratosphere, it is not recorded when average atmospheric compositions are determined at Mauna Loa and other locations so we don't know how much is up there yet (Light 2011c). When the German-French Merlin Lidar methane detecting satellite is launched in 2014 we should have a better idea of the methane distribution from the surface to 50 km altitude.
When the Arctic ice cap melts towards the end of 2015 there will be a massive increase in the amount of heat being absorbed by the Arctic ocean from the sun. Tthe Gulf Stream which presently feeds the Arctic with Atlantic water along the west side of Svalbard and through the Barents Sea is normally cooled when it hits the floating ice pack and this will cease to happen bringing even vaster amounts of Atlantic heat via the Gulf Stream into the Arctic. Consequently the Arctic subsea methane hydrates will destabilize at an even faster rate because of the increasing Arctic ocean temperature pouring methane into the Arctic atmosphere and stratosphere (Light 2011c, Light 2012a, b).
The extreme weather events in the United States this year which included record heating and drought conditions, massive loss of food crops with farmers going bankrupt, more hurricane flooding in New Orleans and tornadoes in New York is just a small sample of what will come in the next four or five summers as the Arctic ice finally melts. The Arctic ice cap works like the Earths air conditioner because of the latent heat of melting and freezing of the floating ice and its effect on moderating atmospheric temperatures.
An extensive stratospheric methane warming veil is spreading over the United States and is undoubtedly the reason for the extreme weather events and very high temperatures. The livelihoods of all the American people are going to be totally compromised in the next few years unless we develop a system of destroying the atmospheric methane that is erupting in the Arctic from the destabilization of submarine methane hydrates and is accumulating as a global warming veil in the stratosphere and mesosphere
We are facing impossible odds with regard to the Arctic ocean methane release and in the same way that Colonel Travis drew a line at the Alamo to ask for volunteers to help him defend the mission against Santa Ana's massive Mexican army, I am drawing a virtual line through the snow on the top of the Arctic ice pack to ask for volunteers to defend the American people from the fast gathering Arctic methane global firestorm. We desperately need dedicated scientists and engineers to volunteer to develop an effective "action at a distance" method of destroying the Arctic oceanic methane clouds as they are erupting from the sea surface and entering the stratosphere and mesosphere. If the United States can land giant rovers on the mars with a sky crane, surely American engineers and scientists are up to this challenge. We need to get rid of as much of this atmospheric methane as we can to drop the polar temperatures to reasonable levels. This will of course have to go hand in hand with a massive cut back in carbon dioxide emissions from all developed and developing countries.


