Showing posts with label albedo. Show all posts

Saturday, December 8, 2018

Carbon dioxide emissions are rising

CO₂ emissions are rising

In models used by the Intergovernmental Panel on Climate Change (IPCC), carbon dioxide (CO₂) emissions were expected to come down in line with pledges made at the Paris Agreement. Yet, the Global Carbon Project projects growth in CO₂ emissions from fossil fuels and industry in 2018 to be +2.7%, within uncertainty margins from +1.8% to +3.7%.


This rise is in line with an image from an earlier post that shows growth of CO₂ in the atmosphere to be accelerating.
[ Growth of CO₂ in ppm, based on annual Mauna Loa data (1959-2017), with 4th-order polynomial trend added ]

Methane emissions rising as well

And it's not just CO₂ emissions that are rising. Methane emissions are rising as well. Sadly, politicians typically ignore this elephant in the room, in particular seafloor methane emissions that threaten to trigger a huge temperature rise within years.

[ ignoring the elephant in the room, i.e. seafloor methane ]
The MetOp image below shows high methane levels over oceans on December 9, 2018, pm, at 469 mb. Levels over the Arctic Ocean in particular are very high, as the large areas solidly colored magenta indicate.


The MetOp image shows many areas where no data were available, as indicated by the color grey. The NPP images don't have as many grey areas. The image below confirms very high methane levels over the Arctic Ocean on December 9, 2018 pm, closer to the surface, i.e. at 840 mb. While there still are many grey areas, the absence of data for many of them is due to altitude, since large parts of Greenland, Antarctica and the Himalayas are rather high.


As discussed in earlier posts, large amounts of methane appear to be rising from the Arctic Ocean. As the methane rises higher in the atmosphere, it moves closer to the Equator. The NPP image below shows levels at 399 mb on December 9, 2018, pm. At this altitude, there are very few grey areas, so it's possible to get a fuller picture of where the highest levels of methane are. Ominously, levels as high as 3060 ppb were reached.


El Niño events will intensify

The image on the right shows that, on December 30, 2018, sea surface temperature anomalies were as high as 9.7°C or 17.4°F in the Pacific Ocean, 11.1°C or 20°F in the Atlantic Ocean and 17.1°C or 30.8°F near Svalbard in the Arctic Ocean.

NOAA expects El Niño to form and continue through the Northern Hemisphere winter 2018-19 (~90% chance). A recent study concludes that global warming will enhance both the amplitude and the frequency of eastern Pacific El Niño events.

Albedo change

Albedo change due to decline of the snow and ice cover is another feedback that the IPCC has yet to come to grips with. The IPCC seems to have hoped that albedo loss in the Arctic was somehow compensated for by albedo gain in the Antarctic.

The IPCC (in AR5, WG1) did find a significant increase in Antarctic annual mean sea ice extent that is very likely in the range of 1.2 to 1.8 % per decade between 1979 and 2012 (0.13 to 0.20 million km² per decade) (very high confidence).

As the image below shows, global sea ice extent steadily came down, but then grew somewhat until end 2014. From end 2014 on, Antarctic sea ice extent fell rapidly, with huge repercussions for global sea ice extent, as also illustrated by the image on the right that highlights the most recent years of the graph below.

At the end of 2016, Antarctic sea ice extent was a lot smaller than it was at the end of 2014. Such a difference in sea ice extent corresponds with a huge difference in radiative forcing (RF).

Antarctic sea ice extent was 4.913 million km² on January 5, 2019, a record low for the time of year and 4.212 million km² less than it was on January 5, 2015, when extent was 9.125 million km².

This decline could make a difference of 1.3 W/m² in RF. By comparison, the IPCC estimated the net RF from all emissions by people from 1750 to 2011 at 1.6 W/m².

As the image below shows, global sea ice extent was at a record low for the time of year on Dec. 28, 2018, and looks set to go lower in 2019.

Antarctic sea ice decline is only part of the picture, there's also Arctic sea ice decline and there's decline of the snow and ice cover on land.

Joint impact

A lot of this has not been accounted for by the IPCC, i.e. the recent increases in CO₂ emissions, increases in methane releases, increases in further emissions such as nitrous oxide and black carbon, albedo changes due to decline in the snow and ice cover and associated changes such as jet stream changes, more permafrost melting and stronger impacts of future El Niño events.

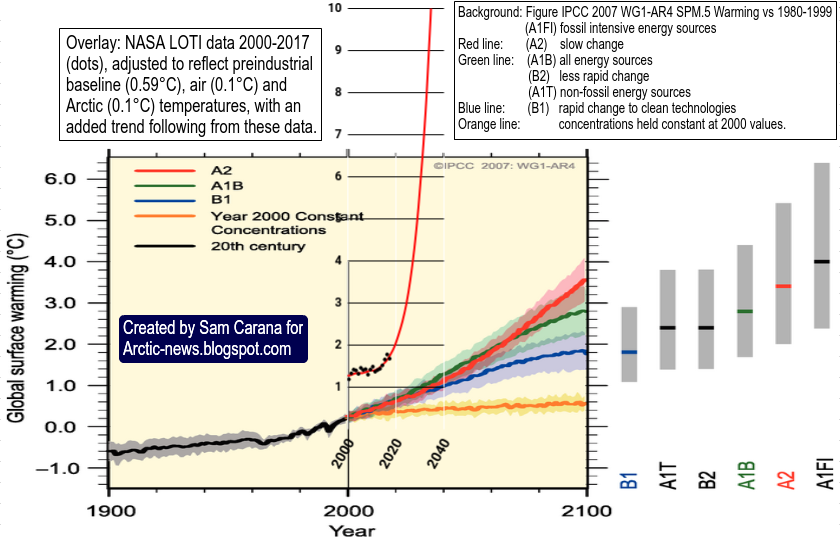
The image on the right shows the joint impact of the warming elements that threaten to eventuate over the next few years and that could result in a 10°C or 18°F global temperature rise in a matter of years.

The situation is dire and calls for comprehensive and effective action, as described at the Climate Plan.

Links

• Global Carbon Project
http://www.globalcarbonproject.org

• Looking the climate abyss in the eye!
https://arctic-news.blogspot.com/2018/09/looking-the-climate-abyss-in-the-eye.html

• How much warmer is it now?
https://arctic-news.blogspot.com/2018/04/how-much-warmer-is-it-now.html

• Feedbacks
https://arctic-news.blogspot.com/p/feedbacks.html

• How much warming have humans caused?
https://arctic-news.blogspot.com/2016/05/how-much-warming-have-humans-caused.html

• Albedo change in the Arctic
http://arctic-news.blogspot.com/2012/07/albedo-change-in-arctic.html

• IPCC AR5 WG1 chapter 4
https://www.ipcc.ch/site/assets/uploads/2018/02/WG1AR5_Chapter04_FINAL.pdf

• The Threat
https://arctic-news.blogspot.com/p/threat.html

• Extinction
https://arctic-news.blogspot.com/p/extinction.html

• Climate Plan
https://arctic-news.blogspot.com/p/climateplan.html

• NOAA El Niño forecast
https://www.cpc.ncep.noaa.gov/products/analysis_monitoring/lanina/enso_evolution-status-fcsts-web.pdf
https://www.cpc.ncep.noaa.gov/products/analysis_monitoring/enso_advisory/ensodisc.shtml

• El Niño events to become stronger and more intense
https://www.theage.com.au/environment/climate-change/el-nino-events-to-become-stronger-and-more-intense-study-finds-20181212-p50lrv.html
https://www.nature.com/articles/s41586-018-0776-9


Monday, October 8, 2018

What Does Runaway Warming Look Like?

The forcing caused by the rapid rise in the levels of greenhouse gases is far out of line with current temperatures. A 10°C higher temperature is more in line with these levels, as illustrated by the image below.


Carbon dioxide levels have been above 400 ppm for years. Methane levels above 1900 ppb were recorded in September 2018. Such high levels are more in line with a 10°C higher temperature, as illustrated by the above graph based on 420,000 years of ice core data from Vostok, Antarctica, research station.

How fast could such a 10°C temperature rise eventuate? The image below gives an idea.


Such runaway warming would first of all and most prominently become manifest in the Arctic. In many ways, such a rise is already underway, as the remainder of this post will show.

High Arctic Temperatures

Why are Arctic temperatures currently so high for the time of year?


As warmer water enters the Arctic Ocean from the Atlantic and Pacific Oceans, there is no thick sea ice left to consume this heat. Some of this heat will escape from the Arctic Ocean to the atmosphere, as illustrated by above dmi.dk  image showing very high temperatures for the time of the year over the Arctic (higher than 80°C latitude).


Above dmi.dk image shows that Arctic temperatures are increasingly getting higher during Winter in the Northern Hemisphere.


Similarly, above NASA image shows that Arctic temperatures are increasingly getting higher during Winter in the Northern Hemisphere.


As the Arctic warms up faster than the rest of the world, the Jet Stream is becoming more wavy, allowing more hot air to move into the Arctic, while at the same time allowing more cold air to move south.

Above image shows that the air over the Beaufort Sea was as warm as 12.8°C or 55°F (circle, at 850 mb) on October 2, 2018. The image also illustrates that a warmer world comes with increasingly stronger cyclonic winds.


The images above and below shows that on October 2 and 7, 2018, the sea surface in the Bering Strait was as much as 6°C or 10.7°F, respectively 6.4°C or 11.6°F warmer than 1981-2011 (at the green circle).


As temperatures on the continent are coming down in line with the change in seasons, the air temperature difference is increasing between - on the one hand - the air over continents on the Northern Hemisphere and - on the one hand - air over oceans on the Northern Hemisphere. This growing difference is speeding up winds accordingly, which in turn can also speed up the influx of water into the Arctic Ocean.

[ The Buffer has gone, feedback #14 on the Feedbacks page ]
Start of freezing period

Here's the danger. In October, Arctic sea ice is widening its extent, in line with the change of seasons. This means that less heat can escape from the Arctic Ocean to the atmosphere. Sealed off from the atmosphere by sea ice, greater mixing of heat in the water will occur down to the seafloor of the Arctic Ocean, while there is little or no ice buffer left to consume an influx of heat from the Atlantic and Pacific Oceans, increasing the danger that warm water will reach the seafloor of the Arctic Ocean and destabilize methane hydrates. 

Rising salt content of Arctic Ocean

It's not just the influx of heat that is the problem. There's also the salt. Ice will stay frozen and will not melt in freshwater until the temperature reaches 0°C (or 32°F). Ice in saltwater on the other hand will already have melted away at -2°C (or 28.4°F).

The animation of the right shows salty water rapidly flowing through the Bering Strait.

With the change of seasons, there is less rain over the Arctic Ocean. The sea ice also seals the water of the Arctic Ocean off from precipitation, so no more fresh water will be added to the Arctic Ocean due to rain falling or snow melting on the water.

In October, temperatures on land around the Arctic Ocean will have fallen below freezing point, so less fresh water will flow from glaciers and rivers into the Arctic Ocean. At that time of year, melting of sea ice has also stopped, so fresh water from melting sea ice is no longer added to the Arctic Ocean either.

Pingos and conduits. Hovland et al. (2006)
So, the Arctic Ocean is receiving less freshwater, while the influx of water from the Atlantic and Pacific Oceans is very salty. This higher salt content of the water makes it easier for ice to melt at the seafloor of the Arctic Ocean. Saltier warm water is causing ice in cracks and passages in sediments at the seafloor of the Arctic Ocean to melt, allowing methane contained in the sediment to escape.

[ click on images to enlarge ]
The image on the right, from a study by Hovland et al., shows that hydrates can exist at the end of conduits in the sediment, formed when methane did escape from such hydrates in the past. Heat can travel down such conduits relatively fast, warming up the hydrates and destabilizing them in the process, which can result in huge abrupt releases of methane.

Heat can penetrate cracks and conduits in the seafloor, destabilizing methane held in hydrates and in the form of free gas in the sediments.

Methane

peak methane levels as high as 2859 ppb
On October 2 and 7, 2018, peak methane levels were as high as 2838 ppb, respectively 2859 ppb, as the images on the right shows. Methane levels over the Beaufort Sea have been high for some time, and have remained high at very high altitudes.

The threat is that a number of tipping points are going to be crossed, including the buffer of latent heat, loss of albedo as Arctic sea ice disappears, methane releases from the seafloor and rapid melting of permafrost on land and associated decomposition of soils, resulting in additional greenhouse gases (CO₂, CH₄, N₂O and water vapor) entering the Arctic atmosphere, in a vicious self-reinforcing cycle of runaway warming.

A 10°C rise in temperature by 2026?


Above image shows how a 10°C or 18°F temperature rise from preindustrial could eventuate by 2026 (from earlier post).

The situation is dire and calls for comprehensive and effective action, as described at the Climate Plan.


Links

• Temperature Rise
https://arctic-news.blogspot.com/2017/08/temperature-rise.html

• Mean Methane Levels reach 1800 ppb
https://arctic-news.blogspot.com/2013/06/mean-methane-levels-reach-1800-ppb.html

• Why are methane levels over the Arctic Ocean high from October to March?
https://arctic-news.blogspot.com/2015/01/why-are-methane-levels-over-the-arctic-ocean-high-from-october-to-march.html

• Blue Ocean Event
https://arctic-news.blogspot.com/2018/09/blue-ocean-event.html

• Feedbacks
https://arctic-news.blogspot.com/p/feedbacks.html

• The Threat
https://arctic-news.blogspot.com/p/threat.html

• Extinction
https://arctic-news.blogspot.com/p/extinction.html

• Aerosols
https://arctic-news.blogspot.com/p/aerosols.html

• How extreme will it get?
https://arctic-news.blogspot.com/2012/07/how-extreme-will-it-get.html

• Climate Plan
https://arctic-news.blogspot.com/p/climateplan.html


Monday, September 10, 2018

Blue Ocean Event

Blue Ocean Event as part of four Arctic tipping points

What will be the consequences of a Blue Ocean Event, i.e. the disappearance of virtually all sea ice from the Arctic Ocean, as a result of the warming caused by people?


Paul Beckwith discusses some of the consequences in the video below. As long as the Arctic Ocean has sea ice, most sunlight gets reflected back into space and the 'Center-of-Coldness' remains near the North Pole, says Paul. With the decline of the sea ice, however, the 'Center-of-Coldness' will shift to the middle of Greenland. Accordingly, we can expect the jet streams to shift their center of rotation 17° southward, i.e. away from the North Pole towards Greenland, with profound consequences for our global weather patterns and climate system, for plants and animals, and for human civilization, e.g. our ability to grow food.


Also see Paul's video below, The Arctic Blue-Ocean-Event (BOE). When? Then What?


Changing Winds

As global warming continues, the additional energy in the atmosphere causes stronger winds and higher waves.

As the Arctic warms up faster than the rest of the world, the jet streams are getting more out of shape, exacerbating extreme weather events.

The image on the right shows the jet stream crisscrossing the Arctic Ocean on September 10, 2018, with cyclonic wind patterns all over the place.

On the image below, Typhoon Mangkhut is forecast to cause waves as high as 21.39 m or 70.2 ft on September 14, 2018.


The inset on above image shows Typhoon Mangkhut forecast to cause winds to reach speeds as high as 329 km/h or 205 mph at 700 hPa (green circle), while Hurricane Florence is forecast to hit the coast of North Carolina, and is followed by Hurricane Isaac and Hurricane Helene in the Atlantic Ocean.


At 850 hPa, Typhoon Mangkhut reaches Instant Wind Power Density as high as 196.9 kW/m² on September 13, 2018, as illustrated by above image.

The situation is likely to get worse over the next few months, as this is only the start of the hurricane season and El Niño is strengthening, as illustrated by the image on the right.

The image below shows how the occurrence and strength of El Niño has increased over the decades.


Four Arctic Tipping Points

There are numerous feedbacks that speed up warming in the Arctic. In some cases, there are critical points beyond which huge changes will take place rather abruptly. In such cases, it makes sense to talk about tipping points.

1. The albedo tipping point

As Arctic sea ice gets thinner and thinner, a Blue Ocean Event looks more imminent every year. A Blue Ocean Event means that huge amounts of sunlight won't get reflected back into space anymore, as they previously were. Instead, the heat will have to be absorbed by the Arctic. 


At the other hemisphere, the sea ice around Antarctica is at its lowest extent for the time of the year, as illustrated by above image. Global sea ice extent is also at its lowest for the time of the year, as illustrated by the image below.

A Blue Ocean Event will not only mean that additional heat will have to be absorbed in the Arctic, but also that wind patterns will change radically and even more dramatically than they are already changing now, which will also make that other tipping points will be reached earlier. This is why a Blue Ocean Event is an important tipping point and it will likely be reached abruptly and disruptively.

2. The latent heat tipping point

Disappearance of the sea ice north of Greenland is important in this regard. The image on the right shows that most sea ice at the end of August 2018 was less than 1 meter thick.

The image below shows how the sea ice has been thinning recently north of Greenland and Ellesmere Island, an area once covered with the thickest multi-year sea ice. Disappearance of sea ice from this area indicates that we're close to or beyond the latent heat tipping point, i.e. the point where further ocean heat can no longer be consumed by the process of melting the sea ice.

[ The once-thickest sea ice has gone - click on images to enlarge ]
The amount of energy absorbed by melting ice is as much as it takes to heat an equivalent mass of water from zero to 80°C. Without sea ice, additional ocean heat will have to go somewhere else.


Above image shows how much sea surface temperatures in the Arctic have warmed, compared to 1961-1990. The image also shows the extent of the sea ice (white). In the image below, a large area has changed from sea ice to water twelve days later, showing how thin and fragile the sea ice is and how easily it can disappear as the water continues to warm.


As the Arctic is warming faster than the rest of the world, changes have been taking place to the jet streams on the Northern Hemisphere that make it easier for warm air and water to move into the Arctic. This means that warm water is increasingly entering the Arctic Ocean that can no longer be consumed by melting the sea ice from below.

Arctic sea ice extent has remained relatively large this year, since air temperatures over the Arctic Ocean have been relatively low in June and July 2018. At the same time, ocean heat keeps increasing, so a lot of heat is now accumulating underneath the surface of the Arctic Ocean.

[ click on images to enlarge ]
3. Seafloor Methane Tipping Point

As said above, Arctic sea ice has been getting thinner dramatically over the years, and we are now near or beyond the latent heat tipping point.

[ The Buffer has gone, feedback #14 on the Feedbacks page ]
This year, air temperatures over the Arctic Ocean were relatively low in June and July 2018, and this has kept Arctic sea ice extent larger than it would otherwise have been. As a result, a lot of heat has been accumulating underneath the surface of the Arctic Ocean and this heat cannot escape to the atmosphere and it can no longer be consumed by melting. Where will the heat go?

As the temperature of the Arctic Ocean keeps rising, more heat threatens to reach sediments at its seafloor that have until now remained frozen. Contained in these sediments are huge amounts of methane in the form of hydrates and free gas.

Melting of the ice in these sediments then threatens to unleash huge eruptions of seafloor methane that has been kept locked up in the permafrost for perhaps millions of years. Seafloor methane constitutes a third tipping point.

The image on the right features a trend based on WMO data. The trend shows that mean global methane levels could cross 1900 ppb in 2019.

Ominously, methane recently reached unprecedented levels. Peak levels as high as 3369 ppb on August 31, 2018, as shown by the image below on the right.

The next image on the right below shows that mean global levels were as high as 1905 ppb on September 3, 2018.

The third image below on the right may give a clue regarding the origin of these unprecedented levels.

More methane will further accelerate warming, especially in the Arctic, making that each of the tipping points will be reached earlier.

Less sea ice will on the one hand make that more heat can escape from the Arctic Ocean to the atmosphere, but on the other hand the albedo loss and the additional water vapor will at the same time cause the Arctic Ocean to absorb more heat, with the likely net effect being greater warming of the Arctic Ocean.

Additionally, more heat is radiated from sea ice into space than from open water (feedback #23).

How much warming could result from the decline of snow and ice cover in the Arctic?

As discussed, there will be albedo changes, there will be changes to the jet streams, and there will be further feedbacks, adding up to 1.6°C of additional global warming that could eventuate due to snow and ice decline and associated changes in the Arctic.

A further 1.1°C of warming or more could result from releases of seafloor methane over the next few years.

4. Terrestrial Permafrost Tipping Point

Additional warming of the Arctic will also result in further warming due to numerous feedbacks such as more water vapor getting into the atmosphere. Furthermore, more intense heatwaves can occur easier in the Arctic due to changes to jet streams. All this will further accelerate melting of the ice in lakes and in soils on land that was previously known as permafrost. This constitutes a fourth tipping point that threatens to add huge amounts of additional greenhouse gases to the atmosphere. Until now, the permafrost was held together by ice. As the ice melts, organic material in the soil and at the bottom of lakes starts to decompose. The land also becomes increasingly vulnerable to landslides, sinkholes and wildfires. All his can result in releases of CO₂, CH₄, N₂O, soot, etc., which in turn causes further warming, specifically over the Arctic.

In total, a temperature rise of 10°C threatens to occur in as little as a few years time.

The situation is dire and calls for comprehensive and effective action, as described in the Climate Plan.


Links

• Jet Stream Center-of-Rotation to Shift 17 degrees Southward from North Pole to Greenland with Arctic Blue Ocean Event
https://www.youtube.com/watch?v=bFme3C9e-cs

• It could be unbearably hot in many places within a few years time
https://arctic-news.blogspot.com/2016/07/it-could-be-unbearably-hot-in-many-places-within-a-few-years-time.html

• Feedbacks
https://arctic-news.blogspot.com/p/feedbacks.html

• Latent Heat
https://arctic-news.blogspot.com/p/latent-heat.html

• Albedo and more
https://arctic-news.blogspot.com/p/albedo.html

• Warning of mass extinction of species, including humans, within one decade
https://arctic-news.blogspot.com/2017/02/warning-of-mass-extinction-of-species-including-humans-within-one-decade.html

• How much warming have humans caused?
https://arctic-news.blogspot.com/2016/05/how-much-warming-have-humans-caused.html

• The Threat
https://arctic-news.blogspot.com/p/threat.html

• Extinction
https://arctic-news.blogspot.com/p/extinction.html

• Climate Plan
https://arctic-news.blogspot.com/p/climateplan.html


Friday, August 24, 2018

The once-thickest Arctic sea ice has gone

The image below shows Arctic sea ice north of Greenland and around Ellesmere Island. This is the area where for thousands of years the sea ice has been the thickest, in many places remaining thicker than 5 meters (16.4 ft) throughout the year.

[ The once-thickest sea ice has gone - click on images to enlarge ]
The image is a compilation of NASA Worldview images over seven days, from August 14 through to August 21, 2018. The least cloudy areas have been selected from each image to get the best insight in the magnitude of this catastrophe.

The loss of this sea ice indicates that the buffer is gone. Sea ice acts as a buffer that absorbs heat, while keeping the temperature at the freezing point of water, about zero degrees Celsius. As long as there is sea ice in the water, this sea ice will keep absorbing heat, so the temperature doesn't rise at the sea surface.

Once the buffer is gone, further energy that enters the Arctic Ocean will go into heating up the water. The amount of energy absorbed by melting ice is as much as it takes to heat an equivalent mass of water from zero to 80°C.

[ The Latent Heat Buffer has gone, feedback #14 on the Feedbacks page ]
At the same time, decline of the snow and ice cover in the Arctic causes more sunlight to get reflected back into space, resulting in more energy getting absorbed in the Arctic Ocean.

[ Albedo Change, feedback #1 on the Feedbacks page ]

Numerous feedbacks are associated with sea ice loss. As the temperature difference between the Arctic and the Equator decreases, changes are taking pace to the Jet Stream that in turn trigger a multitude of further feedbacks, such as more extreme weather and a more scope for heat to enter the Arctic Ocean (see feedbacks page).


A further huge danger is that, as warming of the Arctic Ocean continues, heat will reach methane hydrates at the seafloor of the Arctic Ocean, causing them to get destabilized and release methane.

[ Seafloor methane, feedback #2 on the Feedbacks page ]
Adding up all warming elements associated with disappearance of the sea ice could result in additional global warming many times as much as the current global warming, all in a few years time.

Meanwhile, for the first time in human history, mean global methane levels as high as 1900 ppb have been recorded. The measurements were recorded by the MetOp-1 satellite on the morning of August 22, 2018, at 280 mb, 266 mb, 307 mb and 321 mb, as shown by the images below.


At 293 mb, MetOp-1 recorded an even higher level, i.e. mean global methane level was 1901 ppb on the morning of August 22, 2018.


The situation is dire and calls for comprehensive and effective action, as described in the Climate Plan.


Links

• It could be unbearably hot in many places within a few years time
https://arctic-news.blogspot.com/2016/07/it-could-be-unbearably-hot-in-many-places-within-a-few-years-time.html

• Feedbacks
https://arctic-news.blogspot.com/p/feedbacks.html

• Latent Heat
https://arctic-news.blogspot.com/p/latent-heat.html

• Albedo and more
https://arctic-news.blogspot.com/p/albedo.html

• How much warming have humans caused?
https://arctic-news.blogspot.com/2016/05/how-much-warming-have-humans-caused.html

• The Threat
https://arctic-news.blogspot.com/p/threat.html

• Extinction
https://arctic-news.blogspot.com/p/extinction.html

• Climate Plan
https://arctic-news.blogspot.com/p/climateplan.html