The image below (top part), adapted from NOAA, shows the observed values for the number of sunspots for cycle 25, through August 2024, as well as the values predicted by NOAA (red line).
 |
| [ click on images to enlarge ] |
The observed values are much higher than predicted. If this trend continues, the rise in sunspots forcing from early 2020 to July 2025 may well make a difference of more than 0.25°C.
El Niño
High sunspots could line up with an upcoming El Niño and with further forcing by short-term variables, in a cataclysmic alignment that could push up the temperature enough to cause dramatic sea ice loss in the Arctic, resulting in runaway temperature rise by 2026.
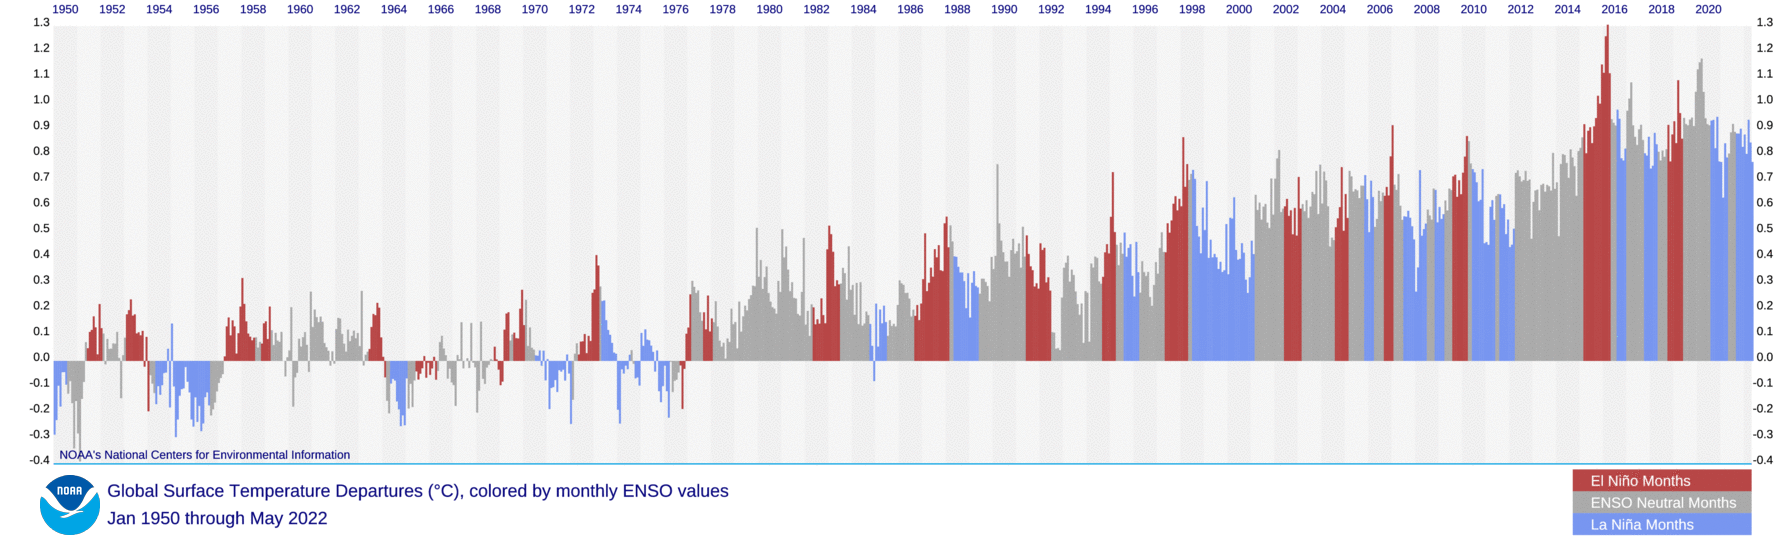
ENSO-neutral conditions are currently present and a transition to La Niña is expected by September-November 2024, as illustrated by the image below, from an earlier post and adapted from NOAA. The La Niña may be short-lived and a transition to the next El Niño may occur in the course of 2025.


El Niño occurs every 2–7 years. The image shows that El Niño can occur as frequently as every two years, e.g. in 2002, 2004 and 2006. The danger is that we could move into a new El Niño in 2025, while temperatures remain high due to feedbacks and while sunspots move toward a peak in this cycle, expected to occur in July 2025.
This - in combination with further events, developments and short-term variables - could constitute a cataclysmic alignment that could result in runaway temperature rise by 2026, as an earlier post concluded. Moving from the bottom of a La Niña to the peak of a strong El Niño could make a difference of more than 0.5°C. Sunspots could make a difference of more than 0.25°C. Further forcing could be added by additional events, e.g. submarine volcano eruptions could add huge amounts of water vapor to the atmosphere.
Further forcing
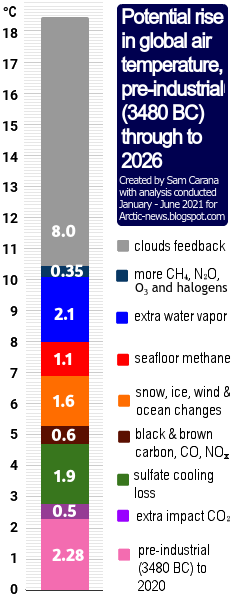
Natural variability is mentioned by the IPCC, but because such events vary from year to year, their impact is smoothed out in climate change calculations that average the temperature rise over the course of decades. Yet, when such events coincide in a cataclysmic alignment, as could be the case within the next few years, the extra rise in temperature from - say - the year 2021 could be over 0.75°C. Note that this is an extra rise, on top of the long-term rise due to activities by people since pre-industrial.
Furthermore, as emissions and temperatures keep rising, such an extra rise could trigger feedbacks that threaten to grow in strength and strike with ever greater ferocity, further accelerating the temperature rise while extreme weather disasters hit numerous regions around the world more frequently over larger areas, with greater intensity and for longer periods.
Conflict and socio-economic stress could add further forcing. Heatwaves, fires, famine, drought, floods, crop loss, loss of habitable land and corrupt politicians threaten to cause violent conflicts to erupt around the world, industrial activity to grind to a halt and the temperature to rise above 3°C from pre-industrial, driving humans into extinction by 2026. Sadly, politicians and mainstream media fail to inform people about the danger, and once the full horror reveals itself, panic could be added to the problems the world faces.

The image below, from an earlier post and adapted from NOAA, illustrates that El Niño conditions were present from June 2023 through April 2024, and that ENSO-neutral started in May 2024.

This - in combination with further events, developments and short-term variables - could constitute a cataclysmic alignment that could result in runaway temperature rise by 2026, as an earlier post concluded. Moving from the bottom of a La Niña to the peak of a strong El Niño could make a difference of more than 0.5°C. Sunspots could make a difference of more than 0.25°C. Further forcing could be added by additional events, e.g. submarine volcano eruptions could add huge amounts of water vapor to the atmosphere.
Further forcing
Natural variability is mentioned by the IPCC, but because such events vary from year to year, their impact is smoothed out in climate change calculations that average the temperature rise over the course of decades. Yet, when such events coincide in a cataclysmic alignment, as could be the case within the next few years, the extra rise in temperature from - say - the year 2021 could be over 0.75°C. Note that this is an extra rise, on top of the long-term rise due to activities by people since pre-industrial.
Furthermore, as emissions and temperatures keep rising, such an extra rise could trigger feedbacks that threaten to grow in strength and strike with ever greater ferocity, further accelerating the temperature rise while extreme weather disasters hit numerous regions around the world more frequently over larger areas, with greater intensity and for longer periods.
Conflict and socio-economic stress could add further forcing. Heatwaves, fires, famine, drought, floods, crop loss, loss of habitable land and corrupt politicians threaten to cause violent conflicts to erupt around the world, industrial activity to grind to a halt and the temperature to rise above 3°C from pre-industrial, driving humans into extinction by 2026. Sadly, politicians and mainstream media fail to inform people about the danger, and once the full horror reveals itself, panic could be added to the problems the world faces.
Climate Emergency Declaration
The situation is dire and the precautionary principle calls for rapid, comprehensive and effective action to reduce the damage and to improve the situation, as described in this 2022 post, where needed in combination with a Climate Emergency Declaration, as discussed at this group.

Links
• NOAA - Space Weather Prediction Center
https://www.swpc.noaa.gov/products/solar-cycle-progression
The situation is dire and the precautionary principle calls for rapid, comprehensive and effective action to reduce the damage and to improve the situation, as described in this 2022 post, where needed in combination with a Climate Emergency Declaration, as discussed at this group.

• NOAA - Space Weather Prediction Center
https://www.swpc.noaa.gov/products/solar-cycle-progression
• NOAA - Climate Prediction Center - ENSO: Recent Evolution, Current Status and Predictions
https://www.cpc.ncep.noaa.gov/products/analysis_monitoring/lanina/enso_evolution-status-fcsts-web.pdf
• NOAA - Monthly Temperature Anomalies Versus El Niño
https://www.ncei.noaa.gov/access/monitoring/monthly-report/global/202407/supplemental/page-4
• NOAA - El Niño/Southern Oscillation
https://www.ncei.noaa.gov/access/monitoring/enso
• Cataclysmic Alignment
https://arctic-news.blogspot.com/2022/06/cataclysmic-alignment.html
• Sunspots
https://arctic-news.blogspot.com/p/sunspots.html
• Pre-industrial
https://arctic-news.blogspot.com/p/pre-industrial.html
• Feedbacks
https://arctic-news.blogspot.com/p/feedbacks.html
• Jet Stream
https://arctic-news.blogspot.com/p/jet-stream.html
• Cold freshwater lid on North Atlantic
https://arctic-news.blogspot.com/p/cold-freshwater-lid-on-north-atlantic.html
• Transforming Society
https://arctic-news.blogspot.com/2022/10/transforming-society.html
• Climate Plan
https://arctic-news.blogspot.com/p/climateplan.html
• Climate Emergency Declaration
https://arctic-news.blogspot.com/p/climate-emergency-declaration.html


