Tuesday, April 30, 2024

Temperature rise in the Tropics (update 5)

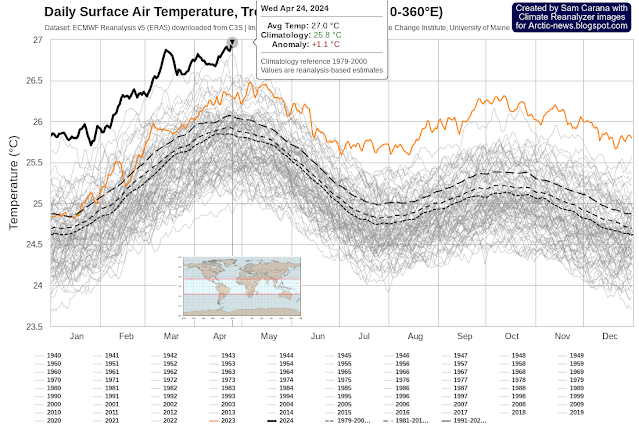
The temperature in the Tropics (23.5°S-23.5°N, 0-360°E) reached a new record high on April 24, 2024 of 27°C (or 80.6°F). 


The image below shows the monthly temperature anomaly over the past few years through March 2024, when the anomaly reached a record high of 1.448°C (or 2.606°F).  


Note that the anomaly in the top image is calculated from 1979-2000 as a base, while anomalies in the above image are calculated from 1951-1980 as a base. When calculated from a pre-industrial base, these anomalies will be much higher.

The high temperatures are causing widespread damage and are threatening to cause huge loss of life of people, livestock and wildlife, crop failure and ecosystem collapse in the tropics and elsewhere.

Climate Emergency Declaration

The situation is dire and the precautionary principle calls for rapid, comprehensive and effective action to reduce the damage and to improve the situation, as described in this 2022 post, where needed in combination with a Climate Emergency Declaration, as discussed at this group.


Links

• Climate Reanalyzer
https://climatereanalyzer.org

• Pre-industrial
https://arctic-news.blogspot.com/p/pre-industrial.html

• Extinction
https://arctic-news.blogspot.com/p/extinction.html

• Transforming Society
https://arctic-news.blogspot.com/2022/10/transforming-society.html

• Climate Plan
https://arctic-news.blogspot.com/p/climateplan.html

• Climate Emergency Declaration
https://arctic-news.blogspot.com/p/climate-emergency-declaration.html

Posts discussing the temperature rise in the Tropics in 2024 at facebook are at: 

Arctic sea ice under threat

The image below indicates that Arctic sea ice volume has meanwhile passed its annual maximum. Over the coming months, volume can be expected to decrease rapidly. The image also highlights that, over the past few months, Arctic sea ice volume has been the lowest on record for the time of year.


The image below illustrates the decline of Arctic sea ice volume over the years. The image also confirms that the annual maximum volume was recently reached and that it was the lowest maximum for the 24 years on record. 

Given that Arctic sea ice currently is still relatively extensive, this record low volume indicates that sea ice is indeed very thin, which must be caused by ocean heat melting sea ice from below, since little or no sunshine is yet reaching the Arctic at the moment and air temperatures are still far below freezing point, so where ocean heat may be melting sea ice away from below, a thin layer of ice will quickly be reestablished at the surface, keeping sea ice extent relatively large for now.

This situation looks set to dramatically change over the next few months, as air temperatures will rise and as more ocean heat will reach the Arctic Ocean. Moreover, as illustrated by the map below, much of the thicker sea ice is located off the east coast of Greenland. This sea ice and the purple-colored sea ice can be expected to melt away quickly with the upcoming rise in temperatures over the next few months.

Sea surface temperatures at record high

The image below, created with Climate Reanalyzer screenshots, shows that the sea surface temperature (SST 60°S - 60°N mean) was 21.2°C on April 24, 2024, reaching yet another record high.

[ image from earlier post ]

These record high sea surface temperatures are reached as long-term sea surface temperatures are falling and as El Niño is predicted to weaken, which is fueling fears that feedbacks are kicking in with accelerating ferocity.

The image below, adapted from NOAA, shows global ocean temperature anomalies from 1901-2000, with the green line (LOcally Estimated Scatterplot Smoothing) giving a warning that higher temperature anomalies could be coming up.

[ image from earlier post ]

The image below shows that the monthly Atlantic surface temperature anomaly in March 2024 was 1.422°C when compared to a 1901-2000 base.


The high anomalies over the past two months indicate how much heat has accumulated in the Atlantic, and these anomalies are even higher when using a pre-industrial base, as discussed earlier.

The images also highlight the potential for the slowing down of the Atlantic meridional overturning circulation (AMOC) to contribute to more heat accumulating at the surface of the Atlantic Ocean.

Arctic sea ice under threat

As temperatures rise, many feedbacks are kicking in with greater ferocity, including increased stratification of oceans, loss of sea ice, loss of reflectivity of clouds and increased freshwater due to stronger melting of sea ice and glacial ice, due to heavier runoff from land and rivers and due to changes in ocean circulation.

While this may look to cause less ocean heat to reach the Arctic Ocean for now, the result is that a huge amount of ocean heat is accumulating in the North Atlantic that threatens to abruptly move into the Arctic Ocean. The danger is that an influx of ocean heat can cause large amounts of methane to erupt from the seafloor of the Arctic Ocean.

An enormous amount of ocean heat has accumulated and is still further accumulating in the North Atlantic and much of this heat threatens to abruptly move into the Arctic Ocean. The danger is that, due to strong wind along the path of the Gulf Stream and extensions of this current into the Arctic Ocean, huge amounts of ocean heat will abruptly get pushed into the Arctic Ocean, with the influx of ocean heat causing destabilization of hydrates contained in sediments at the seafloor of the Arctic Ocean, resulting in eruptions of huge amounts of methane.

The danger is growing, due to a number of factors. Firstly, the amount of ocean heat in the North Atlantic is increasing. Secondly, Arctic sea ice volume is at record low, implying that there is little or no buffer left to consume ocean heat flowing from the Atlantic Ocean into the Arctic Ocean.

Latent heat is energy associated with a phase change, such as the energy consumed when solid ice turns into water (i.e. melts). During a phase change, the temperature remains constant. Sea ice acts as a buffer that absorbs heat, while keeping the temperature at zero degrees Celsius. As long as there is sea ice in the water, this sea ice will keep absorbing heat, so the temperature doesn't rise at the sea surface.


The amount of energy absorbed by melting ice is as much as it takes to heat an equivalent mass of water from zero to 80°C. 

The danger is that, as the buffer disappears that until now has consumed huge amounts of ocean heat, further heat will reach methane hydrates at the seafloor of the Arctic Ocean, causing them to get destabilized resulting in release of methane from these hydrates and from free gas underneath that was previously sealed by the hydrates.

[ The Buffer has gone, feedback #14 on the Feedbacks page ]

Strong hurricanes can significantly add to the danger. More hurricanes are forecast for the 2024 Atlantic hurricane season than during 1950-2020, as illustrated by the image below, from an earlier post.


Many of the dangers have been discussed in earlier posts, e.g. the danger that sea currents in the Arctic Ocean will change direction was discussed in this 2017 post.

Climate Emergency Declaration

The situation is dire and the precautionary principle calls for rapid, comprehensive and effective action to reduce the damage and to improve the situation, as described in this 2022 post, where needed in combination with a Climate Emergency Declaration, as discussed at this group.


Links

• Climate Reanalyzer
https://climatereanalyzer.org

• NOAA - Ocean temperature anomalies
https://www.ncei.noaa.gov/access/monitoring/climate-at-a-glance/global/time-series/globe/ocean/1/0/2015-2024?filter=true&filterType=loess

• Atlantic ocean heat threatens to unleash methane eruptions
https://arctic-news.blogspot.com/2024/03/atlantic-ocean-heat-threatens-to-unleash-methane-eruptions.html

• Feedbacks in the Arctic
https://arctic-news.blogspot.com/p/feedbacks.html

• North Atlantic heating up
https://arctic-news.blogspot.com/2024/04/north-atlantic-heating-up.html

• Danish Meteorological Institute - Arctic sea ice thickness and volume
https://ocean.dmi.dk/arctic/icethickness/thk.uk.php

• Transforming Society
https://arctic-news.blogspot.com/2022/10/transforming-society.html

• Climate Plan
https://arctic-news.blogspot.com/p/climateplan.html

• Climate Emergency Declaration
https://arctic-news.blogspot.com/p/climate-emergency-declaration.html


Monday, April 29, 2024

Temperature rise in the Tropics (update 4)

The temperature in the Tropics (23.5°S-23.5°N, 0-360°E) reached a new record high on April 23, 2024 of 26.925°C (or 80.47°F). 


The image below shows the monthly temperature anomaly over the past few years through March 2024, when the anomaly reached a record high of 1.448°C (or 2.606°F).  


Note that anomalies in the above image are calculated from 1951-1980 as a base. When calculated from a pre-industrial base, anomalies will be much higher.

The high temperatures are causing widespread damage and are threatening to cause huge loss of life of people, livestock and wildlife, crop failure and ecosystem collapse in the tropics and elsewhere.

Climate Emergency Declaration

The situation is dire and the precautionary principle calls for rapid, comprehensive and effective action to reduce the damage and to improve the situation, as described in this 2022 post, where needed in combination with a Climate Emergency Declaration, as discussed at this group.


Links

• Climate Reanalyzer
https://climatereanalyzer.org

• Pre-industrial
https://arctic-news.blogspot.com/p/pre-industrial.html

• Extinction
https://arctic-news.blogspot.com/p/extinction.html

• Transforming Society
https://arctic-news.blogspot.com/2022/10/transforming-society.html

• Climate Plan
https://arctic-news.blogspot.com/p/climateplan.html

• Climate Emergency Declaration
https://arctic-news.blogspot.com/p/climate-emergency-declaration.html

Posts discussing the temperature rise in the Tropics in 2024 at facebook are at:

Sunday, April 28, 2024

The Orwellian rules-based Climate

By Andrew Glikson

“History is a nightmare from which I am trying to wake” (James Joyce)

Figure 1. Extinctions CC from: The five mass extinctions in Earth History. The rate of the current rise of greenhouse
gas levels and thereby temperatures is higher by more than an order of magnitude than that of previous
mass extinctions. (Figures 11.2, 11.5). Glikson. A.Y., 2023 The Trials of Gaia.

War ─ the mass sacrifice of young generations throughout history, culminating in the barbarism of empires such as the Roman “Pax Romana”, represents the repeated collapse of sanity with transient intervals such as the League of Nations between WWI and the impotent United Nations. More recent bloodsheds such as the Korean, Viet Nam, Rwandan and Middle Eastern wars, along with global heating and nuclear proliferation, herald the collapse of a species dominated by tribalism and the hubris of the 24-hour media cycle ─ A tale full of sound and fury told by an idiot signifying nothing (Macbeth, Shakespeare).

In a human civilization dominated by mega-empires, armed to the teeth with planet-killer weapons, ruled by military juntas, industrial military complexes, Earth-poisoning energy corporations, multi-billionaires and media tycoon, the concept of “democracy” provides a fig leaf covering exploitation, repression and massacres.

The potential consequences of a nuclear war appear to have escaped the mainstream media attention. There is little evidence of peace negotiations between the major adversaries and measures of averting accidental conflagrations, whether human error or the failure of a computer chip, have been minimized. Having betrayed the prospect of a peaceful future, the warring parties keep investing in $trillion-scale re-armament, covered by sophisticated terms such as self-defence, stability and the rules-based international order.

Purporting a climate catastrophe can be averted by development of alternative energy despite a rise in the production of fossil fuels, growing emission of greenhouse gases (~4 ppm/year in 2023-2024), the rise in global temperatures toward +4 degrees Celsius above preindustrial levels and the spate of extreme weather events. A nuclear armada aimed at all advanced life is expanded into space while the young generation is occupied with Tik-Tok games.

According to climate science authorities (Hansen et al., 2016) “Burning all fossil fuels would create a different planet than the one that humanity knows. The paleo-climate record and ongoing climate change make it clear that the climate system would be pushed beyond tipping points, setting in motion irreversible changes, including ice sheet disintegration with a continually adjusting shoreline, extermination of a substantial fraction of species on the planet, and increasingly devastating regional climate extremes”.

According to Baronsky et al. (2017)Localized ecological systems are known to shift abruptly and irreversibly from one state to another when they are forced across critical thresholds. Here we review evidence the global ecosystem as a whole can react in the same way and is approaching a planetary-scale critical transition as a result of human influence.” and “Climates found at present on 10–48 % of the planet are projected to disappear within a century ... The mean global temperature by 2070, or possibly a few decades earlier, will be higher than it has been since the human species evolved”.

Nor would the oceans fare better. According to Veron (2008): “The five mass extinction events that the earth has so far experienced have impacted coral reefs as much or more than any other major ecosystem. Each has left the Earth without living reefs for at least four million years, intervals so great that they are commonly referred to as ‘reef gaps’. The prospect of ocean acidification is potentially the most serious of all predicted outcomes of anthropogenic carbon dioxide increase. This study concludes that acidification has the potential to trigger a sixth mass extinction event and to do so independently of anthropogenic extinctions that are currently taking place.

Alas, a majority of the world’s 8.1 billion humans is only partly aware of the looming demise of human civilization in the wake of its near to 10 millennia history and of the mass extinction of advanced species, allowing the “powers that be” to perpetrate the biggest crime against humanity and nature in history (Figure 2). 

Figure 2. Henry Fuseli, The Nightmare (1781), in the Institute of Fine Arts, Detroit. Source: https://commons.wikimedia.org/wiki/File:John_Henry_Fuseli_-_The_Nightmare.JPG


A/Prof. Andrew Y Glikson
Earth and climate scientist

Andrew Glikson
Books:

The Asteroid Impact Connection of Planetary Evolution
https://www.springer.com/gp/book/9789400763272
The Archaean: Geological and Geochemical Windows into the Early Earth
https://www.springer.com/gp/book/9783319079073
The Plutocene: Blueprints for a Post-Anthropocene Greenhouse Earth
https://www.springer.com/gp/book/9783319572369
The Event Horizon: Homo Prometheus and the Climate Catastrophe
https://www.springer.com/gp/book/9783030547332
Climate, Fire and Human Evolution: The Deep Time Dimensions of the Anthropocene
https://www.springer.com/gp/book/9783319225111
Evolution of the Atmosphere, Fire and the Anthropocene Climate Event Horizon
https://www.springer.com/gp/book/9789400773318
From Stars to Brains: Milestones in the Planetary Evolution of Life and Intelligence
https://www.springer.com/us/book/9783030106027
Asteroids Impacts, Crustal Evolution and Related Mineral Systems with Special Reference to Australia
https://www.springer.com/us/book/9783319745442
The Fatal Species: From Warlike Primates to Planetary Mass Extinction
https://www.springer.com/gp/book/9783030754679
The Trials of Gaia. Milestones in the evolution of Earth with reference to the Antropocene
https://www.amazon.com.au/Trials-Gaia-Milestones-Evolution-Anthropocene/dp/3031237080


Saturday, April 27, 2024

CO2 keeps accelerating

The Scripps Institution of Oceanography, UC San Diego, reported a daily average carbon dioxide (CO₂) at Mauna Loa, Hawaii, of 428.63 parts per million (ppm) on April 26, 2024, as illustrated by the image below. 

This is the highest daily average on record at Mauna Loa, which is the more remarkable since the annual CO₂ maximum is typically reached in May, so even higher values are likely to be reached over the next few weeks. 

The image below, adapted from NOAA, shows that the weekly mean CO₂ at Mauna Loa was 427.94 ppm for the week beginning on April 21, 2024, i.e. 3.98 ppm higher than the 423.96 ppm for the week 1 year earlier.

The image below, adapted from NOAA, shows that the daily mean CO₂ at Mauna Loa on April 26, 2024, was 428.59 ppm, a difference of 4.7 ppm from April 26, 2023.


The image below, adapted from NOAA, shows that the annual CO₂ growth at Mauna Loa in 2023 was 3.36 ppm, the highest annual growth on record.

The image below shows the daily average carbon dioxide recorded by NOAA over the past few years at Mauna Loa, Hawaii. 

Clouds Tipping Point

The image below illustrates that a polynomial trend (red) follows the recent acceleration in CO₂ concentration in the atmosphere more than a linear trend (blue). Data used are NOAA Mauna Loa weekly average CO₂ data through the week starting on April 21, 2024 (data downloaded April 28, 2024). 


The image below is the same as the image above, except that the canvas is zoomed out to show all data on record with trends extended to 2060 (X-axis) and CO₂ concentration going from 300 ppm to 1200 ppm (Y-axis). 


The red polynomial trend also illustrates how rising CO₂ can cause the clouds tipping point at 1200 ppm to be crossed well before 2060, i.e. earlier than anticipated in IPCC models (inset).

Moreover, the clouds tipping point could be crossed much earlier than 2060 when also taking into account methane. Peak daily average methane is approaching 2000 parts per billion (ppb) at Mauna Loa, Hawaii, as illustrated by the image below.


A methane concentration of 2000 ppb corresponds, at a Global Warming Potential (GWP) of 200, with a carbon dioxide equivalent (CO₂e) of 400 ppm. Together with the above daily average CO₂ concentration of 428.63 ppm this adds up to a joint CO₂e of 828.63 ppm, i.e. only 371.37 ppm away from the clouds tipping point (at 1200 ppm CO₂e) that on its own could raise the global temperature by 8°C.

This 371.37 ppm CO₂e could be added almost immediately by a burst of seafloor methane less than the size of the methane that is currently in the atmosphere (about 5 Gt). There is plenty of potential for such an abrupt release, given the rising ocean heat and the vast amounts of methane present in vulnerable sediments at the seafloor of the Arctic Ocean, as discussed in earlier posts such as this one.

Already now, local peaks can at times reach very high levels. The image below shows that the NOAA-20 satellite recorded a peak level of 2432 ppb at 399.1 mb on April 25, 2024, am. 


The MetOp-B satellite (also known as MetOp-1) recorded a peak methane level of 3644 ppb and a mean level of 1944 ppb at 367 mb on November 21, 2021, pm, as illustrated by the image below. 
[ from earlier post ]
[ from earlier post ]
Catastrophic crack propagation is what makes a balloon pop. Could low-lying clouds similarly break up and vanish abruptly? Could peak greenhouse gas concentrations in one spot break up droplets into water vapor, thus raising CO₂e and propagating break-up of more droplets, etc., to shatter entire clouds?

Could a combination of high CO₂ levels and high peak levels of methane suffice to cause the clouds tipping point to be crossed?

Moreover, nitrous oxide is also rising and there are additional elements that could further speed up the rise in CO₂e, as discussed at the Extinction page and this earlier post that warn about the potential for a temperature rise of well over 18°C to unfold as early as 2026.

A 2018 study (by Strona & Bradshaw) indicates that most life on Earth will disappear with a 5°C rise. Humans, who depend for their survival on many other species, will likely go extinct with a 3°C rise, as illustrated by the image below, from an earlier post.


Environmental crimes

The accelerating growth in carbon dioxide indicates that politicians have failed and are failing to take adequate action. 

Current laws punish people for the most trivial things, while leaving the largest crime one can imagine unpunished: planetary omnicide!

[ from earlier post ]

The image below is from the post Planetwide Ecocide - The Crime Against Life on Earth, by Andrew Glikson


If we accept that crimes against humanity include climate crimes, then politicians who inadequately act on the unfolding climate catastrophe are committing crimes against humanity and they should be brought before the International Criminal Court in The Hague, the Netherlands.

[ image from earlier post ]

Climate Emergency Declaration

The situation is dire and the precautionary principle calls for rapid, comprehensive and effective action to reduce the damage and to improve the situation, as described in this 2022 post, where needed in combination with a Climate Emergency Declaration, as discussed at this group.


Links

• NOAA - Carbon Cycle Gases - Mauna Loa, Hawaii, United States
https://gml.noaa.gov/dv/iadv/graph.php?code=MLO&program=ccgg&type=ts

• Scripps Institution of Oceanography
https://keelingcurve.ucsd.edu

• NOAA - Weekly average CO2 at Mauna Loa 
https://gml.noaa.gov/ccgg/trends/weekly.html

• NOAA - annual mean carbon dioxide growth rates for Mauna Loa
https://gml.noaa.gov/ccgg/trends/gr.html

• NOAA - greenhouse gases at Mauna Loa 

• How long do we have?
https://arctic-news.blogspot.com/2019/04/how-long-do-we-have.html


• Blue Ocean Event 2024?

• Potential temperature trends

• Co-extinctions annihilate planetary life during extreme environmental change, by Giovanni Strona and Corey Bradshaw (2018)
https://www.nature.com/articles/s41598-018-35068-1

• CO2 rise is accelerating


Friday, April 26, 2024

Temperature rise in the Tropics (update 3)

The temperature in the Tropics (23.5°S-23.5°N, 0-360°E) reached a new record high on April 20, 2024 of 26.913°C (or 80.44°F). 


The image below shows the monthly temperature anomaly over the past few years through March 2024, when the anomaly reached a record high of 1.448°C (or 2.606°F).  


Note that anomalies in the above image are calculated from 1951-1980 as a base. When calculated from a pre-industrial base, anomalies will be much higher.

The rise in temperature threatens to cause widespread loss of life of people, livestock and wildlife, crop failure and ecosystem collapse in the tropics.

Climate Emergency Declaration

The situation is dire and the precautionary principle calls for rapid, comprehensive and effective action to reduce the damage and to improve the situation, as described in this 2022 post, where needed in combination with a Climate Emergency Declaration, as discussed at this group.


Links

• Climate Reanalyzer
https://climatereanalyzer.org

• Pre-industrial
https://arctic-news.blogspot.com/p/pre-industrial.html

• Extinction
https://arctic-news.blogspot.com/p/extinction.html

• Transforming Society
https://arctic-news.blogspot.com/2022/10/transforming-society.html

• Climate Plan
https://arctic-news.blogspot.com/p/climateplan.html

• Climate Emergency Declaration
https://arctic-news.blogspot.com/p/climate-emergency-declaration.html

Posts about the temperature rise in the Tropics in 2024 at facebook are at:

Friday, April 12, 2024

North Atlantic heating up

Sea surface temperature at record high

The image below, created with Climate Reanalyzer screenshots, shows that the sea surface temperature (SST 60°S - 60°N mean) was 21.2°C on April 24, 2024, reaching yet another record high.

These record high sea surface temperatures are reached as long-term sea surface temperatures are falling and as El Niño is predicted to weaken, which is fueling fears that feedbacks are kicking in with accelerating ferocity. 

The image below, adapted from NOAA, shows global ocean temperature anomalies from 1901-2000, with the green line (LOcally Estimated Scatterplot Smoothing) giving a warning that higher temperature anomalies could be coming up. 

The image below, adapted from Copernicus, shows March 2024 sea surface temperature anomalies from 1991-2020. High anomalies show up, especially around the Equator which can be expected given that the amount of sunlight there is highest at this time of year. 


Carbon dioxide at Mauna Loa reaches new record high

The daily average carbon dioxide at Mauna Loa, Hawaii, was 428.42 ppm on April 24, 2024. To find carbon dioxide levels this high, one needs to go back millions of years.  


The above image shows hourly (red) and daily (yellow) carbon dioxide averages at Mauna Loa for the last 31 days. 


This carbon dioxide level of 428.42 ppm reached on April 24, 2024, is 4.45 ppm higher than the level on April 24, 2023, as the above image shows.

North Atlantic heating up

The North Atlantic Ocean is now heating up rapidly, as more sunlight is starting to reach the Northern Hemisphere. The image below, adapted from Climate Reanalyzer, shows sea surface temperatures up to April 23, 2024. The image shows that 2024 temperatures have been significantly higher than 2023 temperatures for the same dates. The annual maximum temperature in 2023 was reached on August 31. Temperatures can be expected to rise dramatically over the next few months, in line with the change in seasons. 

Much will depend on the strength of the current El Niño over the next few months and El Niño is predicted to weaken, but as said there are fears that feedbacks are kicking in with accelerating ferocity. The image below, adapted from NOAA, shows monthly temperature anomalies versus 1901-2000 through March 2024, colored by El Niño/La Niña conditions. 


NOAA warns that there is a bit of a delay in the effects of any given ENSO phase. So, the first part of this year will still be influenced by El Niño, which is in part why NOAA predicts a 55% chance that 2024 will be hotter than 2023.

Further factors (other than El Niño) may continue to accelerate the temperature rise, as discussed in earlier posts such as this one. One danger is that, due to strong wind along the path of the Gulf Stream, huge amounts of ocean heat will abruptly get pushed into the Arctic Ocean, with the influx of ocean heat causing destabilization of hydrates contained in sediments at the seafloor of the Arctic Ocean, resulting in eruptions of huge amounts of methane, as discussed in earlier posts such as this one.

Arctic sea ice getting very thin

The image below indicates that Arctic sea ice volume has recently been the lowest on record for the time of year.

Given that Arctic sea ice currently is still relatively extensive, this low volume indicates that sea ice is indeed very thin, which must be caused by ocean heat melting sea ice from below, since little or no sunshine is yet reaching the Arctic at the moment and air temperatures are still far below freezing point, so where ocean heat may be melting sea ice away from below, a thin layer of ice will quickly be reestablished at the surface.

This situation looks set to dramatically change over the next few months, as air temperatures will rise and as more ocean heat will reach the Arctic Ocean. Moreover, as illustrated by the map below, much of the thicker sea ice is located off the east coast of Greenland. This sea ice and the purple-colored sea ice can be expected to melt away quickly with the upcoming rise in temperatures over the next few months.


The image below warns that sea ice in a large area from the Laptev Sea down to the North Pole may be very thin. 

Climate Emergency Declaration

The situation is dire and the precautionary principle calls for rapid, comprehensive and effective action to reduce the damage and to improve the situation, as described in this 2022 post, where needed in combination with a Climate Emergency Declaration, as discussed at this group.


Links

• Climate Reanalyzer
https://climatereanalyzer.org

• NOAA - Ocean temperature anomalies
https://www.ncei.noaa.gov/access/monitoring/climate-at-a-glance/global/time-series/globe/ocean/1/0/2015-2024?filter=true&filterType=loess

• Copernicus sea surface temperature anomalies
https://pulse.climate.copernicus.eu

• NOAA - Monthly Temperature Anomalies Versus El Niño
https://www.ncei.noaa.gov/access/monitoring/monthly-report/global/202403/supplemental/page-4

• NOAA - ENSO update 
https://www.facebook.com/NOAAClimateGov/posts/821505663344434
also discussed at facebook at: https://www.facebook.com/groups/arcticnews/posts/10161353804294679

• Did the climate experience a Regime Change in 2023?
https://arctic-news.blogspot.com/2024/04/did-the-climate-experience-a-regime-change-in-2023.html

• Atlantic ocean heat threatens to unleash methane eruptions
https://arctic-news.blogspot.com/2024/03/atlantic-ocean-heat-threatens-to-unleash-methane-eruptions.html

• University of Bremen - Arctic sea ice
https://seaice.uni-bremen.de/start

• Danish Meteorological Institute - Arctic sea ice thickness and volume
https://ocean.dmi.dk/arctic/icethickness/thk.uk.php

• Transforming Society
https://arctic-news.blogspot.com/2022/10/transforming-society.html

• Climate Plan
https://arctic-news.blogspot.com/p/climateplan.html

• Climate Emergency Declaration
https://arctic-news.blogspot.com/p/climate-emergency-declaration.html


Tuesday, April 9, 2024

Did the climate experience a Regime Change in 2023?

The astonishing recent rise in temperatures makes one wonder whether a Regime Change did take place in 2023. 

The February 2024 temperature was 1.76°C above 1885-1915, potentially 2.75°C above pre-industrial (bright yellow inset right). The image was created by Sam Carana for Arctic-news.blogspot.com with an April 2024 data.giss.nasa.gov screenshot. The red line (6 months Lowess smoothing) highlights the Regime Change that may have occurred in 2023.

Meanwhile, NASA has released details for the March 2024 temperature, which was slightly lower (1.69°C above 1885-1915) than the February 2024 temperature (1.76°C above 1885-1915). Yet, the recent acceleration of the temperature rise has hardly changed, as highlighted by the red line. The question is whether this red line will continue with this steep rise.

The image below, created with NASA Land+Ocean monthly mean global temperature anomalies versus a 1900-1923 custom base, further adjusted by 0.99°C to reflect ocean air temperatures, higher polar anomalies and a pre-industrial base.

[ from earlier post ]

The above image shows a magenta trend that points at the temperature crossing 3°C above pre-industrial later this year (2024).

What could have caused such a steep rise? Of course, short-term variables such as El Niño did have a strong impact. However, sea surface temperatures have risen hugely for more than a year, far exceeding the temperatures of 2016, which was a strong El Niño year. This indicates that there must be other factors involved in the recent rise.

The image below shows world daily sea surface temperatures (60°S-60°N) through April 8, 2024. 


For more than a year, sea surface temperatures have been much higher than in any previous year on record, as if temperatures suddenly shifted into another gear and the climate experienced a Regime Change in 2023.

[ from the Extinction page ]
The top image illustrates that the temperature rise since pre-industrial could be as large as 2.75°C, as also discussed at the pre-industrial page. The extinction page points out that such a rise corresponds with almost ⅕ more water vapor in the atmosphere.

This increase in water vapor in the atmosphere is a self-reinforcing feedback, since water vapor is a powerful greenhouse gas, accelerating the temperature rise (as illustrated by the image on the right).

There is no single feedback behind the recent steep rise, instead there are numerous non-linear, self-reinforcing feedbacks that can all contribute, interact and start to kick in with greater ferocity, amplifying and accelerating the rise.

Such feedbacks include water vapor, storms, ocean stratification, loss of sea ice, loss of reflectivity of clouds and freshwater accumulating at the surface of oceans, due to stronger ice melting, due to heavier runoff from land and rivers and due to changes in wind patterns and ocean currents and circulation. Furthermore, developments such as the reduction in sulfur emissions from shipping over the past few years further push up the temperature rise.

Altogether, the temperature rise may exceed 18°C from pre-industrial by as early as 2026, as discussed at the Extinction page.

Climate Emergency Declaration

The situation is dire and the precautionary principle calls for rapid, comprehensive and effective action to reduce the damage and to improve the situation, as described in this 2022 post, where needed in combination with a Climate Emergency Declaration, as discussed at this group.


Links

• NASA - datasets and images
https://data.giss.nasa.gov

• Climate Reanalyzer
https://climatereanalyzer.org

• Pre-industrial
https://arctic-news.blogspot.com/p/pre-industrial.html

• Extinction
https://arctic-news.blogspot.com/p/extinction.html

• Jet Stream
https://arctic-news.blogspot.com/p/jet-stream.html


• Arctic Ocean Feedbacks