Showing posts with label loss. Show all posts

Sunday, June 5, 2022

Cataclysmic Alignment

Record high carbon dioxide

The concentration of carbon dioxide (CO₂) in the atmosphere recently broke two records at Mauna Loa, Hawaii, CO₂ was 421.63 in the week starting May 29, 2022, while CO₂ was 420.99 ppm in May 2022.


Earlier, very high daily and hourly measurements were recorded at Mauna Loa, as illustrated by the image below, showing one hourly measurement of 424 ppm (on May 28, 2022), as well as sequences of daily measurements in the green insets.


The image below shows carbon dioxide concentration rising over the past few years, with surface flask measurements well above 422 ppm at Mauna Loa recently.


Carbon dioxide concentration is even higher over the Arctic. The image below shows carbon dioxide approaching 430 ppm at Barrow, Alaska.


To get an idea how much greenhouse gases have risen, a 2021 study points at concentrations of 190 ppm for CO₂, 370-375 ppb for CH₄ and 200-245 ppb for N₂O some 18 ka to 21 ka. By comparison, the MetOp image below shows a global mean methane level of 1951 ppb, which is more than five times as high, while the image also shows a peak of 2405 ppb, at 293 mb on June 7, 2022 pm.  


The MetOp image below shows a lot of methane over the Arctic on May 30, 2022 pm, at 742 mb, which is much closer to sea level. 


The NOAA 20 image below shows high nitrous oxide levels over the Arctic on June 3, 2022 pm at 1000 mb.


Greenhouse gas levels are very high and there are many further indications that a huge temperature rise could take place over the next few years. 

Cataclysmic alignment of El Niño and sunspots 

The trigger for such a huge rise could be a cataclysmic alignment of the upcoming El Niño with a high number of sunspots, which look set to reach maximum impact around July 2025.

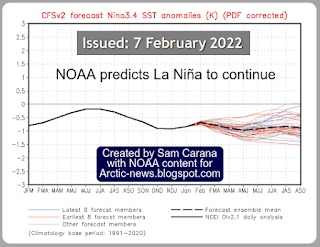
We are currently in the depths of a persistent La Niña, as illustrated by the image on the right, adapted from NOAA. This suppresses the temperature rise.

El Niños typically occur every 3 to 5 years, according to NOAA and as also illustrated by the NOAA image below, so the upcoming El Niño can be expected to occur soon.


The above NOAA image indicates that going from the bottom of a La Niña to the peak of an El Niño could make a difference of more than half a degree Celsius (0.5°C or 0.9°F). 

A huge temperature rise looks set to unfold soon, first of all in the Arctic, triggered by the combined impact of an upcoming El Niño and a peak in sunspots.
 
Sunspots are currently well above what NOAA predicted, as illustrated by the image on the right, adapted from NOAA

The more sunspot, the more the temperature goes up. The rise in sunspots from May 2020 to July 2025 could make a difference of some 0.15°C (0.27°F).

The next El Niño looks set to line up with a high peak in sunspots, in a cataclysmic alignment that could push up the temperature enough to cause dramatic sea ice loss in the Arctic, resulting in runaway temperature rise by 2026.

A huge temperature rise in the Arctic

There are many further indications that we're on the brink of a huge temperature rise in the Arctic.

Ocean heat that enters the Arctic Ocean from the Atlantic Ocean and the Pacific Ocean keeps rising.

[ see also more background at the Extinction page ]
As a result, several tipping points threaten to be crossed in the Arctic soon, as described in an earlier post, including the latent heat tipping point and a Blue Ocean Event (starting when Arctic sea ice extent will fall below 1 million km²), which would further speed up the temperature rise in the Arctic.

As temperatures keep rising in the Arctic, changes to the Jet Stream look set to intensify, resulting in loss of terrestrial albedo in the Arctic that could equal the albedo loss resulting from sea ice decline.

Further feedbacks include permafrost degradation, both terrestrial and on the seafloor of the Arctic Ocean, which looks set to cause huge releases of greenhouse gases (particularly CO₂, CH₄ and N₂O).

This would in turn also cause more water vapor to enter the atmosphere, further speeding up the temperature rise, especially in the Arctic, where vast amounts of methane are contained in sediments at the seafloor and where there is very little hydroxyl in the air to break down the methane.

Temperatures look set to rise further in the Arctic, due to falling away of sulfate aerosols, as illustrated by the IPCC image below that shows how much temperatures are currently suppressed in the Arctic due to aerosols and thus also shows how much temperatures in the Arctic look set to rise as the aerosol masking effect falls away.  

Conversely, there could be a temperature rise due to releases of other aerosols that have a net warming impact, such as black and brown carbon, which can increase dramatically as more wood burning, forest fires and urban fires take place, which again would hit the Arctic hard by darkening the surface as they settle on the snow and ice cover, thus speeding up its decline. 


Furthermore, the combined impact of aerosols and nitrogen fertilizers has been underestimated; a recent study concludes that when ammonia, nitric acid and sulfuric acid are present together, they contribute strongly to the formation of cirrus clouds. 

Global temperature rise

As the temperature keeps rising, further self-reinforcing feedbacks will kick in with more ferocity such as an increase in water vapor globally combined with a decrease in lower clouds decks, further increasing the temperature, as described at the clouds feedback page.

Altogether, the global temperature could rise by more than 18°C above pre-industrial, as illustrated by the image further above on the right, and as also discussed at the Extinction page.

Human extinction by 2025?

[ from earlier post ]
 
[ from earlier post ]
An April 2022 analysis found that the temperature rise from pre-industrial to March 2022 could be as much as 2.35°C. When adding 0.65°C for the joint impact of the upcoming El Niño and a peak in sunspots, the rise could be as much as 3°C by 2025, as also depicted in the image on the right, from that same analysis

A 2018 study (by Strona & Bradshaw) indicates that most life on Earth will disappear with a 5°C rise. Humans, who depend for their survival on many other species, will likely go extinct with a 3°C rise, as illustrated by the image below, from an earlier post.


Rise beyond 2026

As said, a temperature rise of 3°C from pre-industrial could be reached by 2025 just due to the combined push of the upcoming El Niño and a peak in sunspots, i.e. without change in other forcers.

What would happen if just methane kept rising, i.e. without change in other forcers? The image below shows methane with a trend added that points at a rise that could represent a forcing of 780 ppm CO₂e in 2028, which means that the clouds tipping point at 1200 ppm CO₂e would be crossed by methane and carbon dioxide alone (assuming no change in other forcers and with carbon dioxide remaining at 421 ppm), which would cause an additional 8°C rise in temperature. 


The above image shows that such a trend is contained in existing methane data. When also adding a large eruption of methane from the seafloor of the Arctic Ocean, the situation would be even worse, further underlining the potential for a rise of more than 18°C by 2026. 

Conclusion

In conclusion, temperatures could rise strongly soon, driving humans extinct as early as in 2025, while temperatures could skyrocket in 2026, making it in many respects rather futile to speculate about what will happen beyond 2026. At the same time, the right thing to do now is to help avoid the worst things from happening, through comprehensive and effective action as described in the Climate Plan.

In the video below, Jennifer Hynes and Sandy Schoelles discuss the situation.


Links

• NOAA - Global Monitoring Laboratory, Recent Daily Average CO₂ at Mauna Loa, Hawaii, U.S.
https://gml.noaa.gov/ccgg/trends

• NOAA - Global Monitoring Laboratory, at Barrow, Alaska, U.S.
https://gml.noaa.gov/dv/iadv/graph.php?code=BRW&program=ccgg&type=ts

• Globally resolved surface temperatures since the Last Glacial Maximum - by Matthew Osman et al. (2021)
https://www.nature.com/articles/s41586-021-03984-4

• Arctic Hit By Ten Tipping Points
https://arctic-news.blogspot.com/2020/04/arctic-hit-by-ten-tipping-points.html

• NOAA - ENSO: Recent Evolution, Current Status and Predictions
https://www.cpc.ncep.noaa.gov/products/analysis_monitoring/lanina/enso_evolution-status-fcsts-web.pdf

• NOAA - El Niño
https://www.noaa.gov/education/resource-collections/weather-atmosphere/el-nino#:~:text=An%20El%20Ni%C3%B1o%20condition%20occurs,every%203%20to%205%20years.

• NOAA - Monthly Temperature Anomalies Versus El Niño
https://www.ncei.noaa.gov/access/monitoring/monthly-report/global/202204/supplemental/page-4

• MetOp satellite
https://www.ospo.noaa.gov/Products/atmosphere/soundings/iasi

• NOAA 20 satellite
https://www.ospo.noaa.gov/Products/atmosphere/soundings/nucaps/NUCAPS_composite.html

• Ten temperature rise indications
https://engineering.cmu.edu/.../05/18-ammonia-emissions.html

• How ice clouds develop – Asian monsoon influences large parts of the Northern Hemisphere https://aktuelles.uni-frankfurt.de/.../how-ice-clouds...

• Synergistic HNO3 H2SO4 NH3 upper tropospheric particle formation - by Mingyi Wang et al. https://www.nature.com/articles/s41586-022-04605-4

• Clouds feedback and tipping point
https://arctic-news.blogspot.com/p/clouds-feedback.html

• Jet Stream
https://arctic-news.blogspot.com/p/jet-stream.html

• The Importance of Methane
https://arctic-news.blogspot.com/p/the-importance-of-methane-in-climate.html

• Pre-industrial

• Runaway temperature rise by 2026?
https://arctic-news.blogspot.com/2022/04/runaway-temperature-rise-by-2026.html

• Co-extinctions annihilate planetary life during extreme environmental change - by Giovanni Strona and Corey Bradshaw (2018) 


Wednesday, February 9, 2022

Accelerating loss of global snow and ice cover


Ocean heat is at record levels. As a result, global sea ice extent was only 16.23 million km² on February 9, 2022, the third lowest extent on record. What makes this even more worrying is that we're currently in the depth of a persistent La Niña.


Antarctic sea ice at lowest extent on record since start satellite measurements

Ocean heat is a huge threat for Antarctica at the moment. The image below shows that Antarctic sea ice extent was only 2.091 million km² on February 16, 2022, the lowest on record since the start of satellite measurements.


Ocean heat is reducing the sea ice around Antarctica and is getting underneath floating sea ice. 

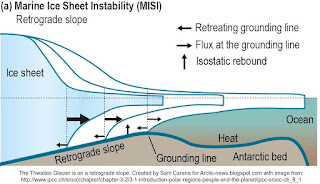
The Thwaites Glacier, which is on a retrograde slope, is especially vulnerable to collapse. 

The Thwaites Glacier contains enough ice to raise global sea levels by 65 cm (25.59 inches) if it were to completely collapse.

The animation on the right, created with images from Climate Reanalyzer, shows the retreat of the Antarctic snow and ice cover from January 5 to February 18, 2021. 

The animation underneath, by navy.mil, shows sea ice thickness over 30 days up to February 17, 2022 (with 8 days of forecasts added).

Another danger of a rapid loss of the snow and ice cover on Antarctica is release of methane. Jemma Wadham warned about this in a 2012 study, as discussed at the post methane hydrates. More recently, Jemma Wadham said: “We are sleepwalking into a catastrophe for humanity.

The Thwaites Glacier is often called the Doomsday Glacier because if it collapses it would lead to vast sea level rise, and scientists believe it is likely to fail within a few years, says Cliff Seruntine (the Naturalist) in the video below. 


A recent study concludes that mountain glaciers may hold less ice than previously thought. Their disappearance means less water for drinking and agriculture, and faster temperature rises due to albedo loss. While the study found that the Himalayas contain more water than thought, another recent study, Mt. Everest’s highest glacier is a sentinel for accelerating ice loss, describes how human-induced climate change has a huge impact on the highest reaches of the planet.

The outlook for the Arctic is most threatening, as the post methane hydrates also concluded back in 2013, as described in numerous post here at Arctic-news and as discussed in the video below by Jim Massa.


A huge temperature rise threatens to unfold soon


Above image indicates that the difference between the top of El Niño and the bottom of La Niña could be more than half a degree Celsius.

As said, we're currently in the depth of a persistent La Niña, which suppresses temperatures. As the temperature keeps rising, ever more frequent strong El Niño events are likely to occur, as discussed in an earlier post

A 2019 study analyzes how tipping the ENSO into a permanent El Niño can trigger state transitions in global terrestrial ecosystems.

Currently, the temperature rise is additionally suppressed by low sunspots. Within a few years time, sunspots can be expected to reach the peak of their current cycle and observed sunspots are looking stronger than predicted. 

In the image below on the right, adapted from NOAA, the solar cycle is represented as the number of sunspots (top) and F10.7cm radio flux (bottom). 

In a recent communication, James Hansen repeats that, as reductions take place in the sulfate aerosols that are currently co-emitted by traffic, transport and industry, this is causing the current temperature rise to accelerate and could cause further rapid global warming, referred to in a 2021 presentation as a termination shock.

Furthermore, in addition to a huge temperature rise resulting from sulfate aerosols falling away, there could be a further rise in temperature as a result of releases of other aerosols with a net warming impact, such as black and brown carbon, which can increase dramatically as more wood burning and forest fires take place.

In summary, while the temperatures are accelerating, we'll soon be moving into the next El Niño, with sunspots moving toward a peak, with sulfate aerosols causing a termination shock and with other aerosols further driving up the temperature rise. 

Stop the deception!

In a giant scheme of deception, the temperature rise is all too often presented with images of people playing on the beach on a 'warm' day, as if 'global warming' was making life more 'comfortable'. 

Forest fires are called 'wildfires', biomass burning and associated deforestation is referred to as 'renewable biofuel', fracking-induced earthquakes are called 'natural' disasters and methane eruptions are called seeps and bubbles of 'natural' gas from 'natural' sources such as wetlands. 

This gives the false impression that this was somehow 'natural' as if human activities had nothing to do with it, and as if owning beach-front property was becoming ever more attractive.


Let's stop this deception! In reality, human-caused emissions have a huge short-term impact on temperature and their combination with genuinely natural variability such as El Niño and sunspots can act as a catalyst, causing numerous feedbacks to kick in with ever greater ferocity. 

This can result in collapse of global sea ice and permafrost, resulting in albedo loss and eruption of huge quantities of carbon dioxide, methane and nitrous oxide, further driving up the temperature rise abruptly, as described at the extinction page. Further feedbacks are also described at the feedbacks page

Conclusion

The situation is dire and calls for the most comprehensive and effective action, as described at the Climate Plan.


Links

• Another Record: Ocean Warming Continues through 2021 despite La Niña Conditions - by Lijing Cheng et al. 
https://link.springer.com/article/10.1007%2Fs00376-022-1461-3

• Ocean heat is at record levels, with major consequences - by Kevin Trenberth

• Arctic Data archive System - Vishop extent

• NSIDC: Charctic Interactive Sea Ice Graph

• IPCC: Marine Ice Sheet Instability

• Climate Reanalyzer
https://climatereanalyzer.org/wx/DailySummary/#seaice-snowc-topo

• Antarctica CICE ice thickness

• Antarctica’s ‘doomsday’ glacier: how its collapse could trigger global floods and swallow islands 
https://theconversation.com/antarcticas-doomsday-glacier-how-its-collapse-could-trigger-global-floods-and-swallow-islands-173940

• Methane hydrates (2013)

• Potential methane reservoirs beneath Antarctica - by Jemma Wadham et al. (2012) 
https://www.nature.com/articles/nature11374

• A new frontier in climate change science: connections between ice sheets, carbon and food webs (2021) 

• Ice velocity and thickness of the world’s glaciers - by Romain Millan et al. 
https://www.nature.com/articles/s41561-021-00885-z

• Mountain glaciers may hold less ice than previously thought – here’s what that means for 2 billion downstream water users and sea level rise 
https://theconversation.com/mountain-glaciers-may-hold-less-ice-than-previously-thought-heres-what-that-means-for-2-billion-downstream-water-users-and-sea-level-rise-176514

• Mt. Everest’s highest glacier is a sentinel for accelerating ice loss - by Mariusz Potocki et al. 

• Human-induced climate change impacts the highest reaches of the planet — Mount Everest
• Ocean Heat Content Update 1 - 2022 - Science Talk with Jim Massa
https://www.youtube.com/watch?v=pctkg_LDqcU

• NOAA - ENSO: Recent Evolution, Current Status and Predictions
https://www.cpc.ncep.noaa.gov/products/analysis_monitoring/lanina/enso_evolution-status-fcsts-web.pdf

• NOAA - Monthly Temperature Anomalies Versus El Niño 
• Human Extinction by 2022? 

• Tipping the ENSO into a permanent El Niño can trigger state transitions in global terrestrial ecosystems - by Mateo Duque-Villegas et al. (2019) 
https://esd.copernicus.org/articles/10/631/2019

• James Hansen - The New Horse Race

• Climate Impact of Decreasing Atmospheric Sulphate Aerosols and the Risk of a Termination Shock - by Leon Simons, James Hansen and Yann duFournet (2021) 

• NOAA - Solar Cycle Progression

• Aerosols

• Feedbacks

• Extinction


Thursday, April 4, 2013

Advice for Parents at the End of the World

Douglas Spence -
Software Engineer and
concerned citizen
by Douglas Spence

The state of things today

We are in the early stages of an abrupt climate shift, driven initially by the disappearing Arctic albedo from sea ice and land snowpack. There are multiple other positive feedbacks set to come into play in the near future. We may have passed the point of no return where not even an immediate decision to deploy geoengineering could buy more time - and even if we did manage to buy more time - the prognosis for it being used to prevent the problem still looks very poor.

There is every chance that this will lead to the loss of global civilisation - widespread conflict and famine and general unpleasantness on a global scale. It is likely that this process will start in earnest sooner than it is comfortable to contemplate and be far worse than most people are capable of imagining. It is likely most people will perish.

While I think one should not entirely give up on averting catastrophe I think a realistic world view requires that one accept the possibility of failure and work on handling it. So what to do?

Simple Steps

The first thing to do is to stop being a passive observer. I encounter an increasing number of people who seem to intellectually grasp that we're in a very serious mess but who change nothing in their lives. Instead they either push it to the back of their mind as a tomorrow problem, or passively consume information on the internet or television and stare transfixed as the crash unfolds. So the first thing is to start - today, not tomorrow. Even today is really a bit late, but tomorrow is to declare your future not to be worth your effort.

The second thing is to arrive at a basic strategy. I can't tell you what form that will take as it depends a great deal upon your situation - where and how you currently live. I can say that there is plenty of straight-forward survivalist advice out there that will give you a good starting point. The hierarchy of needs - food, water, shelter - and so on. You need to determine how you will achieve those in a collapse scenario. Be careful to be realistic in determining how you will achieve them. If your plan is to travel into the mountains and hunt wildlife remember millions of other people will have the same idea. It may not be a realistic plan. The basics of surviving are a pre-requisite to anything else. In my opinion the ideal is to get into a remote region where the ratio of population to natural resource is favourable and where it is effectively inaccessible to most other people.

The third thing is to understand the limitations of the usual survivalist type information. Much depends upon the specifics of the situation you are preparing for. Climate change is unique in two ways that are unhelpful in terms of common survivalist thinking. Firstly it is a long duration problem (for many thousands of years at the very least) and a lot of the survivalist thinking equips you for a short duration problem. Secondly climate change means that the very environment we depend upon may change radically around us. That means that even if you already knew how to live off the land for your area right now (for example which plants are safe to eat) that is not necessarily going to give you a longer term strategy. Do remember that no matter how much food you store and how many tools you own - all these things are finite and will wear out. It is better to be excellent at problem solving than at hoarding tonnes of gear. It is also selfish to your children to predicate your existence upon short term answers, leaving them to solve more problems later. Sound familiar? That's because that's the sort of thinking that led to the climate crisis - and we must change it!

Accordingly once you are happy you have planned for the initial collapse episode, you need longer term plans. I suggest learning about the earth system and understanding what is likely to happen in the areas you are likely to be inhabiting. You also need to consider how your children and grandchildren will live into the indefinite future. I think you should think about the even longer term future:

Seven generation sustainability
http://en.wikipedia.org/wiki/Seven_generation_sustainability

Unfortunately it's easy to be lazy and short term. If our ancestors had cared about us seven generations ago - I am certain we wouldn't have these problems today. Accordingly, we must change this attitude if we value children. Those who do not will consign their descendents either to death or to the most primitive and brutal of existences.

Finally I strongly suggest you make sure you're on very good terms with your neighbours wherever you end up. The importance of community and social cohesion cannot be overstated. Make friends, not enemies.

A diverse range of seeds is essential - above examples scale up rapidly from low seed
numbers
On Children

It is beyond my comprehension at this point how anyone with children can NOT be preparing.

I would suggest that if you have children you start to help them become prepared - in ways that would make sense anyway. For example I believe children should know where food comes from. That means growing plants and raising and killing animals. They should also understand that if they value the ability to eat they should respect not only the world that provides those plants and animals but also the plant and animal itself. If one cannot respect something how can you look after it and in turn yourself?

I do not think you should lie to children, but on the other hand the truth should not be forced upon them either. Children usually have more flexible minds than adults and can arrive at their own understanding in their own time - if given as much truth as they reasonably ask for. We don't live in utopia and you can definitely be too protective. Particularly with younger children - make sure not to tell them things you don't want them to tell other people.

Make sure your children do not depend upon electronic gadgets and toys for emotional satisfaction. Help them to understand the simple beauty of nature and the real world. If they are old enough teach them the basic survival skills that count most. Perhaps the importance of clean water, how to make fire and how to respond to environmental stress in the form of dangerous heat and cold.

You and your children should be in good physical shape. That doesn't necessarily mean being a toned athlete but a basic standard of physical fitness is essential. A little stored body fat might actually be a good thing but certainly not enough to affect your fitness or mobility. A little of it could help you when you are starving. I would however note to all those who think an answer is to hoard lots of food - if you are obviously well fed while those around you starve, expect them to kill you and take your food. A modest stockpile is arguably a substantial advantage but only if used wisely.

It is essential to cultivate a practical and optimistic attitude. Instead of encouraging the all too common passive mindset of waiting for someone else to solve a problem (or of saying something is simply too hard) perseverance should be encouraged, and willingness to try. Ability to learn from failure is also important.

One of my pet peeves about how most people view the end of the world is they necessarily think the loss of civilisation and the descent of the world into violent conflict is a hopeless situation. They automatically think it will be dreadful and not worth trying to survive in. I can only say that I think the collapse itself will be a finite duration event (until the population is back within carrying capacity) and that the most important thing about being civilised is how people treat each other.

One can find happiness in small simple things if one is willing to accept it! Those things will never go away for those who value them.

What if you cannot survive?

Firstly, survival is mostly in the mind. In many cases your mental attitude is the biggest factor - not your physical limitations. A couple of examples:
Secondly, if you genuinely think yourself unable to survive in a collapsed world, I can only suggest the following:
  1. Do your absolute best to try to stop things from collapsing - this is by definition your best survival strategy 
  2. Help someone else - if your good deeds can live longer than you, why not try to help future generations? 
Good luck.

Friday, October 26, 2012

Open Letter to Canadian MPs

Paul Beckwith
Food is the new oil. Land is the new gold.

The world food situation is deteriorating. Grain stocks have dropped to a dangerously low level. The World Food Price Index has doubled in a decade. The ranks of the hungry are expanding. Political unrest is spreading.

On the demand side of the food equation, there will be 219,000 people at the dinner table tonight who were not there last night. And some 3 billion increasingly affluent people are moving up the food chain, consuming grain-intensive livestock and poultry products.

At the same time, water shortages and heat waves are making it more difficult for farmers to keep pace with demand. As grain-exporting countries ban exports to keep their food prices down, importing countries are panicking. In response, they are buying large tracts of land in other countries to grow food for themselves. The land rush is on.

Could food become the weak link for us as it was for so many earlier civilizations? This slideshow presentation, based on Lester Brown's latest book, Full Planet, Empty Plates: The New Geopolitics of Food Scarcity, explains why world food supplies are tightening and tells what we need to do about it.
http://www.earth-policy.org/books/fpep/fpep_presentation

My video clip filmed about 3 weeks ago on Parliament Hill explains the clear connections between crop failures/droughts/floods/extreme weather/sea ice/greenhouse gases/climate change...
http://www.youtube.com/watch?feature=player_embedded&v=zw1GEp8UBj4

This is my presentation on Parliament Hill (Center blog) a few months ago at the All-Party Climate Change Caucus meeting.
https://docs.google.com/file/d/0ByLujhsHsxP7NG42RjVQLXBrV1k/edit

This is a longer version of the linkages between food shortages and declining sea ice.
https://docs.google.com/file/d/0ByLujhsHsxP7NThkM05iN1BXZ2s/edit


Please let me know what your plan is to deal with this coming turmoil.
I look forward to your response.


Sincerely,

Paul Beckwith (B.Eng. Engineering Physics, M.Sc. Physics, presently working on Ph.D. in climatology)

Big changes in Arctic within years

Above interactive graphic illustrates the decline of the annual sea ice minimum volume in the Arctic over the years.

What trend can best be fitted to these data? Below, I've added a trendline that I believe best fits the data, but I encourage others to come up with better trends.


The trend points at 2014 as the year when Arctic sea ice will first reach zero volume for some time during that year. As discussed in the earlier post Getting the Picture, the Arctic Ocean looks set to be ice-free for a period of at least three months in 2015 (August, September and October), and for a period of at least 6 months from the year 2020 (June through to November).

Natural variability and strong feedbacks may speed things up further. Decline of sea ice in 2012 was such that we can expect a very low volume in December 2012, which could lead to inclusion of December in the period projected to be ice-free from 2020. That would make the ice-free period seven month long, i.e. well over half a year.

The image below shows the three areas where albedo change will be felt most in the Arctic, i.e. sea ice loss, decline of albedo in Greenland and more early and extensive retreat of snow and ice cover in other areas in the Arctic.


Related

- Getting the Picture
arctic-news.blogspot.com/2012/08/getting-the-picture.html

- Albedo change in the Arctic
arctic-news.blogspot.com/2012/07/albedo-change-in-arctic.html

- Greenland is melting at incredible rate
arctic-news.blogspot.com/2012/07/greenland-is-melting-at-incredible-rate.html

- Albedo change in the Arctic threatens to cause runaway global warming

Wednesday, September 5, 2012

Arctic sea ice loss is effectively doubling mankind's contribution to global warming

Loss of Arctic sea ice is effectively doubling mankind's contribution to global warming. Increased absorption of the sun's rays is "the equivalent of about 20 years of additional CO2 being added by man", Professor Peter Wadhams said in the BBC article: Arctic ice melt 'like adding 20 years of CO2 emissions', by Susan Watts, September 5, 2012.

For more details on Professor Wadhams' calculations, see the earlier post Albedo change in the Arctic.

Arctic sea ice area fell by 11.33629 million square km from March 28, 2012, to September 1, 2012, as shown on the image below, edited from The Cryosphere Today. That's an 82.7 percent fall in 157 days. 


The image below shows Arctic sea ice extent (total area of at least 15% ice concentration) for the last 7 years, compared to the average 1972-2011, as calculated by the Polar View team at the University of Bremen, Germany.

There still are quite a few days to go in the melting season, so the fall could be even more dramatic.

Peter Wadhams adds:  “The point about summer conditions is that as long as there is SOME ice present on the sea surface, however thin the layer, then the ocean temperature below it is held to 0 degrees Celsius because the absorbed solar radiation melts the ice rather than warming the water. Also the atmospheric temperature is held to close to 0 degrees Celsius because warmer air melts the surface snow layer on top of the ice and is thereby cooled. The sea ice, even when thinned, continues to act with 100% efficiency as an air conditioning system for ocean and atmosphere alike.”

“BUT”, Prof Wadhams continues, “as soon as the sea ice layer goes, this process ceases and the sea can warm up rapidly (to typically 7 degrees Celsius by the end of summer - which is not much colder than the North Sea), as can the atmosphere (which speeds up Greenland ice sheet melt when that warmed air passes over Greenland). Latent heat is an enormously powerful buffer - the amount of heat that you have to pump in to melt 1 kg of ice will subsequently heat that same amount of melted water to 80 degrees Celsius. So once the ice goes away entirely there is a big jump in temperatures in the upper ocean and atmosphere (with dire consequences for permafrost), and it is very difficult to see how one can ever go back to an ice-covered summer ocean once this has happened.”

In the August 27, 2012, BBC article Arctic sea ice reaches record low, Nasa says, by Roger Harrabin, Professor Peter Wadhams said: “Implications are serious: the increased open water lowers the average albedo [reflectivity] of the planet, accelerating global warming; and we are also finding the open water causing seabed permafrost to melt, releasing large amounts of methane, a powerful greenhouse gas, to the atmosphere.”

Indeed, there is a danger that loss of the sea ice will weaken the currents that currently cool the bottom of the sea, where huge amounts of methane may be present in the form of free gas or hydrates in sediments. This danger is illustrated by the image below by Reg Morrison.


The image below, from a study by Polyakov et al., shows temperature differences in the vertical water column at selected stretches of water in the Arctic over the years.

[click images to enlarge]


Sunday, September 2, 2012

Further Confirmation of a Probable Arctic Sea Ice Loss by Late 2015

By Malcolm P.R. Light
1st September, 2012


Executive Summary

The Arctic sea ice maintains the cold of the polar region and acting like the Earth's air conditioner it helps moderate climate with the oceans and the atmosphere rebalancing the heat on the planet (Rice 2012; Speer 2012). Each year the Arctic sea ice melts in the summer reaching its smallest extent in September and reaches it largest extent in March (Rice 2012). At the end of August 2012, the Arctic sea ice reached it lowest extent that has ever been recorded (Vizcarra, 2012) due to the increasing input of globally warmed Gulf Stream waters into the Arctic generating what is now termed a death spiral for the floating Arctic sea ice (Romm 2012; Morison 2012). In the IPCC fourth assessment report in 2007 it was predicted that the Arctic would become ice free at the end of this Century, while more recent estimates suggested that the ice would melt by 2030 or in this decade (Romm 2012). Piomas ice volume melt data indicates that by 2015 the Arctic sea ice cap will be gone (Carana 2012d; Masters, 2009) and this paper confirms the accuracy of the Piomas estimate.

The intersection point of the converging envelopes of the varying amplitude of the monthly 11 year moving average of the Giss maximum surface temperature anomaly represents a time after which the variable effect caused by the latent heat of melting and freezing of the worlds Polar sea ice caps will be eliminated, i.e. the time when the Arctic floating sea ice cap will be completely melted away (Figure 10). The best estimate of the time when we will lose the the Arctic floating sea ice cap is 2015.757 (October 2) which is the mean yearly intersection point calculated from the 12 convergent monthly data sets (Figure 10. anomaly temperature 6.8762 degrees C). The 2015.757 best estimate for the complete loss of Arctic floating sea is almost identical to the 2015 date suggested by Piomass ice volume reduction data (Carana 2012d) and is within its 90% confidence interval error limit. The date range for the intersection points of the converging data set runs from 2011.363 (Figure 4. July anomaly temperature 6.7079 degrees C) to 2022.989 (Figure 9. June anomaly temperature 7.1414 degrees C).

The normal high July temperatures of the Arctic ocean region including the major heated rivers feeding the surrounding Siberian shelf regions are an important factor in destabilization of the shallower methane hydrate accumulations and the eruption of methane into the Arctic atmosphere and stratosphere at that time (Shakova et al. 2008, 2010; Light 2012). In the normal July summer hot period the Gulf Stream is heated to some 26.5 degrees C in the Atlantic (Figure 22a,b). This has been found to be followed by a subsequent anomalous hot period in late October - November caused by the high global warming potential of methane clouds which have been erupted into the Arctic atmosphere and make their way up into the global stratosphere (Figure 23). The stratospheric build up of methane between about 30 km and 47 km altitude forms a continuous methane global warming veil which is then spread by stratospheric vortices ESE across Russia, Europe the Atlantic and the Americas into the Pacific and Southern Hemisphere where it enhances both the pollution heated Gulf Stream on the east coast of the United States/Canada and the El-Nino in the Pacific (Figure 23). This secondary thermal anomaly caused by the extreme methane eruptions in late October - November is termed a False Indian Summer (FIS) and it will grow in strength, depth and duration as the methane eruptions escalate exponentially in the Arctic emission centres because of the increased heating of the subsea methane hydrates by the summer warmed Gulf Stream (Intermediate Depth) current (Figures 19, 20a,b and 22a,b).

The stratospheric methane global warming veil completes a complex convection cycle in the earths atmosphere and oceans in exactly the same way that a giant forest fire will draw in cooler winds which will amplify the flames with the heated air rising, cooling and increasing in density aloft so that it sinks back to the ground away from the fire site to be drawn back again to re-enhance the flames further. In the case of the Gulf Stream where global warming induced by the pollution clouds blowing off the east coast of the United States/Canada warms the Atlantic waters in the summer to 26.5 degrees C (Figure 22b), the heat is then trapped in the Gulf Stream which migrates north east to the Arctic in October November where it destabilizes the subsea methane hydrates along the south east slope of the Eurasian basin/Laptev Sea transition and forms an extreme atmospheric methane eruption centre (Figure 20a,b).

The US/Canada pollution clouds which globally overheat the Gulf Stream also show a second complete complex energy convection cycle caused by a southern offshoot
of the Gulf Stream in the Atlantic that swings SE toward the warm waters of the western coast of Africa, the spawning grounds of Hurricane systems in the Eastern Atlantic (Wales, 2012). These hurricanes then make their way to the NW towards the Gulf Coast/Florida, the source of the warmed Gulf Stream, causing increasing devastation on their way across the Caribbean islands and the US/Canada coastline. Both the stratospheric methane global warming veil and the Hurricane tracks are simply the closing stages of complex heat convection cycles returning back to the original energy source (the pollution clouds blowing off the east coast of the US/Canada) increased volumes of heat energy. The global warming effects of these pollution clouds will be enhanced even further by methane being injected into the Arctic atmospheric convection cycles producing an escalating exponential growth in the heat input into atmosphere and ocean, intensifying the resulting climatic devastation and giving us an early warming of our impending extinction within the next 50 years.

Saturday, September 1, 2012

Sea ice area falls below 2.5 million square km

Arctic sea ice area has fallen below 2.5 million square km. 

Sea ice area was 2.48831 million square km on the 242nd day of 2012, as shown on the image below by The Cryosphere Today.  


Sea ice area was 13.70851 million square km on the 88th day of 2012. That's a loss of 11.2202 million square km, or about 82%.  And there's still quite a few days to go in the melting season.   

Saturday, August 25, 2012

How much sea ice is lost daily?

How much sea ice is lost in the Arctic daily? What are your estimates (in square km and cubic km)? 


Paul Beckwith
Paul Beckwith, B.Eng, M.Sc. (Physics),
Ph. D. student (Climatology) and
Part-time Professor, University of Ottawa

Losses of 100,000 square kilometer per day loss of sea ice area are being reported by various sources. Images of ice speed and drift, in conjunction with ice thickness, would support this.

This rate of loss is as large as that lost during the August 3rd to 10th cyclone (700,000 to 800,000 square kilometers lost for the duration of the cyclone).

My prediction that we'll lose virtually all sea ice by September 30th, 2012, still seems very reasonable.


Sam Carana

I too estimate there have been losses of 100,000 square kilometer per day for over two months now.

The top image at my recent post on ice extent shows that extent has roughly halved in two months time, from over 12 million square km at the start of June to roughly 6 million square km at the start of August. That's a loss of about 6 million square km in two months time, or about 100,000 square km per day.

To date, this loss rate appears to have continued in August and shows no signs of decreasing yet.