Questions and Answers with Sam Carana

Above image shows a non-linear blue trend based on 1880-2020 NASA Land+Ocean data that are adjusted 0.78°C to reflect a pre-industrial base, to more fully reflect strong polar warming, and to reflect surface air temperatures over oceans. This blue trend highlights that the 1.5°C threshold was crossed in 2012 (inset), while the 2°C threshold looks set to be crossed next year and a 3°C rise could be reached at the end of 2026.
Overshoot?
The blue trend in the image at the top shows the temperature rise crossing 1.5°C in 2012. Could this have been a temporary overshoot? Could the trend be wrong and could temperatures come down in future, instead of continuing to rise, and could temperatures fall to such extent that this will bring the average temperature rise back to below 1.5°C?
To answer this question, let's apply the method followed by the IPCC and estimate the average temperature rise over a 30-year period that is centered around the start of 2012, i.e. from 1997 to the end of 2026. The IPPC used a 30-year period in its Special Report on Global Warming of 1.5 ºC, while assuming that, for future years, the current multi-decadal warming trend would continue (see image below).

As said, the image at the top shows the temperature rise crossing 1.5°C in 2012. For the average temperature over the 30-year period 1997-2026 to be below 1.5°C, temperatures would have to fall over the next few years. Even if the temperature for 2021 fell to a level as low as it was in 2018 and remained at that same lower level until end 2026, the 1997-2026 average would still be more than 1.5°C above pre-industrial. Furthermore, for temperatures to fall over the next few years, there would need to be a fall in concentrations of greenhouse gases over the next few years, among other things. Instead, greenhouse gas levels appear to be rising steadily, if not at accelerating pace.
What did the IPCC envisage? As the image below shows, the IPCC in AR5 did envisage carbon dioxide under RCP 2.6 to be 421 ppm in 2100, while the combined CO₂e for carbon dioxide, methane and nitrous oxide would be 475 ppm in 2100.

The image below, based on a study by Detlef van Vuuren et al. (2011), pictures pathways for concentrations of carbon dioxide, methane and nitrous oxide, for each of four Representative Concentration Pathways (RCPs).

Above image shows that, for RCP 2.6 to apply in the above study, there is little or no room for a rise in these greenhouse gases. In fact, the study shows that methane levels would have to be falling dramatically. At the moment, however, methane concentrations show no signs of falling and instead appear to be following if not exceeding RCP 8.5, as discussed in a recent post and as also illustrated by the images below. The IPCC used similar figures in AR5 (2013), as shown below.

Greenhouse gas levels are rising
As the image below shows, the carbon dioxide (CO₂) level recorded at Mauna Loa, Hawaii, was 421.36 parts per million (ppm) on April 8, 2021.

The N20 satellite recorded a methane peak of 2862 ppb on the afterrnoon of March 29, 2021, at 487.2 mb, as the image below shows.

A similarly high methane peak was recorded by the MetOp-1 satellite at 469 mb on the morning of April 4, 2021.

Below are the highest daily mean methane levels recorded by the MetOp-1 satellite at selected altitudes on March 10 or 12, for the years 2013-2021, showing that methane levels are rising, especially at the higher altitude associated with 293 mb.

Similarly, nitrous oxide levels show no signs of falling, as illustrated by the image below.

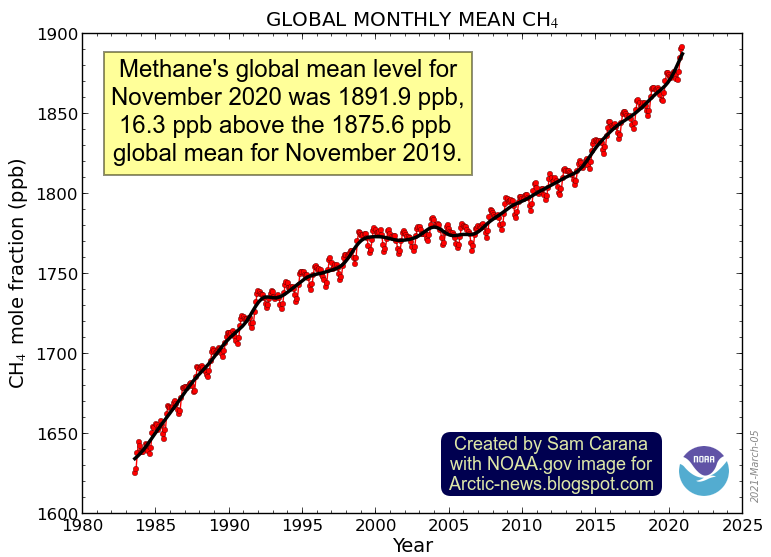
Methane grew 15.85 ppb in 2020, how fast could CO₂e rise?
Rising greenhouse gas levels and associated feedbacks threaten to cause temperatures to keep rising, in a runaway scenario that cannot be reverted even if emissions by people were cut to zero.
Peaks in greenhouse gas levels could suffice to trigger the clouds feedback, which occurs when a CO₂e threshold of around 1,200 ppm is crossed, and the stratocumulus decks abruptly become unstable and break up into scattered cumulus clouds.
Once the clouds tipping point is crossed, it will be impossible to undo its impact, in line with the nature of a tipping point. In theory, CO₂ levels could come down after the stratocumulus breakup, but the stratocumulus decks would only reform once the CO₂ levels drop below 300 ppm.
A recent post repeated the warning that by 2026, there could be an 18°C rise when including the clouds feedback, while humans will likely go extinct with a 3°C rise and most life on Earth will disappear with a 5°C rise. In conclusion, once the clouds feedback gets triggered, it cannot be reverted by people, because by the time the clouds feedback starts kicking in, people would already have disappeared, so there won't be any people around to keep trying to revert it.
 |
| [ click on images to enlarge ] |
Methane levels are rising rapidly. The image to the right shows a trend that is based on NOAA 2006-2020 annual global mean methane data and that points at a mean of 3893 ppb getting crossed by the end of 2026.
Why is that value of 3893 ppb important? On April 8, 2021, carbon dioxide reached a peak of 421.36 ppm, i.e. 778.64 ppm away from the clouds tipping point at 1200 ppm, and 778.64 ppm CO₂e translates into 3893 ppb of methane at a 1-year GWP of 200.
In other words, a methane mean of 3893 ppb alone could cause the clouds tipping point to get crossed, resulting in an abrupt 8°C temperature rise.
Such a high mean by 2026 cannot be ruled out, given the rapid recent growth in mean annual methane levels (15.85 ppb in 2020, see inset on image).
Additionally, there are further warming elements than just carbon dioxide and methane, e.g. nitrous oxide and water vapor haven't yet been included in the CO₂e total.
Moreover, it may not even be necessary for the global mean methane level to reach 3893 ppb. A high methane peak in one single spot may suffice and a peak of 3893 ppb of methane could be reached soon, given that methane just reached a peak of 2862 ppb, while even higher peaks were reached over the past few years, including a peak of 3369 ppb recorded on the afternoon of August 31, 2018.
Moreover, it may not even be necessary for the global mean methane level to reach 3893 ppb. A high methane peak in one single spot may suffice and a peak of 3893 ppb of methane could be reached soon, given that methane just reached a peak of 2862 ppb, while even higher peaks were reached over the past few years, including a peak of 3369 ppb recorded on the afternoon of August 31, 2018.
Abrupt stratocumulus cloud shattering
 |
| [ click on images to enlarge ] |
Catastrophic crack propagation is what makes a balloon pop. Could low-lying clouds similarly break up and vanish abruptly?
Could peak greenhouse gas concentrations in one spot break up droplets into water vapor, thus raising CO₂e and propagating break-up of more droplets, etc., to shatter entire clouds?

As NASA describes, El Niño events occur roughly every two to seven years. As temperatures keep rising, ever more frequent strong El Niño events are likely to occur. NOAA anticipates La Niña to re-emerge during the fall or winter 2021/2022, so it's likely that a strong El Niño will occur between 2023 and 2025.


Links
• Climate Plan
• NOAA Global Climate Report - February 2021 - Monthly Temperature Anomalies Versus El Niño
• NOAA Northern Hemisphere Ocean Temperature Anomaly
• NOAA Sunspots - solar cycle progression
• Smithsonian Institution - Volcanoes - current eruptions
• IPCC Special Report Global Warming of 1.5 ºC - Summary for Policy Makers
• IPCC AR5 WG1 Summary for Policymakers - Box SPM.1: Representative Concentration Pathways
Could peak greenhouse gas concentrations in one spot break up droplets into water vapor, thus raising CO₂e and propagating break-up of more droplets, etc., to shatter entire clouds?
In other words, an extra burst of methane from the seafoor of the Arctic Ocean alone could suffice to trigger the clouds tipping point and abruptly push temperatures up by an additional 8°C.
Omnicide?
This brings the IPCC views and suggestions into question. As discussed above, for the average temperature to come down to below 1.5°C over the period 1997-2026, temperatures would need to fall over the next few years. What again would it take for temperatures to fall over the next few years?
Imagine that all emissions of greenhouse gases by people would end. Even if all emissions of greenhouse gases by people could magically end right now, there would still be little or no prospect for temperatures to fall over the next few years. Reasons for this are listed below, and it is not an exhaustive list since some things are hard to assess, such as whether oceans will be able to keep absorbing as much heat and carbon dioxide as they currently do.
By implication, there is no carbon budget left. Suggesting that there was a carbon budget left, to be divided among polluters and to be consumed over the next few years, that suggestion is irresponsible. Below are some reasons why the temperature is likely to rise over the next few years, rather than fall.
How likely is a rise of more than 3°C by 2026?
• The warming impact of carbon dioxide reaches its peak a decade after emission, while methane's impact over ten years is huge, so the warming impact of the greenhouse gases already in the atmosphere is likely to prevent temperatures from falling and could instead keep raising temperatures for some time to come.
• Temperatures are currently suppressed. We're in a La Niña period, as illustrated by the image below.

 |
| [ click on images to enlarge ] |
• Rising temperatures can cause growth in sources of greenhouse gases and a decrease in sinks. The image below shows how El Niño/La Niña events and growth in CO₂ levels line up.


• We're also at a low point in the sunspot cycle. As the image on the right shows, the number of sunspots can be expected to rise as we head toward 2026, and temperatures can be expected to rise accordingly. According to James Hansen et al., the variation of solar irradiance from solar minimum to solar maximum is of the order of 0.25 W/m⁻².
• Add to this the impact of a recent Sudden Stratospheric Warming event. We are currently experiencing the combined impact of three short-term variables that are suppressing the temperature rise, i.e. a Sudden Stratospheric Warming event, a La Niña event and a low in sunspots.
Over the next few years, in the absence of large volcano eruptions and in the absence of Sudden Stratospheric Warming events, a huge amount of heat could build up at surface level. As the temperature impact of the other two short-term variables reverses, i.e. as the sunspot cycle moves toward a peak and a El Niño develops, this could push up temperatures substantially. The world could be set up for a perfect storm by 2026, since sunspots are expected to reach a peak by then and since it takes a few years to move from a La Niña low to the peak of an El Niño period.
• Furthermore, temperatures are currently also suppressed by sulfate cooling. This impact is falling away as we progress with the necessary transition away from fossil fuel and biofuel, toward the use of more wind turbines and solar panels instead. Aerosols typically fall out of the atmosphere within a few weeks, so as the transition progresses, this will cause temperatures to rise over the next few years. Most sulfates are caused by large-scale industrial activity, such as coal-fired power plants and smelters. A significant part of sulphur emissions is also caused by volcanoes. Historically, some 20 volcanoes are actively erupting on any particular day. Of the 49 volcanoes that erupted during 2021, 45 volcanoes were still active with continuing (for at least 3 months) eruptions as at March 12, 2021.

• Also holding back the temperature rise at the moment is the buffer effect of thick sea ice in the Arctic that consumes heat as it melts. As Arctic sea ice thickness declines, more heat will instead warm up the Arctic, resulting in albedo changes, changes to the Jet Stream and possibly trigger huge releases of methane from the seafloor. The rise in ocean temperature on the Northern Hemisphere looks very threatening in this regard (see image on the right) and many of these developments are discussed at the extinction page. There are numerous further feedbacks that look set to start kicking in with growing ferocity as temperatures keep rising, such as releases of greenhouse gases resulting from permafrost thawing and the decline of the snow and ice cover. Some 30 feedbacks affecting the Arctic are discussed at the feedbacks page.
• The conclusion of study after study is that the situation is worse than expected and will get even worse as warming continues. Some examples: a recent study found that the Amazon rainforest is no longer a sink, but has become a source, contributing to warming the planet instead; another study found that soil bacteria release CO₂ that was previously thought to remain trapped by iron; another study found that forest soil carbon does not increase with higher CO₂ levels; another study found that forests' long-term capacity to store carbon is dropping in regions with extreme annual fires; a recent post discussed a study finding that at higher temperatures, respiration rates continue to rise in contrast to sharply declining rates of photosynthesis, which under business-as-usual emissions would nearly halve the land sink strength by as early as 2040; the post also mentions a study on oceans that finds that, with increased stratification, heat from climate warming less effectively penetrates into the deep ocean, which contributes to further surface warming, while it also reduces the capability of the ocean to store carbon, exacerbating global surface warming; finally, a recent study found that kelp off the Californian coast has collapsed. So, both land and ocean sinks look set to decrease as temperatures keep rising, while a 2020 study points out that the ocean sink will also immediately slow down as future fossil fuel emission cuts drive reduced growth of atmospheric CO₂.
Where do we go from here?
 |
| [ image from earlier post ] |
The same blue trend that's in the image at the top also shows up in the image on the right, from an earlier post, together with a purple trend and a red trend that picture even worse scenarios than the blue trend.
The purple trend is based on 15 recent years (2006-2020), so it can cover a 30-year period (2006-2035) that is centered around end December 2020. As the image shows, the purple trend points at a rise of 10°C by 2026, leaving little or no scope for the current acceleration to slow, let alone for the anomaly to return to below 2°C.
The red trend is based on a dozen recent years (2009-2020) and shows that the 2°C threshold could already have been crossed in 2020, while pointing at a rise of 18°C by 2025.
The red trend is based on a dozen recent years (2009-2020) and shows that the 2°C threshold could already have been crossed in 2020, while pointing at a rise of 18°C by 2025.
In conclusion, temperatures could rise by more than 3°C by the end of 2026, as indicated by the blue trend in the image at the top. At that point, humans will likely go extinct, making it in many respects rather futile to speculate about what will happen beyond 2026. On the other hand, the right thing to do is to help avoid the worst things from happening, through comprehensive and effective action as described in the Climate Plan.
• Climate Plan
• IPCC AR5, Climate Change (2013), Chapter 8
• The representative concentration pathways: an overview - by Detlef van Vuuren et al. (2011)
• Young people's burden: requirement of negative CO₂ emissions - by James Hansen et al. (2017)
• 2020: Hottest Year On Record
• What Carbon Budget?
• Most Important Message Ever
• High Temperatures October 2020
• Temperature keep rising
• More Extreme Weather
• Extinction
• Feedbacks
• Sudden Stratospheric Warming
• Possible climate transitions from breakup of stratocumulus decks under greenhouse warming - by Tapio Schneider et al.
• Iron mineral dissolution releases iron and associated organic carbon during permafrost thaw - by Monique Patzner et al.
• Global maps of twenty-first century forest carbon fluxes - by Nancy Harris et al.
• A trade-off between plant and soil carbon storage under elevated CO2 - by César Terrer et al.
• Forests' long-term capacity to store carbon is dropping in regions with extreme annual fires
• Decadal changes in fire frequencies shift tree communities and functional traits - by Adam Pellegrini et al.
• NOAA - Trends in Atmospheric Methane
• NOAA - Annual Mean Growth Rate for Mauna Loa, Hawaii
• NOAA - Trends in Atmospheric Methane
https://www.esrl.noaa.gov/gmd/ccgg/trends_ch4
• Upper Ocean Temperatures Hit Record High in 2020 - by Lijing Cheng et al.
• External Forcing Explains Recent Decadal Variability of the Ocean Carbon Sink - by Galen McKinley et al. (2020)
https://agupubs.onlinelibrary.wiley.com/doi/full/10.1029/2019AV000149
• Maximum warming occurs about one decade after a carbon dioxide emission - by Katharine Ricke et al.
• Confirm Methane's Importance
• FAQs
• The Climate Data Guide: Nino SST Indices - by Kevin Trenberth & NCAR Staff (Eds)
https://climatedataguide.ucar.edu/climate-data/nino-sst-indices-nino-12-3-34-4-oni-and-tni
https://climatedataguide.ucar.edu/climate-data/nino-sst-indices-nino-12-3-34-4-oni-and-tni
• Historical change of El Niño properties sheds light on future changes of extreme El Niño - by Bin Wang et al.
• NOAA - ENSO: Recent Evolution,
Current Status and Predictions, April 12, 2021
https://www.cpc.ncep.noaa.gov/products/analysis_monitoring/lanina/enso_evolution-status-fcsts-web.pdf
https://www.cpc.ncep.noaa.gov/products/analysis_monitoring/lanina/enso_evolution-status-fcsts-web.pdf
• Large-scale shift in the structure of a kelp forest ecosystem co-occurs with an epizootic and marine heatwave - by Meredith McPherson et al.
• External Forcing Explains Recent Decadal Variability of the Ocean Carbon Sink - by Galen McKinley et al. (2020)
https://agupubs.onlinelibrary.wiley.com/doi/full/10.1029/2019AV000149
• Blue Ocean Event