Showing posts with label pressure. Show all posts

Thursday, December 22, 2022

Wild Winter Weather

[ posted earlier at facebook ]
The image on the right shows a forecast of very low temperatures over North America with a temperature of -40 °C / °F highlighted (green circle at center) for December 23, 2022 14:00 UTC. 

As the image shows, temperatures over large parts of North America are forecast to be even lower than the temperature at the North Pole.  

The combination image below illustrates this further, showing temperatures as low as -50.3°C or -58.6°F in Alaska on December 22, 2022 at 17:00 UTC, while at the same time the temperature at the North Pole was -13.6°C or 7.4°F. 


The Jet Stream

The image below shows the Jet Stream (250 hPa) on December 13, 2022, stretched out vertically and reaching the North Pole as well as the South Pole, while sea surface temperature anomalies are as high as 11°C or 19.7°F from 1981-2011 at the green circle. 

The Jet Stream used to circumnavigate the globe within a narrow band from West to East (due to the Coriolis Force), and it used to travel at relatively high speed, fuelled by the temperature difference between the tropics and the poles.

[ posted earlier at facebook ]

The Jet Stream used to circumnavigate the globe within a narrow band from West to East (due to the Coriolis Force), and it used to travel at relatively high speed, fuelled by the temperature difference between the tropics and the poles. 

As the above image shows, the Pacific Ocean is currently cooler at the tropics and warmer further to the north (compared to 1981-2011), which narrows this temperature difference and in turn makes the Jet Stream wavier. Accordingly, the Jet Stream is going up high into the Arctic before descending deep down over North America. 


[ click omn images to enlarge ]
The above image shows Rossby waves, from NOAA. When you see a wave traveling along the surface of water, there are peaks and troughs in the water height. The same happens in the atmosphere with a traveling Rossby wave – as the Rossby wave travels through the atmosphere, the peaks and troughs of the wave produce regions of high and low air pressure.

The image on the right shows air pressure at sea level on December 22, 2022. High sea surface temperatures make air rise, lowering air pressure at the surface to levels as low as 973 hPa over the Pacific. Conversely, a more wavy Jet Stream enables cooler air to flow from the Arctic to North America, raising air pressure at the surface to levels as high as 1056 hPa.

On December 22, 2022, the Jet Stream reached very high speeds over the Pacific, fuelled by high sea surface temperature anomalies. The image on the right shows the Jet Stream moving over the North Pacific at speeds as high as 437 km/h or 271 mph (with a Wind Power Density of 349.2 kW/m², at the green circle). 

The Jet Stream then collides with higher air pressure and moves up into the Arctic, and subsequently descends deep down over North America, carrying along cold air from the Arctic. Deformation of the Jet Stream also results in the formation of circular wind patterns that further accelerate the speed of the Jet Stream. 

The image on the right shows the Jet Stream moving over North America at speeds as high as 366 km/h or 227 mph (green circle). The image also shows high waves in the North Pacific. 

La Niña / El Niño

The low sea surface temperature anomalies in the Pacific Ocean are in line with the current La Niña. 

The fact that such extreme weather events occur while we're in the depth of a persistent La Niña is worrying. The next El Niño could push up temperatures further, which would hit the Arctic most strongly. This would further narrow the difference between temperatures at the Equator and the North Pole, thus making the Jet Stream more wavy, which also enables warm air to move into the Arctic, further accelerating feedbacks in the Arctic.

The image below, from NOAA, indicates that the next El Niño is likely to emerge soon. More about that in the next post. 


Conclusion

The situation is dire and calls for immediate, comprehensive and effective action as described in the Climate Plan


Links

• nullschool

• Jet Stream

• Coriolis Force

• NOAA - What are teleconnections? Connecting Earth's climate patterns via global information superhighways

• Wind Power Density

• Extreme Weather
https://arctic-news.blogspot.com/p/extreme-weather.html

• Feedbacks in the Arctic
https://arctic-news.blogspot.com/p/feedbacks.html

• NOAA - Multivariate ENSO Index Version 2 (MEI.v2)


Thursday, February 12, 2015

Something had to give - Baffin Island hit by M4.6 earthquake

An earthquake with a magnitude of 4.6 on the Richter scale hit Baffin Island on February 12, 2015, at 02:11:40 (UTC). The image below, from the United States Geological Survey (USGS), shows the epicenter of the quake.


The earthquake occurred at a time when surface temperature anomalies over parts of North America and Greenland are at the bottom end of the scale, while surface temperature anomalies over parts of Siberia are at the top end of the scale, as illustrated by the image below.


The image below shows pressure differences reaching the top and bottom ends of the scale (left). At the same time, sea surface temperature anomalies around North America and Greenland are at the top end of the scale (right). It appears that something had to give. 


This earthquake is important, given that it hit an area without large faultlines (though earthquakes are common here, also see this discussion). The Baffin Island earthquake occurred in an area prone to glacial isostatic adjustment, as illustrated by the image below.

From "http://grace.jpl.nasa.gov", (unfiltered version). Credit: A, G., J. Wahr, and S. Zhong (2013) "Computations
of the viscoelastic response of a 3-D compressible Earth to surface loading: an application to Glacial Isostatic
Adjustment in Antarctica and Canada", Geophys. J. Int., 192, 557–572, doi: 10.1093/gji/ggs030
Glacial isostatic adjustment as a phenomenon takes place over relatively long periods. An additional problem is extreme weather events influencing the occurence of earthquakes more immediately.

Here's an update on the situation. Five earthquakes occured on February 13, 2015, close together, including a magnitude 7.1 at the Northern Mid-Atlantic Ridge, south of Greenland:
- M5.3 Northern Mid-Atlantic Ridge 2015-02-13 18:48:16 UTC 10.0 km
- M4.9 Northern Mid-Atlantic Ridge 2015-02-13 18:58:06 UTC 10.0 km
- M7.1 Northern Mid-Atlantic Ridge 2015-02-13 18:59:12 UTC 13.8 km
- M4.7 Reykjanes Ridge 2015-02-13 21:25:18 UTC 10.0 km
- M5.2 Reykjanes Ridge 2015-02-13 19:33:10 UTC 14.2 km

This M7.1 is the largest earthquake to hit the area around Greenland in a decade or more. And it's not just this one that has recently hit the area. The image below shows the recent Baffin Island quake in yellow, and the earthquakes that occurred today at the Northern Mid-Atlantic Ridge in orange. Furthermore, there are recent quakes on Iceland in orange and yellow. There were also three large earthquakes in the Greenland Sea, the 4.6 one is highlighted in blue (otherwise it would have been hidden).


The image below gives an impression of extreme weather events on February 13-14, 2015. 


Boston has meanwhile run out of room to dump snow, while roofs have collapsed in Massachusetts under the weight of the snow. Lnks between extreme weather events and earthquakes have been discussed before. Extreme weather events look set to intensify as temperatures in the Arctic keep rising. This is very worrying, given the vulnerability of methane under the seafloor of the Arctic Ocean. Furthermore, there are also indications that methane could be released from Greenland due to sequences of strong compaction and expansion of the snow and ice cover, due to extreme weather events. 

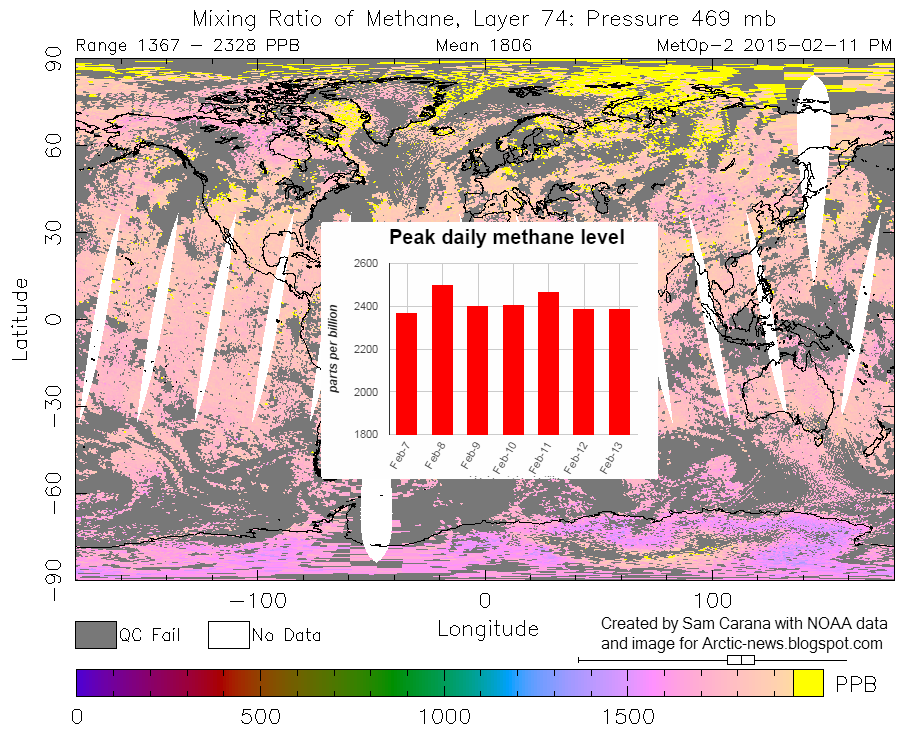
High methane levels have recently been recorded in the atmosphere over the Arctic Ocean, including over Baffin Bay.


Methane is present in sediments under the Arctic Ocean in the form of free gas and hydrates. Earthquakes can send out strong tremors through the sediment and shockwaves through the water, which can trigger further earthquakes, landslides and destabilization of methane hydrates.

As temperatures in the Arctic keep rising, the jet streams and polar vortex are changing their shape, in particular becoming more wavy, which can cause more extreme weather events such as the events described above.

The situation is dire and calls for comprehensive and effective action, as discussed at the Climate Plan blog


Friday, July 19, 2013

Arctic Ocean Events - Videos by Paul Beckwith

by Paul Beckwith


Massive Arctic cyclone effect on sea ice in August 2012
Part 1: August 1st to 16th, 2012
http://www.youtube.com/watch?v=nli47-9dT5o

Arctic sea ice motion (speed and direction) is compared to sea ice thickness from August 1st to August 16th, 2012. Sea ice motion is then compared to meteorology (500 mb pressure heights and 200 mb vector winds).


Massive Arctic cyclone effect on sea ice in August 2012
Part 2: August 1st to 16th, 2012
http://www.youtube.com/watch?v=WqwIVEpSg3w

Northern hemisphere meteorology (500mb pressure heights) and Arctic sea ice concentration compared to SST (sea surface temperatures) are examined from August 1st to August 16th, 2012 encompassing the mass persistent cyclone.


Massive Arctic cyclone effect on sea ice in August 2012
Part 3: August 1st to 16th, 2012
http://www.youtube.com/watch?v=HjYxRV0fzz4

Arctic basin SSS (sea surface salinity) is compared to SSH (sea surface height) during the period August 1st to August 16th, 2012 which encompassed a massive persistent cyclone. Detailed meteorology is also examined (tropopause temperature + pressure, surface precipitable water + pressure). Also examined is ocean profile salinity and temperature from an ice tethered buoy.


Massive Arctic cyclone effect on sea ice in August 2012
Part 4:  August 1st to 16th, 2012
http://www.youtube.com/watch?v=aAJRIV8YITY

The jet streams in the Arctic ocean basin are shown (200mb vector winds) from NOAA/ESRL daily data, as well as from 4 times daily data from SFSU. The data is given from August 1st to August 16th, 2012 which encompasses the massive Arctic cyclone.


2013

Arctic sea ice thickness + motion
May 14th to June 10th, 2013
http://www.youtube.com/watch?v=5ljHI0VITgk

Arctic sea ice data from May 14 to June 10, 2013
Left pane shows Arctic sea ice thickness; right pane shows sea ice motion (direction and speed).


Arctic sea ice thickness + motion
July 1st to 17th 2013
http://www.youtube.com/watch?v=cUZr51_yW5s

Arctic sea ice data from July 1st to July 17th, 2013. Left pane shows the Arctic sea ice thickness; right pane shows sea ice motion (direction and speed).


Sea ice concentration, temperature, salinity, and height;
July 1st to 18th, 2013
http://www.youtube.com/watch?v=icUtGqpkFx8

Arctic ocean data from US Navy for
1) sea ice concentration,
2) sea surface temperature (SST),
3) sea surface salinity (SSS), and
4) sea surface height (SSH)


Jet streams
July 1st to July 17th 2013
http://www.youtube.com/watch?v=IFbJCFVSiPI

Northern hemisphere (NH) jet streams are shown from two sources:
1) NOAA/ESRL data collected daily, and
2) SFSU data collect every 6 hours. Data is given for the time period from July 1st to July 17th, 2013.


Meteorology
July 1st to 18th 2013
http://www.youtube.com/watch?v=LONJT8JbM7I

The following meteorology plots are shown for time period July 1st to July 18th, 2013 over the Arctic Ocean between 60 degrees N and 90 degrees N:
1) 500mb pressure levels,
2) 200mb vector winds (jet streams),
3) precipitable water, and
4) tropopause temperatures.

Friday, October 26, 2012

Amplification of climate change in the Arctic

In contrast to multi-year old ice, first-year old ice—ice that formed only since the last melt season—is thinner, saltier, and much more prone to melt.


Over the years, the loss of sea ice has become especially manifest in the older ice, as illustrated by the image below.


Salt content and hardness play a part in multi-year ice’s resistance to melt, explains a recent NOAA article, but the main characteristic that allows the ice to survive the melt season is thickness.

Screenshots from: PIOMAS Arctic Sea Ice Thickness Simulation 1978-2011
The decline in thickness over the years goes a long way to explain the self-reinforcing character of sea ice decline in the Arctic.

As another recent NOAA article describes, there is “something extra” behind the record ice retreats of the past 6 years: each June, the prevailing winds shifted from their normal west-to-east direction and instead blew strongly from the south across the Bering and Chuchki Seas (left on the image below), over the North Pole, and out toward Fram Strait. (The length of the lines is qualitative: longer lines mean stronger winds.)

Average June wind vectors in 2007-2012 (orange) compared to 1981-2010 average (white) based on NCEP reanalysis data provided by Physical Sciences Division at NOAA ESRL. Map by Dan Pisut, NOAA Environmental Visualization Lab.

The image below shows the unusual air pressure patterns that gave rise to the wind shift. Air pressure across the Arctic in Junes from 2007-2012 was completely lopsided, with two pockets of higher-than-average pressure sprawled across the North American Arctic and Greenland. These areas of high pressure act like boulders in a river. They slow and disrupt the normal westerly flow of the wind, forcing it to make, large, meandering detours to the north or south.

Average geopotential height anomaly at 700 millibar pressure level in Junes from 2007-2012 compared to the long-term average (1981-2010) based on NCEP reanalysis data provided by PSD at NOAA ESRL. Orange colors are higher-than-average pressure; blue is lower-than-average pressure.     Map by Dan Pisut, NOAA Environmental Visualization Lab.
Arctic oceanographer and his NOAA colleagues think these “blocking highs” on the North American side of the Arctic created the unusually strong southerly flow that brought warm air into the central Arctic and over Greenland. The persistent southerly winds would help explain both the record low sea ice extent in summer 2012, as well as the island-wide melting of the surface of the Greenland Ice Sheet, which satellites detected in July 2012.

“This story started with us trying to figure out why the sea ice extents of the past 6 years or so have been so much lower than we would expect based on the long-term warming trend alone,” says Overland, “and we think this unusual circulation of the Arctic atmosphere is major part of it.”

Why, asks Overland, have these high pressure patterns have been forming so consistently each June for the past six years? The repeated appearance of these atmospheric features each June is so unusual that it’s the equivalent of a 1-in-a-1000 event. Can this be attributed to natural variability?

Instead, Overland’s hunch is that the cause is a change in the atmosphere that is itself connected to climate change in some way, possibly linked to record and near-record low June snow cover in the Canadian Arctic in recent years. “We don’t know that part of the story yet,” he says, “but this would certainly be the type of amplification of climate change [warming triggers changes that lead to more warming] we have been expecting to see in the Arctic.”

References

- Arctic Sea Ice Getting Thinner, Younger
http://www.climatewatch.noaa.gov/article/2012/arctic-sea-ice-getting-thinner-younger

- June wind shift a little something extra behind recent Arctic ice losses
http://www.climatewatch.noaa.gov/article/2012/june-wind-shift-a-little-something-extra-behind-recent-arctic-ice-losses

- Poles apart: A record-breaking summer and winter
http://nsidc.org/arcticseaicenews/2012/10/poles-apart-a-record-breaking-summer-and-winter/

- PIOMAS Arctic Sea Ice Thickness Simulation 1978-2011, published Sep 14, 2012 by ArctischePinguin
https://www.youtube.com/watch?v=G1TLzgSlGtQ

Related

- Arctic summer wind shift
http://arctic-news.blogspot.com/2012/10/arctic-summer-wind-shift.html

- The recent shift in early summer Arctic atmospheric circulation
http://www.agu.org/pubs/crossref/2012/2012GL053268.shtml

- Presentation by Dr. Jennifer Francis, Rutgers University
https://www.youtube.com/watch?v=RtRvcXUIyZg
http://marine.rutgers.edu/~francis/pres/Francis_Vavrus_2012GL051000_pub.pdf