Showing posts with label 2015. Show all posts

Sunday, April 26, 2015

Methane levels as high as 2845ppb

Methane levels as high as 2845 parts per billion (ppb) were recorded on April 25, 2015, as illustrated by the image below.


This is an extremely high peak. The average daily peak in 2015 until May 1 was 2371 ppb, while the highest daily mean ranged from 1807 ppb (January 10) to 1829 ppb (April 22). Daily peaks and daily highest mean levels in 2015 are shown on the image below.


These peaks are much higher than they were in previous years, as illustrated by the image below, from an earlier post and showing the average highest peak readings in 2013 and 2014 at selected altitudes..


Peak readings in above image are averages over April 2013 and April 2014. On specific days, peak readings could be much higher, e.g. on April 28, 2014, methane levels were recorded as high as 2551 ppb at 469 mb. As said, methane levels as high as 2845 ppb were recorded on April 25, 2015, while the average peak for the first four months of 2015 was 2371 ppb, and this average was calculated from peaks across altitudes.

The table below shows the altitude equivalents in mb (millibar) and feet.
56,925 ft44,689 ft36,850 ft30,569 ft25,543 ft19,819 ft14,383 ft8,367 ft1,916 ft
74 mb147 mb218 mb293 mb367 mb469 mb586 mb742 mb945 mb

Peak levels in April appear to be rising strongly each year, following higher peak readings during previous months, especially at higher altitudes, i.e. especially the Arctic Ocean. It appears that much of the additional methane originating from the higher latitudes of the Northern Hemisphere has moved closer to the equator over the past few months, and is now accumulating at higher altitudes over the continents on the Northern Hemisphere, i.e. Asia, Europe, North America and north Africa.

Further analysis of the rise in global mean methane levels appears to confirm the above. The image below shows methane levels on April 22, over three years. While there appears to be little or no rise in mean methane levels at low altitudes, the rise is quite profound at higher altitudes.  

[ click on image to enlarge ]
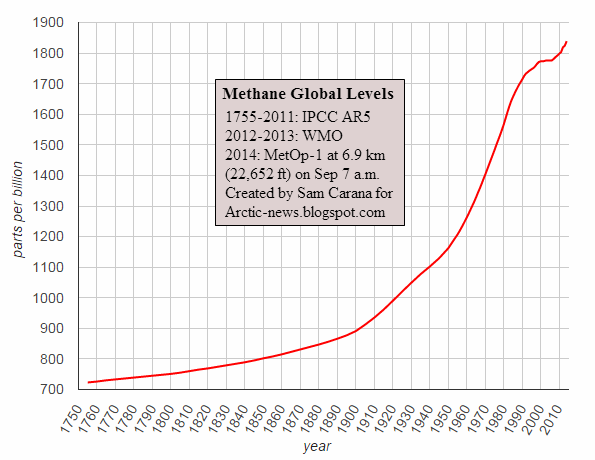
Things look set to get worse. As shown by the image below, from an earlier post, global methane levels have risen sharply from a low of 723 ppb in 1755. Mean methane levels were as high as 1839 ppb in 2014. That's a rise of more than 254%.
As that post concluded a year ago, it appears that the rise of methane in the atmosphere is accelerating. What can we expect? As temperatures can be expected to continue to rise and as feedbacks start to kick in, this may well constitute a non-linear trend. The image below shows a polynomial trend that is contained in IPCC AR5 data from 1955 to 2011, pointing at methane reaching mean global levels higher than 3000 ppb by the year 2030. If methane starts to erupt in large quantities from clathrates underneath the seafloor of the Arctic Ocean, this may well be where we are heading. 


The situation is dire and calls for comprehensive and effective action, as discussed at the Climate Plan.


The 2845 ppb recorded on April 25, 2015, is an extremely high peak. The average daily peak in 2015 until now was 2372...
Posted by Sam Carana on Monday, April 27, 2015

Thursday, April 23, 2015

It's time to 'Do the math' again

By David Spratt

Have we gone mad? A new report released today explains why contemporary climate change policy-making should be characterised as increasingly delusional.

As the deadline approaches for submissions to the Australian government's climate targets process, there is a flurry of submissions and reports from advocacy groups and the Climate Change Authority.

Most of these reports are based on the twin propositions that two degrees Celsius (2°C) of global warming is an appropriate policy target, and that there is a significant carbon budget and an amount of "burnable carbon" for this target, and hence a scientifically-based escalating ladder of emission-reduction targets stretching to mid-century and beyond.

A survey of the relevant scientific literature by David Spratt, "Recount: It's time to 'Do the math' again", published today by Breakthrough concludes that the evidence does not support either of these propositions.

The catastrophic and irreversible consequences of 2°C of warming demand a strong risk-management approach, with a low rate of failure. We should not take risks with the climate that we would not take with civil infrastructure.

There is no carbon budget available if 2°C is considered a cap or upper boundary as per the Copenhagen Accord, rather than a hit-or-miss target which can be significantly exceeded; or if a low risk of exceeding 2°C is required; or if positive feedbacks such as permafrost and other carbon store losses are taken into account.

Effective policy making can only be based on recognising that climate change is already dangerous, and we have no carbon budget left to divide up. Big tipping-point events irreversible on human time scales such as in West Antarctica and large-scale positive feedbacks are already occurring at less than 1°C of warming. It is clear that 2°C of climate warming is not a safe cap.

In reality, 2°C is the boundary between dangerous and very dangerous climate change and 1°C warmer than human civilisation has ever experienced.

In the lead up to the forthcoming Paris talks, policy makers through their willful neglect of the evidence are in effect normalising a 2.5–3°C global warming target.

This evidence in "Recount: It's time to 'Do the math' again" demonstrates that action is necessary at a faster pace than most policy makers conceive is possible.


Related

- It's time to 'Do the math' again
http://www.climatecodered.org/2015/04/its-time-to-do-math-again.html

- RECOUNT - It's time to 'Do the math' again
http://media.wix.com/ugd/148cb0_938b5512abfa4d4e965ec8cc292893f7.pdf

- Two degrees of warming closer than you may think
http://arctic-news.blogspot.com/2015/02/two-degrees-of-warming-closer-than-you-may-think.html

- The real budgetary emergency and the myth of "burnable carbon"
http://arctic-news.blogspot.com/2014/05/the-real-budgetary-emergency-and-the-myth-of-burnable-carbon.html

It's time to 'Do the math' again | by David Spratt http://arctic-news.blogspot.com/2015/04/its-time-to-do-math-again.html

Posted by Sam Carana on Thursday, April 23, 2015

Wednesday, November 14, 2012

Arctic Sea Ice set to collapse in 2015

The image below depicts Arctic sea ice volume as calculated by PIOMAS (the Pan-Arctic Ice Ocean Modeling and Assimilation System at the Polar Science Center

Total Arctic sea ice volume from PIOMAS showing the volume of the mean annual cycle.

Below, the average monthly volume data over the years with exponential trends added by Wipneus, incorporating the data for November 2012. 
In November 2012, the average Arctic sea ice thickness over ice-covered regions fell below one meter, as illustrated by the image below. 
Average Arctic sea ice thickness over the ice-covered regions from PIOMAS for a selection of years.
The average thickness is calculated for the PIOMAS domain by only including locations where ice is thicker than .15 m
As the sea ice gets thinner, the risk increases that the ice will break up. More open water makes the Arctic Ocean more prone to storms and associated feedbacks that can be expected to speed up such break up. Furthermore, they can push much of the ice into the Atlantic Ocean, leaving little ice in the Arctic Ocean to reflect sunlight back into space and to act as a buffer when temperatures start rising again the following year. For more on such feedbacks, see the post Diagram of Doom

Professor Peter Wadhams warns in an article in Scientific American that the rate at which summer melting is outstripping accumulation of new ice in winter makes the entire ice cover likely to collapse by 2015. Less ice means that less sunlight will be reflected back into space; as a result, warming in the Arctic will accelerate dramatically. Because a third of the Arctic Ocean is composed of shallow shelf seas, surface warming will extend to the seabed, melt offshore permafrost and trigger the release of methane, which has a much greater greenhouse warming effect than CO2. A Russian-U.S. expedition led by Igor Semiletov has recently observed more than 200 sites off the coast of Siberia where methane is welling up from the seabed. Atmospheric measurements also show that methane levels are rising, most likely largely from Arctic emissions. To avoid the consequences of a collapse of summer ice, we need to bring back the ice we have lost. That will require more than merely slowing the pace of warming—we need to reverse it, Professor Wadhams adds. 

Sunday, June 10, 2012

Arctic sea ice volume on track to reach zero around 2015

The image below shows recent data on Arctic sea ice volume, as calculated using the Pan-Arctic Ice Ocean Modeling and Assimilation System (PIOMAS, Zhang and Rothrock, 2003) developed at the Polar Science Center, Applied Physics Laboratory, University of Washington.


As shown on the images below, by Wipneus and earlier published at the Arctic Sea Ice Blog, sea ice volume loss is on track to reach a minimum of 3000 cubic kilometers this summer.
The recent sea ice volume is in line with the exponential trend calculated by Wipneus that is pointing at zero ice volume around 2015 (image below).


Will sea ice collapse in 2014?As described in an earlier post, I believe that a trendline pointing at 2014 fits the data best (image left).

As discussed, some ice may persist close to Greenland for a few years more, since Greenland constitutes a barrier that holds the sea ice in place. Similarly, natural variability could prolong the ice longer than expected.

However, such arguments offer no reason to rule out an imminent collapse of the sea ice, since natural variability works both ways, it could bring about such a collapse either earlier or later than models indicate.

In fact, the thinner the sea ice gets, the more likely an early collapse is to occur. There is robust evidence that global warming will increase the intensity of extreme weather events, so more heavy winds and more intense storms can be expected to increasingly break up the remaining ice in future, driving the smaller parts out of the Arctic Ocean more easily. Much of the sea ice loss already occurs due to sea ice moving along the edges of Greenland into the Atlantic Ocean.

Could you think of any reason why Arctic sea ice would NOT collapse in 2014?