The Northern Hemisphere temperature was 12.86°C on March 19, 2025, a record daily high and 1.65°C higher than 1979-2000.
Very high temperature anomalies are forecast over the Arctic Ocean for November 2025.
 |
| [ Nov 2025 temperature anomaly forecast ] |
The image on the right shows the same forecast of temperature anomalies for November 2025, in this case with a Northern Hemisphere projection. Very high anomalies are visible over the Arctic Ocean, showing anomalies of 13°C, i.e. at the end of the scale, so anomalies may be even higher over some parts of the Arctic Ocean.
What makes such high temperatures possible is a combination of conditions and mechanisms as described below. Some conditions have been building up for a long time, whereas some mechanisms can contribute to a very rapid acceleration of the temperature rise.
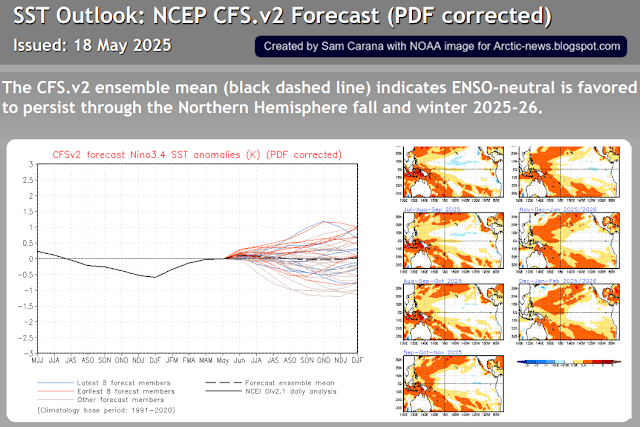
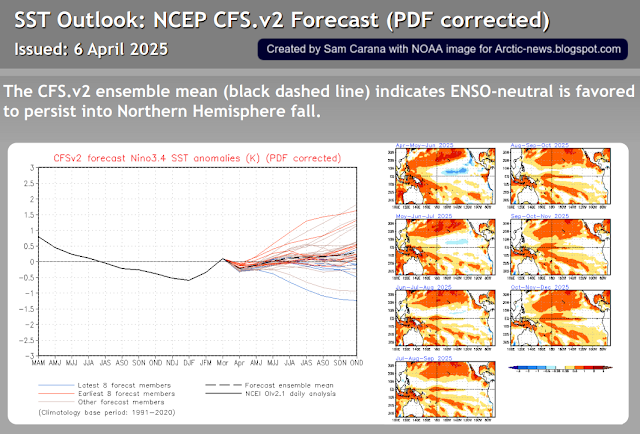
1. ENSO - a new El Niño could emerge in 2026. The image below shows NOAA's forecast outlook issued
March 30, 2025, with rising El Niño probabilities.
2. Sunspots - have long been
far higher than predicted, while expected to reach their peak in the current cycle in July 2025. NOAA has meanwhile added
new predictions based on a
nonlinear curve fit to the observed monthly values for the sunspot number and F10.7 Radio Flux, updated every month as more observations become available.
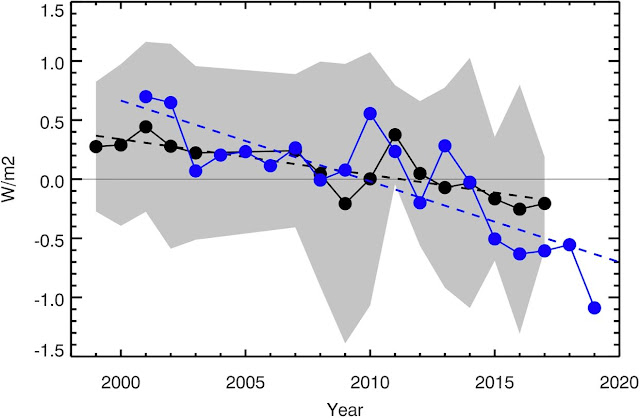
3. Earth's Energy Imbalance - very high and rising, as illustrated by the image below by
Leon Simons.
4. Greenhouse gasesHigh concentrations of greenhouse gases such as carbon monoxide (CO₂) and of other gases result in high temperatures. The daily CO₂ at Mauna Loa, Hawaii, was
430.60 parts per million (ppm) on March 7, 2025, the highest daily average on record. To find CO₂ levels this high back in history, one needs to go back millions of years, as illustrated by the image below, from an
earlier post.

What makes current conditions even more dire is that not only are concentrations of CO₂ very high, but the speed at which CO₂ is rising is also unprecedented, while additionally there has been an increase in
total solar irradiance of ∼400 Wm⁻² since the formation of the Earth. The image below shows the combined climate forcing by changing CO₂ and solar output for the past 450 million years.
Between 14 and 15 million years ago, the temperature in central Europe was 20°C higher than today, as illustrated by the image below (adapted from a
2020 study by Methner et al.).
Given today's very high CO₂ levels, why is the temperature in central Europe not 20°C higher today? It can take long for oceans to heat up due to their mass, while ice also acts as a buffer, consuming heat in the process of melting and ice can also reflect a lot of sunlight back into space, as long as there is ice present.
A trend, based on 2015-2024 annual data, points at 1200 ppm CO₂ getting crossed in the year 2032, as illustrated by the image below.
The above trend illustrates that the
clouds tipping point could get crossed in early 2032 due to rising CO₂ alone, which on its own could push temperatures up by an additional 8°C. The clouds tipping point is actually at 1200 ppm CO₂e, so when taking onto account growth of other greenhouse gases and further mechanisms, the tipping point could be crossed much earlier than in 2033.
Methane in the atmosphere could be doubled soon if a trend unfolds as depicted in the image below. A rapid rise is highlighted in the inset and reflected in the trend.
The trend points at a doubling of methane by March 2026. If the trend would continue, methane concentrations in the atmosphere would by September 2026 increase to more than triple the most recent value, and would increase to more than fourfold the October 2024 value by the end of 2026.
A rise like the one depicted in the trend could eventuate as rising ocean heat destabilizes methane hydrates contained in sediments at the seafloor of the Arctic Ocean. The temperature rise in the Arctic would accelerate since the methane would have a huge immediate impact on temperatures over the Arctic and cause depletion of hydroxyl, of which there is very little in the atmosphere over the Arctic in the first place. Such a rise in methane would also cause dramatic increases in tropospheric ozone and in stratospheric water vapor. A large increase in methane over the Arctic would also trigger massive forest fires and tundra fires, devastating terrestrial permafrost and resulting in huge amounts of further emissions.
5. Sea surface temperatures
While it can take long for oceans to heat up due to their mass, sea surface temperatures can rise rapidly and what makes the situation worse is that as temperatures rise, stratification increases.
Slowing down of the Atlantic meridional overturning circulation (AMOC) results in a huge amount of ocean heat accumulating in the North Atlantic. Much of the heat in the North Atlantic could soon be pushed abruptly into the Arctic Ocean, as storms can temporarily speed up currents strongly, carrying huge amounts of ocean heat with them into the Arctic Ocean.
The mechanism behind this has been described often in earlier posts and
this page. Meanwhile, sea surface temperatures remain very high. The red trend on the image below points at a huge rise by 2026.
6. Less lower clouds - as temperatures rise, there is a decrease in lower clouds that have previously reflected a lot of sunlight back into space. A
2021 study finds that warming oceans cause fewer bright clouds to reflect sunlight into space, admitting even more energy into Earth's climate system.
7. Reductions in cooling aerosols
Reductions in sulfates and other cooling aerosols also result in albedo loss. Similarly, terpines from healthy trees can cause a lot of sunlight to be reflected back into space. Droughts, fires and deforestation can cause decreases in terpines. A recent
study led by Annele Virtanen concludes that the indirect cooling effect of aerosols is at the higher end of the uncertainty range of IPCC AR6 and of satellite-derived forcing estimates.
8. More heating aerosols
Heating aerosols such as soot are caused by road traffic, burning biomass for energy, burning wood for heat and forests fires. Such aerosols cause heat to remain in the atmosphere, while they also speed up the decline of sea ice and glaciers through albedo loss and growth of algae.
9. Less sea ice and glaciers
Sea ice and glaciers have been in decline for many years and the decline may soon reach tipping points.
Arctic sea ice extent was 14.35 million km² on March 28, 2025, a record daily low for the time of year and 1.17 million km² lower than the extent in 2012 on this date. The comparison with extent in 2012 is important since Arctic sea ice extent was 3.18 million km² on September 16, 2012, an all-time low in this record dating back to 1981. A tipping point could be reached when sea ice falls below a critical threshold.
 |
[ Arctic-sea-ice extent, click on images to enlarge ]
|
A Blue Ocean Event could be declared when Arctic sea ice reaches or crosses a threshold of 1 million km² in extent. However, extent can include holes, gaps or cracks in the sea ice and melt ponds on top of the ice, all having a darker color than ice. By contrast, sea ice area is the total region covered by ice alone, making it a more critical measurement in regard to albedo than extent. Accordingly, the threshold for a Blue Ocean Event can be 1 million km² in area.
Arctic sea ice area typically reaches its annual minimum about half September. Arctic sea ice area was only 2.24 million km² on
September 12, 2012, i.e. 1.24 million km² away from a Blue Ocean Event. On March 19, 2025, Arctic sea ice area was 1.34 million km² lower than on March 19, 2012, as also discussed in an
earlier post. Therefore, would there be such a difference about half September 2025, a Blue Ocean Event could be declared.

The above image illustrates this, with the black dashed line indicating the threshold for a Blue Ocean Event and the red dotted line indicating Arctic sea ice area 1.34 million km² below what it was in 2012 for the respective date.
Loss of albedo can occur due to retreat of sea ice, due to developments of cracks and holes in the sea ice, and due to discoloring of sea ice, which includes soot settling on the sea ice, growth of algae and ponding water on ice due to melting, as discussed in a recent
study led by Philip Dreike.
Loss of albedo can also occur due to loss of lower clouds and due to reduction in cooling aerosols (mechanism 3). Thawing of terrestrial permafrost is a further self-reinforcing feedback mechanisms that can cause more albedo loss as well as more emissions of carbon dioxide, methane and nitrous oxide, thus further accelerating the temperature rise in the Arctic.
- as sea ice, permafrost and glaciers disappear.
Arctic sea ice decline comes not only with loss of albedo, but also with loss of the latent heat buffer that previously consumed a lot of heat entering the Arctic Ocean from the Atlantic Ocean and the Pacific Ocean. This mechanism constitutes a critical tipping point.
 |
| [ Arctic sea ice volume, click to enlarge ] |
Loss of Arctic sea ice volume is illustrated by the image on the right, indicating that Arctic sea ice has become much thinner over the years.
Sea ice acts as a Buffer that previously consumed much incoming ocean heat. As temperatures rise, sea ice thins and the Buffer disappears.
The disappearance of the Buffer occurs at the same time as increasingly larger amounts of ocean heat are entering the Arctic Ocean from the North Atlantic Ocean and the Pacific Ocean.
Consequently, the temperature of the water of the Arctic Ocean threatens to increase dramatically.
 |
| [ Arctic sea ice volume, click to enlarge ] |
The image on the right illustrates the decline of Arctic sea ice volume over the years.
More heat in turn threatens to reach sediments at the seafloor of the Arctic Ocean and destabilize hydrates contained in the these sediments, resulting in eruptions of huge amounts of methane from hydrates as well as from methane stored in the form of free gas underneath these hydrates.
The image below illustrates these mechanisms and their interaction and amplification, i.e. the thinning of Arctic sea ice, the increase in ocean heat and the threat of methane eruptions.
 |
| [ The Buffer is gone ] |
Further mechanismsThere are many further mechanisms that jointly can rapidly speed up the temperature rise. Many of these mechanisms are self-reinforcing
feedbacks that can interact and amplify each other, such as the formation of a
freshwater lid at the surface of the North Atlantic, as also illustrated by the images above and below.
 |
| [ formation of a freshwater lid at the surface of the North Atlantic ] |
Global warming is causing more extreme weather events all around the world, and as temperatures keep rising, these events look set to become more extreme, i.e. hitting larger areas for longer, with higher frequency, more ubiquity and greater intensity.
For more on mechanisms behind a steep rise in temperature, also see this
earlier post.
Warnings ignored
A 2013 post issued a runaway global warming warning, i.e. that a 2°C global temperature rise could eventuate by 2024 and that a 10°C global temperature rise could eventuate by 2040. A post later in 2013 warned that the global temperature rise could continue beyond 20°C, with the added comment that it is in many respects irrelevant whether a temperature rise of 20°C will be reached in 2049, 2050 or 2051; the point is, as Sam Carana said in 2013, that we're facing a global temperature rise of potentially more than 20°C and that such a temperature rise would devastate Earth and drive most species (including human beings) to extinction well before such a temperature rise is reached.
A 2015 post shows an update of the 10°C global temperature rise image, as well as an image with estimates of the climate-related deaths that could occur would such a rise eventuate, while a post later in 2015 shows an update of the warning of a 20°C global temperature rise combined with the accumulated climate-related deaths in a single image (copy below).

Sadly, politicians have long ignored warnings that a steep rise in temperature could occur and that this would result in a horrific number of associated deaths. In some respects, warnings were confusing and too conservative, e.g. the above image may have given the wrong impression that the temperature rise would be gradual and that we had until the year 2054 to get into action, whereas over the years indications have become ever stronger that a huge rise could take place within a few years, even within one year, as discussed below.
A warning was issued in 2016 that the temperature could rise by more than 10°C by 2026. The 2016 analysis is recreated below. The most recent NASA data gives the February 2016 temperature an anomaly of 1.35°C above 1951-1980. A number of non-linear trends can be calculated based on the anomalies, including one trend based on 2000-2016 data pointing at 10°C getting crossed by 2026 and another trend based on 1880-2016 data pointing at 1.5°C getting crossed in 2030, as shown by the chart and the details below.
Three further trends can be calculated, based on different periods, two of them pointing at a rise of 10°C by 2017 and one trend pointing at a rise of 10°C by 2016, thus indicating that such a steep rise could happen very fast.
The
clouds tipping point is mentioned above. A
2019 study concludes that crossing a tipping point of 1200 ppm CO₂e could cause the disappearance of marine stratus clouds, resulting in a global temperature rise of 8°C, which would come on top of the rise associated with greenhouse gases reaching 1200 ppm CO₂e.
The image on the right illustrates how much conditions and mechanisms could each contribute to such a huge temperature rise.
Very fast mechanisms include panic. As more people start to realize how dire the situation is and as they seek to occupy the last few habitable areas left, more people may stop showing up for work, resulting in a rapid loss of the aerosol masking effect, as industries that now co-emit cooling aerosols (such as sulfates) come to a grinding halt (mechanism 7 above).
As it becomes harder to obtain food and fuel for cooking and heating, and as the grid shuts down due to conflicts and people no longer showing up for work, many people may start collecting and burning more wood, decimating the forests that are left and resulting in more emissions that further speed up the temperature rise.
As temperatures rise, huge fires could also break out in forests, peatlands, grassland and urban areas (including backyards, landfills and buildings, in particular warehouses containing flammable materials, chemicals and fluorinated gases), further contributing to more emissions that speed up the temperature rise.
As the likeliness of a huge and accelerating temperature rise, the severity of its impact, and the ubiquity and the imminence with which it will strike all become more manifest—the more sobering it is to realize that a mere 3°C rise may suffice to cause human extinction. Indeed, humans will likely go extinct with a 3°C rise and most life on Earth will disappear with a 5°C rise, as discussed in an
earlier post and illustrated by the image below.
According to a recent study lead by Richard Meade, many regions may soon experience heat and humidity levels that exceed the safe limits for human survival. "Our research provided important data supporting recent suggestions that the conditions under which humans can effectively regulate their body temperature are actually much lower than earlier models suggested," states co-author Glen Kenny.
Climate Emergency DeclarationThe situation is dire and the precautionary principle calls for rapid, comprehensive and effective action to reduce the damage and to improve the situation, as described in
this 2022 post, where needed in combination with a Climate Emergency Declaration, as discussed at
this group.
Links• Climate Reanalyzer
https://climatereanalyzer.org• Tropical Tidbits
https://www.tropicaltidbits.com• Past and Future CO2 - guest post by Gavin Foster, Dana Royer and Dan Lunt (1 May 2014)
https://skepticalscience.com/Past-and-Future-CO2.html• NOAA - ENSO: Recent Evolution,
Current Status and Predictions - 31 March 2025
https://www.cpc.ncep.noaa.gov/products/analysis_monitoring/lanina/enso_evolution-status-fcsts-web.pdf• Leon Simons - Earth's Energy Imbalance
https://bsky.app/profile/leonsimons.bsky.social/post/3llcffaa65s2d• High sensitivity of cloud formation to aerosol changes - by Annele Virtanen et al. (2025)
https://www.nature.com/articles/s41561-025-01662-y


