Globally, temperatures have been at record high levels for the time of year for some time in 2023, as illustrated by the image below, adapted from Climate Reanalyzer.
On August 25, 2023, the world temperature was 16.99°C, 0.94°C higher than it was on that day in 1979-2000.
Extreme heat stress alert
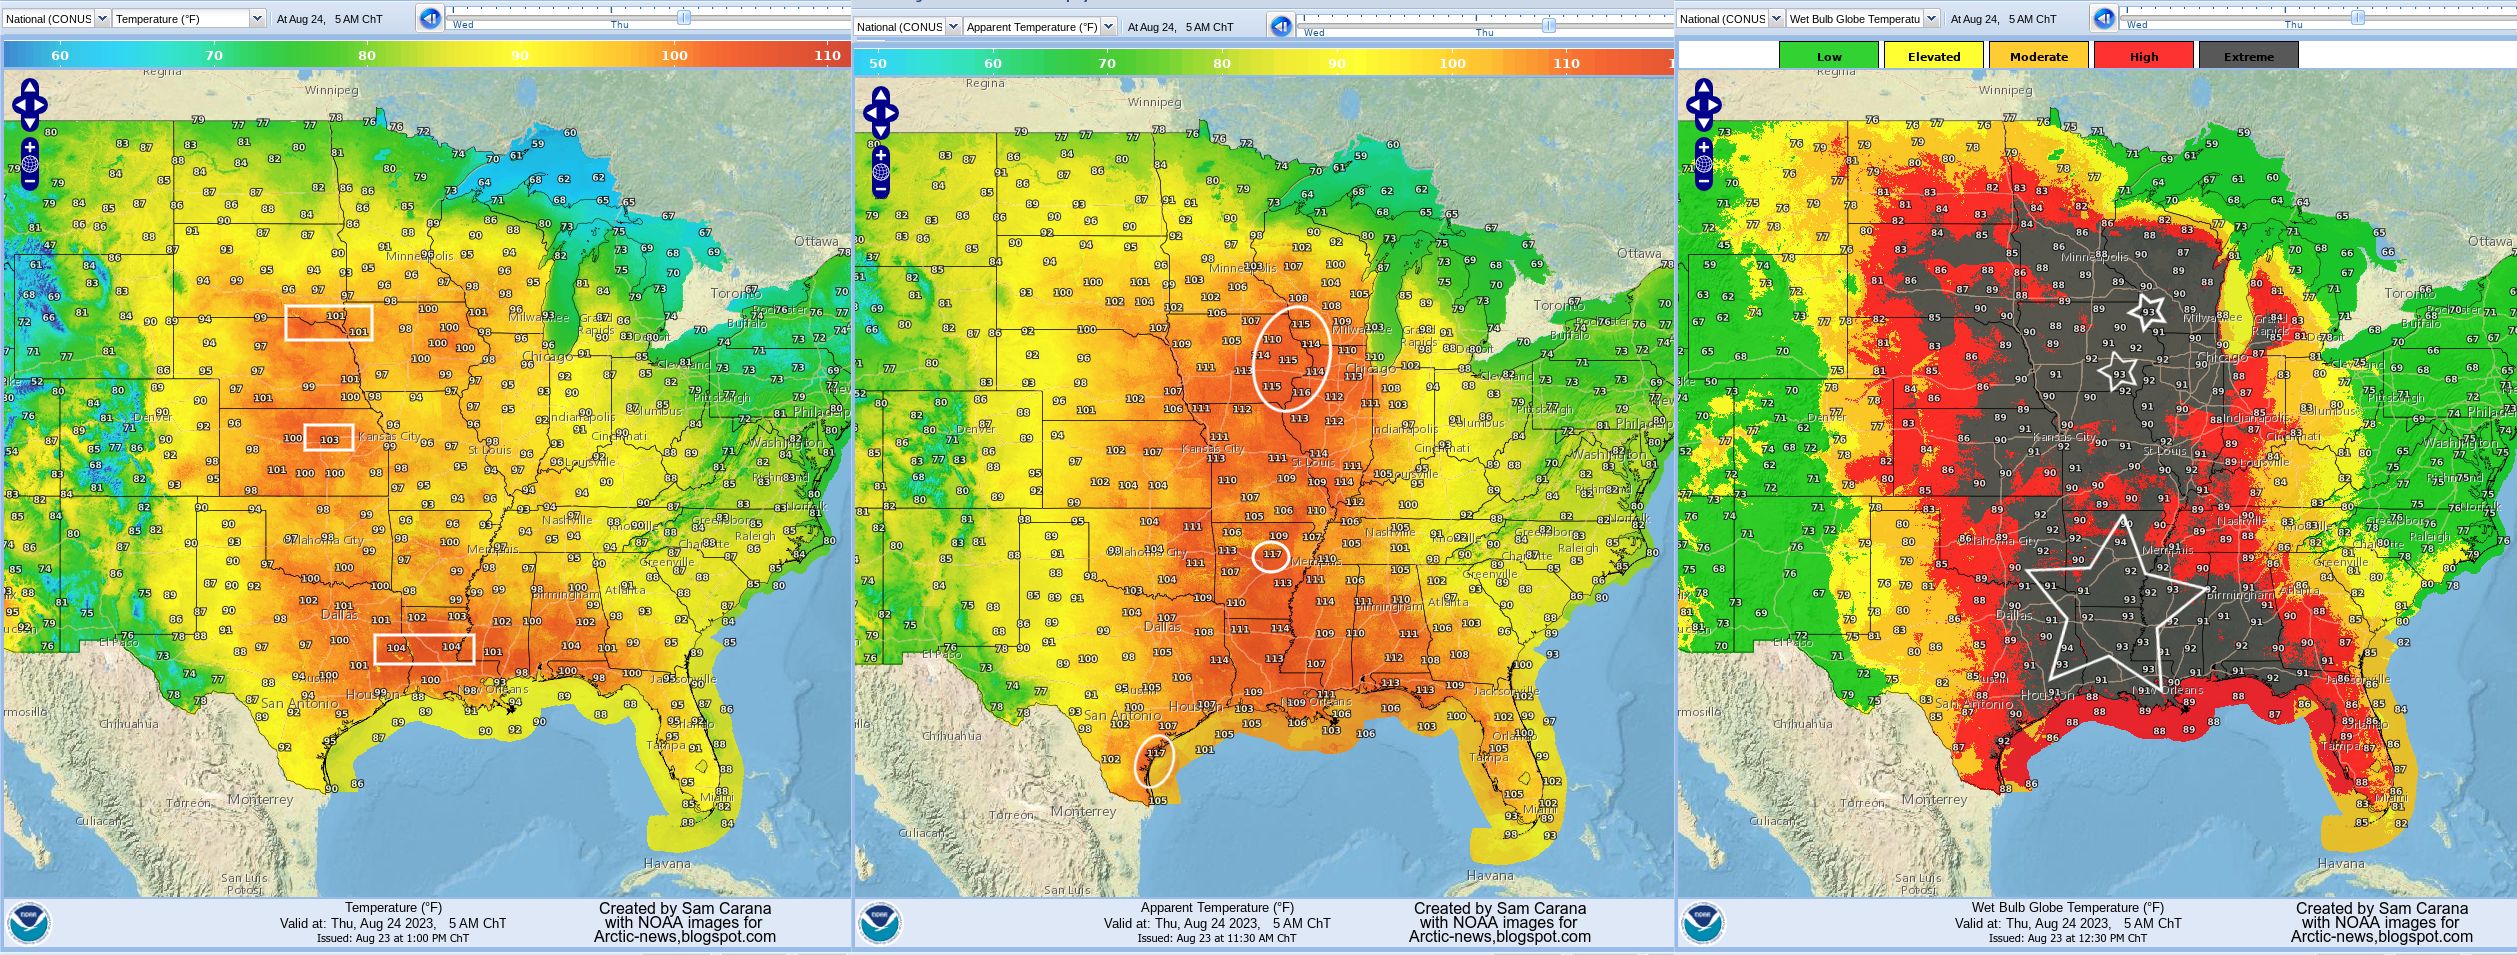
High Wet Bulb Globe Temperatures hit the U.S. over a large area, over a long time.
Wet Bulb Globe Temperatures were forecast to be as high as 95°F or 35°C in Lufkin, Texas, on Monday August 21, 2023 at 4 am Central Time.
Wet Bulb Globe Temperatures as high as 35°C were also forecast to be reached in Topeka, Kansas on the same day and at the same time, as illustrated by the image below.
The image below shows forecasts for August 24, 2023, measured as temperature (left), apparent temperature (center) and wet bulb globe temperature (right), three areas with high values marked by squares, circles, and stars, respectively.
For descriptions of the various ways temperature can be measures, also see the earlier post Extreme Heat Stress.
Unbearable conditions
The images further illustrate that, as temperatures rise, conditions are increasingly occurring that make it hard, if not impossible for many species (including humans) to survive, even at relatively high latitudes. This danger has been discussed in many earlier posts, such as in Humans may be extinct in 2026 and Two Tipping Points.
In the video below, Guy McPherson gives his views on the situation.
The image below, adapted from Climate Reanalyzer, shows that the World Sea Surface Temperature (60°South - 60°North) was at a record high of 21.1°C or 69.98°F for the third day in a row on August 23, 2023. As the image also shows, sea surface temperatures over the past few months have been much higher for the time of year than in any other year on record.
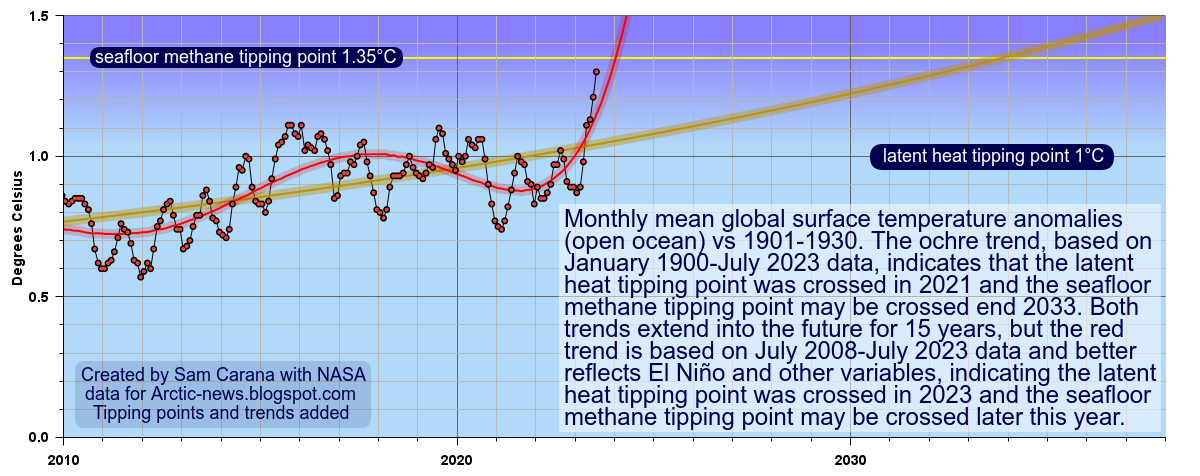
The image below shows why this recent sea surface temperature rise is so worrying. The image below is based on NASA data for monthly mean global surface temperature anomalies (open ocean) vs 1901-1930. The ochre trend, based on January 1900-July 2023 data, indicates that the latent heat tipping point was crossed in 2021 and the seafloor methane tipping point may be crossed by the end of 2033. Both trends extend into the future for 15 years, but the red trend is based on July 2008-July 2023 data and better reflects El Niño and other variables, and this red trend indicates that the latent heat tipping point was crossed in 2023 and the seafloor methane tipping point may be crossed later this year.
[ click on images to enlarge ]
Sea ice constitutes a latent heat buffer, consuming incoming heat as it melts. While the ice is melting, all energy (at 334 J/g) goes into changing ice into water and the temperature remains at 0°C (273.15K or 32 °F). Once all ice has turned into water, all subsequent energy goes into heating up the water, and will do so at 4.18 J/g for every 1°C the temperature of the water rises.
Loss of this buffer is linked to subsequent destabilization of methane hydrates. So, there are two tipping points that are linked, and the latent heat tipping point gets crossed in the Arctic before the seafloor methane tipping point gets reached.
The situation is particularly precarious in the Arctic, as the North Atlantic Ocean is very hot and the Gulf Stream keeps pushing hot water toward the Arctic Ocean, while Arctic sea ice has become very thin. The image on the right, from Uni of Bremen, shows that on July 25, 2023, there was virtually no Arctic sea ice left that was more than 30 cm thick.
The latent heat tipping point is the point where Arctic sea ice loss is such that further incoming ocean heat that was previously consumed as Arctic sea ice melted, instead gets absorbed by the Arctic Ocean.
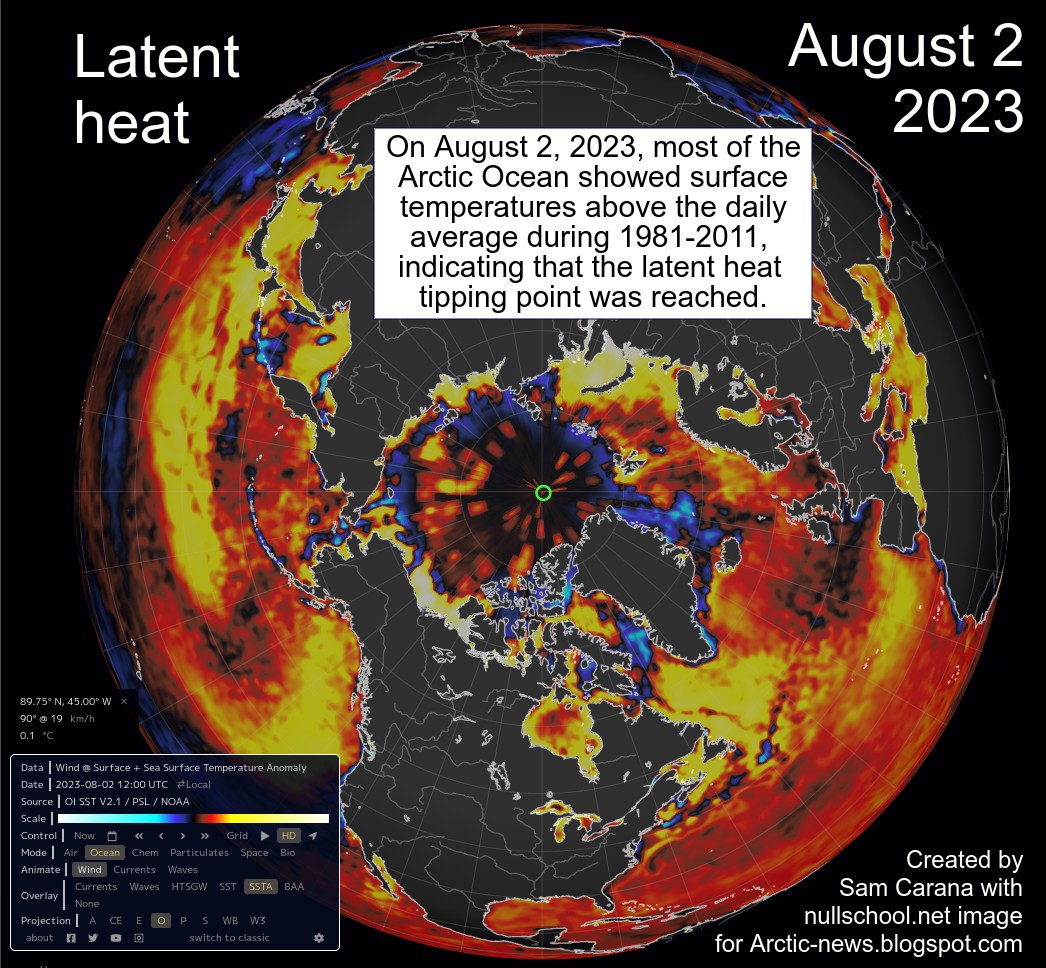
[ sea surface temperature anomaly ]
The image on the right, adapted from nullschool.net, shows that on August 2, 2023, most of the Arctic Ocean was showing surface temperatures above the daily average during 1981-2011, indicating that the latent heat tipping point was reached. The latent heat tipping point is estimated to correspond with an ocean temperature anomaly of 1°C above the long term average, 1901-1930 on the above image.
The image underneath, also from nullschool.net, shows the situation on August 20, 2023, when temperatures at the North Pole had been above zero for more than a day and temperatures were forecast to go below zero only twice briefly afterwards, for the period up to August 24, 2023 19:00 UTC (which is as far as the forecast went at the time.
[ surface temperature ]
This is a further indication that the latent heat tipping point has been reached and that no more heat can be consumed by sea ice melting.
How much sea ice is left? What does the sea ice look like, near the North Pole? Satellite images can give a good impression, but clouds can obscure the view. A clearer view can be obtained by comparing images over several days.
An animation can reveal how much, or rather how little sea ice is left, and to what extent water of the Arctic Ocean is visible.
[ Satellite view, click on images to enlarge ]
The animation on the right is made with four NASA Worldview images, showing the situation on August 11, 15, 16 and 19, 2023.
The second tipping point, the seafloor methane tipping point, occurs as more heat reaches the seafloor where it destabilizes hydrates contained in sediments at the seafloor.
This tipping point comes with multiple self-reinforcing feedback loops, such as explosive growth in methane volume setting off further destabilization, rapid rise of Arctic temperatures, loss of permafrost and loss of albedo, and release of further greenhouse gases.
Crossing of the seafloor methane tipping point will occur later than crossing of the latent heat tipping point, so the seafloor methane tipping point is estimated to correspond with a higher ocean temperature anomaly.
The current situation is particularly precarious in the Arctic, as the North Atlantic Ocean is very hot and the Gulf Stream keeps pushing hot water toward the Arctic Ocean, while Arctic sea ice has become very thin (image right) and the latent heat tipping point has been crossed.
As the temperature of the Arctic Ocean keeps rising, more heat can reach sediments located at the seafloor, since much of the Arctic Ocean is very shallow and sediments at the seafloor of the Arctic Ocean can contain vast amounts of methane.
The danger is that further heat will destabilize hydrates in these sediments, leading to explosive eruptions of methane, as its volume increases 160 to 180-fold when leaving the hydrates, and resulting in huge eruptions of methane both from the destabilizing hydrates and from methane that is present in the form of free gas underneath the hydrates.
The above image, from an earlier post, illustrates that warnings have been given before about the danger of these two tipping points getting crossed in the Arctic. In the above image, the trends are based on annual sea surface temperature data for the Northern Hemisphere. The seafloor methane tipping point is estimated to get crossed when the ocean temperature anomaly on the Northern Hemisphere goes beyond 1.35°C above its long term average.
The Argo Float 7900549 compilation image below illustrates that the highest water temperatures in the Arctic Ocean can occur at a depth of approximately 100 meters. The image shows temperatures as high as 5°C at that altitude.
Stronger winds along the path of the Gulf Stream can at times speed up sea currents that travel underneath the surface. As a result, huge amounts of hot, salty water can travel from the Atlantic Ocean into the Arctic Ocean, abruptly pushing up temperatures and salinity levels at the bottom of the Arctic Ocean, which in many places is very shallow.
The above image shows details of Argo float 9701007, further illustrating the danger that heat can reach the seafloor. North of Norway, where the water is less than 400 m deep, temperatures higher than 5°C show up throughout the vertical water column, up to August 10, 2023, when temperatures above 11°C were recorded close to the sea surface. The colored inset also shows that greater mixing down of heat occurred from October to December 2022, as the sea ice started to return and seal off the surface, preventing heat transfer from ocean to atmosphere, as also discussed at FAQ #11.
Below is another image adapted from Climate Reanalyzer, showing that the sea surface temperature of the North Atlantic Ocean has for months been much higher for the time of year than it was in previous years on record. Eight causes behind this have been discussed in an earlier post. The image below shows the situation on August 28, 2023, with the North Atlantic sea surface temperature reaching a record high of 25.34°C or 77.61°F.
The image below, adapted from NOAA, shows how the Gulf Stream is pushing ocean heat toward the Arctic Ocean, while sea surface temperatures show up as high as 33.6°C or 92.48°F on August 17, 2023.
[ 2022 animation ]
Studies, some of them dating back more than two decades, show that over the shallow East Siberian Arctic Shelf (ESAS) winds at times can mix the water column from the top to the bottom. A 2005 study of the ESAS led by Igor Semiletov recorded water temperatures at the seafloor, in September 2000, of 4.7°C at 20m depth at one location and 2.11°C at 41m depth at another location, with salinity levels of 29.7‰ and of 31.7‰, respectively.
A deformed Jet Stream, in combination with a cyclone, could similarly result in strong winds abruptly pushing a huge amount of heat through the Bering Strait into the Arctic Ocean.
The animation on the right shows how remnants of Typhoon Merbok were forecast to enter the Arctic Ocean through the Bering Strait from September 17 to 19, 2022.
The image below, adapted from Climate Reanalyzer, shows that the (2-meter) air temperature in the Arctic was 3.79°C on August 25, 2023, a record high for the time of year and 2.08°C higher than the 1979-2011 mean for that day.
The image below illustrates how incoming ocean heat that previously was consumed in the process of melting of the sea ice, is now causing the water of the Arctic Ocean to heat up, with more heat reaching the seafloor of the Arctic Ocean, which has seas that in many places are very shallow.
[ Latent heat loss, feedback #14 on the Feedbacks page ]
Further adding to the danger is that destabilization of methane hydrates can cause huge amounts of methane to erupt with great force in the form of plumes. Consequently, little of the methane can be broken down in the water by microbes, while there is very little hydroxyl in the atmosphere over the Arctic Ocean to break down the methane that enters the atmosphere.
Ominously, some very high methane levels were recorded recently at Barrow, Alaska, as illustrated by the NOAA images below.
The most recent monthly methane average recorded at Barrow, Alaska, is above 2080 parts per billion.
In the video below, Guy McPherson describes the dire situation.
Climate Emergency Declaration
A catastrophe of unimaginable proportions is unfolding. Life is disappearing from Earth and runaway heating could destroy all life. At 5°C heating, most life on Earth will have disappeared. When looking only at near-term human extinction, 3°C will likely suffice.
The Blob is a large mass of water with relatively high heat content, floating at the surface and underneath the surface of the North Pacific Ocean. The Blob did appear several times before, including in 2016, which was a strong El Niño year. The above image shows high sea surface temperature anomalies in the North Pacific on August 10, 2023, raising the question of whether this constitutes a return of the Blob.
As temperatures rise, the Arctic is heating more rapidly than the rest of the world. The narrowing temperature difference between the Arctic and the Tropics is weakening the speed at which the jet stream circumnavigates Earth and this is making the jet stream more wavy.
In a 2012 study, Jennifer Francis et al. warned that this makes atmospheric blocking events in the Northern Hemisphere more likely, aggravating extreme weather events related to stagnant weather conditions, such as droughts, flooding and heatwaves. The Blob appears to be the marine version of a heatwave on land.
The image below shows that, on August 12, 2023, sea surface temperatures were as much as 7°C or 12.6°F higher than 1981-2011 in the Pacific Ocean (at the green circle, follow the arrow). A strongly deformed Jet Stream shows many circular wind patterns, prolonging, intensifying and increasing the occurrence of extreme weather events such as accumulation of heat during heatwaves.
Is the Kuroshio Current slowing down?
The Kuroshio Current is an ocean current that carries heat along its path in the North Pacific, similar to the Gulf Stream in the North Atlantic Ocean. Is the Kuroshio Current slowing down as temperatures rise and is such slowing down causing hot water to accumulate in the western part of the North Pacific, leading to a return of a new Blob moving across the North Pacific toward the coast of North America?
The North Atlantic has been experiencing record high sea surface temperatures recently. A return of the Blob increases the danger of more heat reaching sediments at the seafloor of the Arctic Ocean.
[ 2022 animation ]
The animation on the right shows how remnants of Typhoon Merbok were forecast to enter the Arctic Ocean through the Bering Strait from September 17 to 19, 2022.
Studies, some of them dating back more than two decades, show that over the shallow East Siberian Arctic Shelf (ESAS) winds at times can mix the water column from the top to the bottom. A 2005 study of the ESAS led by Igor Semiletov recorded water temperatures at the seafloor, in September 2000, of 4.7°C at 20m depth at one location and 2.11°C at 41m depth at another location, with salinity levels of 29.7‰ and of 31.7‰, respectively.
A deformed Jet Stream, in combination with a cyclone, could result in strong winds abruptly pushing a huge amount of heat through the Bering Strait into the Arctic Ocean. This could cause methane hydrates to destabilize and huge amounts of methane to erupt from the seafloor and enter the atmosphere.
There are at least five mechanisms that cause the water of the Arctic Ocean to heat up, as described below.
1. Direct Heat. Heat from sunlight directly reaches the surface, i.e. the sea ice or the water of the Arctic Ocean.
The August 8, 2023, image on the right, from Climate Reanalyzer, shows a 1-3 days forecast of maximum surface temperatures (2m). Heatwaves over land can extend over the Arctic Ocean.
High levels of emissions and greenhouse gases over the Arctic increase the amount of heat that is reaching the water of the Arctic Ocean and the sea ice.
The NASA satellite image below shows smoke from forest fires in Canada moving over the Beaufort Sea and over the sea ice on August 6, 2023.
[ click on images to enlarge ]
A recent study highlights that forest fires can strongly contribute to the temperature rise. Smoke, soot and further aerosols settling on the sea ice also darken the surface, resulting in more sunlight getting absorbed (feedback #9 on the feedbacks page).
The image on the right, from a Copernicus news release dated August 3, 2023, shows the dramatic growth in emissions from fires in Canada up to end July 2023.
The news release quotes Copernicus Atmosphere Monitoring Service senior scientist, Mark Parrington, who comments: "As fire emissions from boreal regions typically peak at the end of July and early August, the total is still likely to continue rising for some more weeks."
The Climate Reanalyzer image below shows that the temperature in the Arctic was at a record high for the time of year of 5.64°C or 42.15°F on August 9, 2023. Earlier, a record temperature of 5.81°C or 42.46°F was reached (on July 27, 2023).
Arctic sea ice typically reaches its minimum extent half September, when temperatures in the Arctic fall below 0°C and water at the surface of the Arctic Ocean starts refreezing.
2. Heat from Rivers. Hot water from rivers ending in the Arctic Ocean is another way the water is heating up and this is melting the sea ice from the side.
The August 10, 2023, image below, from nullschool.net, illustrates the added impact of heat that is carried by rivers into the Arctic Ocean, with sea surface temperatures as high as 20.4°C or 68.7°F recorded at a location where the Mackenzie River flows into the Arctic Ocean (at the green circle, where the green arrow is pointing at).
On August 6, 2023, the sea surface was 14.5°C or 26.2°F hotter than in 1981-2011, at a nearby location where the Mackenzie River is flowing into the Arctic Ocean, as illustrated by the image below.
The image on the right shows that on August 10, 2023, the sea surface temperature was 17.6°C or 63.7°F at a location where the Lena River in Siberia enters the Arctic Ocean, i.e. 14.2°C or 25.5°F hotter than it was in 1981-2011 (at green circle).
The Lena River flows into the Laptev Sea which is mostly less than 50 meters deep, making it relatively easy for surface heat to reach the seafloor.
The NOAA image underneath on the right shows sea surface temperatures in the Bering Strait as high as 19.2°C or 66.56°F on August 8, 2023.
The image illustrates that the water can heat up strongly where hot water from rivers and run-off from rainwater enters the Bering Strait.
3. Ocean Heat. Yet another mechanism is heat that is entering the Arctic Ocean from other oceans, i.e. from the North Atlantic Ocean and the Pacific Ocean. Sea ice underneath the sea surface is melting from below due to ocean heat.
An earlier post discusses why we are currently facing record high sea surface temperatures in the North Atlantic.
The image below shows how the Gulf Stream is pushing ocean heat toward the Arctic Ocean, while sea surface temperatures show up as high as 33.1°C or 91.58°F on August 9, 2023.
The Gulf Stream is an ocean current that extends into the Arctic Ocean, as pictured below and discussed at this page. This ocean current is driven by the Coriolis force and by prevailing wind patterns.
This ocean current contributes to the stronger and accelerating rise in temperature in the Arctic (compared to the rest of the world), which in turn causes deformation of the Jet Stream that can at times cause strong winds that speed up this ocean current, as discussed in earlier post such as this 2017 one.
4. Sea ice moving out. The Arctic Ocean is also heating up as sea ice is getting pushed into the Atlantic Ocean. Even the thickest sea ice can break up into pieces and move along with the flow of meltwater from glaciers, ocean currents and/or strong wind.
[ Click on images to enlarge ]
The animation below, created with NASA Worldview satellite images, shows the northern tip of Greenland at the top left of each frame. The green square on the image on the right indicates the area of the animation. It's around Prinsesse Thyra Island in Northeast Greenland National Park.
This is where typically the thickest sea ice is located. The animation shows the sea ice breaking up and moving out of the Arctic Ocean. What is left of the pieces will eventually melt in the Atlantic Ocean. Pieces of sea ice that are pushed out of the Arctic Ocean reduce the latent heat buffer, as they can no longer consume heat in the Arctic Ocean through melting.
5. Sea ice sealing off the Arctic Ocean from the atmosphere
The sea ice used to reach its lowest extent approximately half September. With the change in seasons, air temperatures decrease and sea ice starts increasing in extent at the sea surface. The image below illustrates how, as the Arctic Ocean starts freezing over, less heat will from then on be able to escape to the atmosphere. Sealed off from the atmosphere by sea ice, greater mixing of heat in the water will occur down to the seafloor of the Arctic Ocean, as discussed in FAQ#21.
In October, sea ice has stopped melting and is increasing in extent at the surface of the Arctic Ocean. Also, as land around the Arctic Ocean freezes over, less fresh water will flow from rivers into the Arctic Ocean, while hot, salty water will continue to flow into the Arctic Ocean. As a result, the salt content of the Arctic Ocean increases, all the way down to the seafloor of the Arctic Ocean, increasing the danger that ice in cracks and passages in sediments at the seafloor will melt, allowing methane contained in the sediment to escape and enter the atmosphere.
Warmer water reaching these sediments can penetrate them by traveling down cracks and fractures in the sediments, and reach the hydrates. The image on the right, from a study by Hovland et al., shows that hydrates can exist at the end of conduits in the sediment. Such conduits were formed when some of the methane did escape from such hydrates in the past. Heat can travel down such conduits relatively fast and reach methane hydrates that keep methane in cages of ice. As heat reaches the ice cages, a temperature rise less than 1°C can suffice to destabilize such cages, resulting in a huge abrupt eruption, as the methane expands more than 160 times in volume.
[ The Buffer has gone, feedback #14 on the Feedbacks page ]
Further increasing the danger, this return of the sea ice results in less moisture evaporationg from the water, which together with the change of seasons results in lower hydroxyl levels at the higher latitudes of the Northern Hemisphere, in turn resulting in less methane getting broken down in the atmosphere over the Arctic.
Feedbacks and further developments
More generally, the rapid temperature rise threatens to cause numerous feedbacks to accelerate and further developments to occur such as crossing of tipping points, with the danger that the temperature will keep rising.
In the video below, Peter Carter, Paul Beckwith and Dale Walkonen discuss the situation.
One such feedbacks is the formation and growth of a cold freshwater lid at the surface of the North Atlantic that enables large amounts of salty and relatively hot water to flow underneath this lid and underneath the remaining sea ice, to enter the Arctic Ocean, as discussed earlier here, as well as here and at the feedbacks page.
This further increases the danger of destabilization of methane hydrates contained in sediments at the seafloor of the Arctic Ocean.
Ominously, some very high methane levels were recorded recently at Barrow, Alaska, as illustrated by the NOAA image below.
Conclusion
The situation is dire and the outlook is getting more grim every day, calling for a Climate Emergency Declaration and implementation of comprehensive and effective action, as described in the Climate Plan and as most recently discussed at Transforming Society.
It has been overlooked during Garma festival that, under current policies, global warming would render aboriginal lands in central and northern Australia unliveable and the top-end a nuclear target…
In his classic book The Fate of the Earth speaking for humanity Jonathan Schell describes the horror of a full-scale nuclear holocaust where human beings and animals would die if twenty thousand megatons of bombs, more than a million times the Hiroshima bomb, explode.
The consequences of a global nuclear exchange belong to the unthinkable. Nuclear weapons are the most destructive, inhumane and indiscriminate weapons ever created. Both on the scale of the devastation they cause and uniquely persistent genetically damaging radioactive fallout, they are unlike any other weapons. A single nuclear bomb detonated over a large city could kill millions of people. The use of tens or hundreds of nuclear bombs would disrupt the atmosphere world-wide, causing widespread famine.
[ Figure 1. Extreme geophysical, meteorological, hydrological and climatological events during 1980 -2012 ]
From the 1970s the full implications of climate change were only beginning to be realized, through a growing string of cyclones, fires, droughts and floods increasing in frequency and intensity above the recent historical record (Figure 1). At that time few could forecast the climate trajectory like NASA’s chief climate scientist (Hansen et al., 2012), who stated:
“Burning all the fossil fuels would create a different planet than the one that humanity knows. The paleoclimate record and ongoing climate change make it clear that the climate system would be pushed beyond tipping points, setting in motion irreversible changes, including ice sheet disintegration with a continually adjusting shoreline, extermination of a substantial fraction of species on the planet, and increasingly devastating regional climate extremes” and “warming according to the IPCC Business As Usual’ (BAU) scenario would lead to a disastrous multi-meter sea level rise on the century timescale” and “We’ve reached a point where we have a crisis, an emergency, but people don’t know that” ...
[ Figure 2. credit: NOAA, click on images to enlarge ]
According to Hans Joachim Schellnhuber, Germany’s chief climate scientist “Climate change is now reaching the end-game, where very soon humanity must choose between taking unprecedented action or accepting that it has been left too late and bear the consequences” …
Within a century or less the Earth’s mean temperature has risen from the mean levels of the Holocene (the last 11,700 years) and the Pleistocene (11,700 years ago to 2.58 million years ago), to levels of the Pliocene (2.58 million years ago to 5.333 million years ago) to the Miocene (5.33 to 23.03 million years ago), 3 - 4°C warmer than the Holocene, at warming rates. This is faster than any identified in the Cenozoic (66 million years until the present) geological record (Glikson, 2022-23). It is difficult to find in the geological record an event increasing the global greenhouse level at a rate as extreme as the current global heating (Figure 4).
[ Figure 4. Past mean temperatures (200 AD to 2000 AD), current warming and future temperature projections (Steffen, 2012) ]
A nuclear war would represent the ultimate outcome of tribalism, nationalism, racism and war, the human propensity for mutual and self-destruction. There was a time when kings and generals would fall on their sword when they were defeated, or when their faith in their gods collapsed. Nowadays oblivious or non-caring world powers continue to proliferate nuclear weapons on hair triggeralert, mine coal and pump oil and gas, starting a greenhouse chain reaction. Leaders, so-called, opportunistically betray the defence of their own people and the future of their children. The voices of anti-nuclear and climate scientists have become subdued, ignored or betrayed. There may not be too many historians to document the 20-21ˢᵗ centuries crimes against humanity and against nature.
An explanation of the collapse of human society, dragging multiple species down with it, arises from Fermi’s Paradox, where the combination of technological achievements and an inherent killer instinct of some leads to collapse.
Andrew Glikson
A/Prof. Andrew Y Glikson Earth and Paleo-climate scientist