Showing posts with label aerosols. Show all posts

Friday, October 13, 2023

Temperature rise - September 2023 and beyond

The above image, adapted from NASA and the image below, adapted from Climate Reanalyzer and using the same baseline, illustrate the September 2023 temperature anomaly.


September 2023 was the month with the highest temperature anomaly on record. What contributed to this?

El Niño
 

The temperature rose about 0.5°C from November 2022 to March 2023, and this occurred at a time when we were not even in an El Niño yet, as illustrated by the above image, from an earlier post. Below is an updated image, from January 1950 to September 2023, adapted from NOAA

[ click on images to enlarge ]
[ click on images to enlarge ]
The current El Niño is still strengthening, as illustrated by the image on the right, adapted from IRI.

Further contributors

There are further reasons why the temperature can be expected to keep rising beyond September 2023.

The number of sunspots has been higher than predicted and looks set to keep rising above predicted levels until July 2025, as discussed here.

The eruption of the submarine volcano near Tonga in January 2022 caused a lot of water vapor to reach high up into the atmosphere and this may still contribute to the temperature rise, as discussed here.

Aerosols that have a cooling effect, such as dust and sulfates (SO₄), are also important. As fossil fuel is burned, sulfates are co-emitted. Since they pollute the air, measures have been taken and are being taken to reduce them, e.g. in shipping, and this has pushed up the temperature rise. Meanwhile, cooling aerosols such as sulfates are still high. As illustrated by the image below, adapted from nullschool.net, SO₄ was as high as 8.621 τ at the green circle on October 6, 2023, at 07:00 UTC. In future, SO₄ could fall dramatically, e.g. in case of a sudden economic collapse, reducing the aerosol masking effect rapidly and abruptly causing a substantial rise in temperature.


After little change in the Antarctic sea ice extent graph for decades, extent loss was dramatic in 2022 and even more dramatic in 2023, as less and less sunlight was getting reflected back into space and instead was getting absorbed by the water of the Southern Ocean, as illustrated by the image below, adapted from NSIDC.
Sea ice retreat comes with loss of albedo, i.e. loss of the amount of sunlight reflected back into space, resulting in more heat getting absorbed in the Southern Ocean, making it a self-reinforcing feedback loop. Clouds constitute another self-reinforcing feedback loop; a warmer Southern Ocean comes with fewer bright clouds, further reducing albedo, as discussed here and here. For decades, there still were many lower clouds over the Southern Ocean, reflecting much sunlight back into space, but these lower clouds have been decreasing over time, further speeding up the amount of sunlight getting absorbed by the water of the Southern Ocean, and this 'pattern effect' could make a huge difference globally, as a recent study points out. Emissivity is a further factor; open oceans are less efficient than sea ice when it comes to emitting in the far-infrared region of the spectrum (feedback #23 on the feedbacks page). 


The above image was created by Zach Labe with NSIDC data (Arctic + Antarctic) for each year from 1979 to 2023 (satellite-era; NSIDC, DMSP SSM/I-SSMIS). The image illustrates that global sea ice extent  recently reached the largest anomaly in the satellite record. Anomalies are calculated using a 5-day running mean from a climatological baseline of 1981-2010. 2016 is shown with a yellow line. 2023 is shown using a red line (updated 10/16/2023).

In the video below, Paul Beckwith discusses the importance of loss of sea ice at around -60° (South).


As said, there are many factors behind the temperature increase around latitude -60° (South). As Paul mentions, this latitude receives a lot of sunlight around the year. Therefore, it is not surprising that, as oceans continue to heat up, there is huge loss of sea ice at this latitude, as well as loss of lower clouds, while open oceans are additionally less efficient than sea ice when it comes to emitting in the far-infrared region of the spectrum. The image below, adapted from NASA, shows a white band around -60° (South), indicating that the Southern Ocean has long been colder there than elsewhere, but has recently started to catch up with the global temperature rise.


The above image also illustrates that anomalies are highest in the Arctic, narrowing the temperature difference between the Arctic and the Tropics, with the air flow slowing down accordingly. 

[ image adapted from Copernicus ]
This in turn changes the Jet Stream and the Polar Vortex, resulting in blocking patterns that can, in combination with rising temperatures, strongly increase the frequency, intensity, duration and area coverage of extreme weather events such as storms and lightning, heatwaves and forest fires.

Forest fires in Canada have been releasing massive amounts of emissions that push up the temperature, including greenhouse gases such as carbon dioxide, warming aerosols such as black carbon & brown carbon and NMVOC (non-methane volatile organic carbon) and carbon monoxide that reduce the availability of hydroxyl, resulting in more methane and ozone in the atmosphere. 

[ NH sea surface temperature anomaly ]
At the same time, slowing down of the Atlantic Meridional Ocean Current (AMOC) can result in more ocean heat accumulating at the surface of the North Atlantic, as illustrated by the image on the right, from an earlier post.

As temperatures rise, increased meltwater runoff from Greenland and more icebergs moving south, in combination with stronger ocean stratification and stronger storms over the North Atlantic, can also cause a freshwater lid to form at the surface of North Atlantic that can at times enable a lot of hot water to get pushed abruptly underneath this lid toward the Arctic Ocean. The danger is that more heat will reach the seafloor and destabilize methane hydrates contained in sediments at the seafloor of the Arctic ocean. 

Ominously, very high methane levels continue to be recorded at Barrow, Alaska, as illustrated by the image below, adapted from NOAA.

The next few months will be critical as Arctic sea ice is sealing off the Arctic Ocean from the atmosphere, trapping heat underneath the ice and making it harder for ocean heat to get transferred from the Arctic Ocean to the atmosphere above the Arctic. Furthermore, sea ice is very thin, reducing the latent heat buffer that could otherwise have consumed ocean heat. 

The next danger is that the thin Arctic sea ice will rapidly retreat early next year as a warming Arctic Ocean will transfer more heat to the atmosphere over the Arctic, resulting in more rain and more clouds in the atmosphere over the Arctic, speeding up sea ice loss and further pushing up the temperature rise over the Arctic, as discussed at the feedbacks page, which also discusses how less Arctic sea ice can push up temperatures through the emissivity feedback. As temperatures rise over the Arctic, permafrost on land also threatens to thaw faster, threatening to cause huge releases of greenhouse gases, including carbon dioxide, methane and nitrous oxide. 


Meanwhile, emissions of greenhouse gases keep rising, further pushing up the temperature, as illustrated by the image below, from an earlier post.
  
Global energy-related greenhouse gas emissions 2000-2022, adapted from EIA ]
In the video below, Guy McPherson describes how temperature rise, loss of habitat and meltdown of nuclear power facilities each could result in rapid extinction of humans and many other species.


There are numerous further feedbacks that can accelerate the temperature rise and tipping points that can get crossed and cause even more abrupt rise of the temperature. One of these is the clouds tipping point that in itself can cause a temperature rise of 8°C, as discussed here.

Further feedbacks are also discussed at the Extinction page.  One further feedback is water vapor. A warmer atmosphere holds more water vapor, at a rate of 7% for each Degree Celsius the temperature rises. As temperatures keep rising, ever more water vapor will be sucked up by the atmosphere. This will also cause more droughts, reducing the ability of land to sustain vegetation and provide soil cooling through shading and through evaporation and formation of lower clouds, as discussed here. More water vapor in the atmosphere will also speed up the temperature rise because water vapor is a potent greenhouse gas.

The fact that such tipping points and feedbacks occur as greenhouse gas levels reach certain levels and as the temperature rise makes it critical to assess how fast greenhouse gas levels could rise and by how much the temperature has already risen. 

NASA data up through September 2023

The image below, adapted from NASA, shows that the September 2023 NASA Land+Ocean temperature was 1.78°C higher than it was in September 1923. The anomaly is 1.74°C when compared to a base centered around the year 1900 (1885-1915). The 1.74°C anomaly can be adjusted by 0.99°C to reflect a pre-industrial base, air temperature and higher polar anomalies (as shown in the box on the bottom right of the image), adding up to a potential anomaly of 2.73°C. 

[ click on images to enlarge ]
Indeed, earlier analysis such as discussed here, points out that the temperature may already have risen by more than 2°C (compared to pre-industrial) in 2015, when politicians pledged at the Paris Agreement to take action to combat the temperature rise to prevent this from happening. 

Blue: Polynomial trend based on Jan.1880-Sep.2023 data. 
Magenta: Polynomial trend based on Jan.2010-Sep.2023 data.
The above image is created with NASA Land+Ocean monthly mean global temperature anomalies vs 1885-1915, adjusted by 0.99°C to reflect ocean air temperature, higher polar anomalies and a pre-industrial base, and has trends added.  

Alarms bells have been sounding loud and clear for a long time, as discussed in posts such as this one, warning that the temperature could rise by more than 3°C by 2026. The above magenta graph shows how this could occur as early as next year (end 2024).

[ image from earlier post ]
[ image from the Extinction page ]
The above image illustrates the latent heat tipping point - estimated to correspond with a sea surface temperature anomaly of 1°C above the long term average (1901-1930 on the above image) - to get crossed and the seafloor methane tipping point - estimated to correspond with a sea surface temperature anomaly of 1.35°C - to get reached, as discussed in earlier posts such as this one, .

A Blue Ocean Event could occur as the latent heat and seafloor methane tipping points get crossed, and the ocean temperature keeps rising, as huge amounts of methane get released in the Arctic, as ever more heat keeps reaching and destabilizing methane hydrates contained in sediments at the seafloor of the Arctic Ocean, as discussed in many earlier posts such as this one.

Seafloor methane is one of many elements that could jointly cause a temperature rise of over 10°C, in the process causing the clouds tipping point to get crossed that can push up the temperature rise by a further 8°C, as illustrated by the image on the right, from the extinction page.

Conclusion

The precautionary principle should prevail and the looming dangers should prompt people into demanding comprehensive and effective action to reduce the damage and to improve the situation. 

To combat rising temperatures, a transformation of society should be undertaken, along the lines of this 2022 post in combination with a declaration of a climate emergency.


Links

• NASA - global maps

• NOAA - ENSO and Temperature bars

• The International Research Institute for Climate and Society, Columbia University Climate School
https://iri.columbia.edu/our-expertise/climate/forecasts/enso/current/?enso_tab=enso-sst_table

• Nullschool.net

• NSIDC - sea ice graph

• Zach Labe - Global sea ice - extent, concentration, etc.

• NASA - zonal means
https://data.giss.nasa.gov/gistemp/zonal_means

• Copernicus - Northern Hemisphere wildfires: A summer of extremes
https://atmosphere.copernicus.eu/northern-hemisphere-wildfires-summer-extremes

• NOAA - Barrow Atmospheric Baseline Observatory, United States
https://gml.noaa.gov/dv/iadv/graph.php?code=BRW&program=ccgg&type=ts

• Paul Beckwith - Accelerated Global Warming from Antarctic Sea Ice Collapse: Albedo, Latitude, Snow Cover on Ice…
https://www.youtube.com/watch?v=-5P1W4TrczQ

• Guy McPherson - College of Complexes Presentation (with Improved Audio) 

• NASA custom plots
https://data.giss.nasa.gov/gistemp/graphs_v4/customize.html

• Transforming Society


Wednesday, June 7, 2023

Smoke over North America


High levels of biomass-burning aerosols show up over North America on the above June 7, 2023 06 UTC forecast by Copernicus.


The above satellite image shows the US East Coast, with New York blanketed in a veil of smoke on June 7, 2023.   


High levels of carbon monoxide are visible over North America on the above map. Carbon monoxide is forecast to be as high as 8715 parts per billion in Quebec, Canada on June 8, 2023 (at 12:00 UTC, a few hours from now, at the green circle).

The map below shows the location for this measurement in Quebec, Canada on June 8, 2023 (at red marker). 


The image below also shows wind at 250 hPa, i.e. the Jet Stream. The circular wind patterns indicate how deformed the Jet Stream is. 


The image below, from an earlier post, further illustrates the extent of the deformation of the Jet Stream, showing the Jet Stream on June 6, 2023, with no less than 26 circular wind patterns (at 250 hPa) marked on the image, which also shows sea surface temperature anomalies. The Jet Stream is also crossing the Equator.


As an update, below is a forecast of biomass-burning aerosols for June 14, 2023. 


Links

• Copernicus
https://atmosphere.copernicus.eu

• Nullschool
https://earth.nullschool.net

• Google maps
https://earth.nullschool.net

• Fire
https://arctic-news.blogspot.com/p/fire.html

• Jet Stream
https://arctic-news.blogspot.com/p/jet-stream.html

• Feedbacks in the Arctic
https://arctic-news.blogspot.com/p/feedbacks.html

Sunday, January 29, 2023

The global climate change suicide pact

 by Andrew Glikson

Despite of deceptively-claimed mitigation of greenhouse gas (GHG) emissions in parts of the world, ongoing burning of domestic and exported fossil fuels world-wide continues to change the composition of the atmosphere, enriching it in greenhouse gases by yet another ~2 ppm CO₂ (2022: 418.95 ppm; CH₄: 1915 ppb; N₂0: 337 ppb), reaching levels commensurate with those of the Miocene (23.03 to 5.333 Ma) at rise rates exceeding any in the geological record of the last 66 million years (Glikson, 2020) (Figure 1). 

Figure 1. Global 1880-2021 annual average temperatures (adapted by UCAR from ClimateCentral).

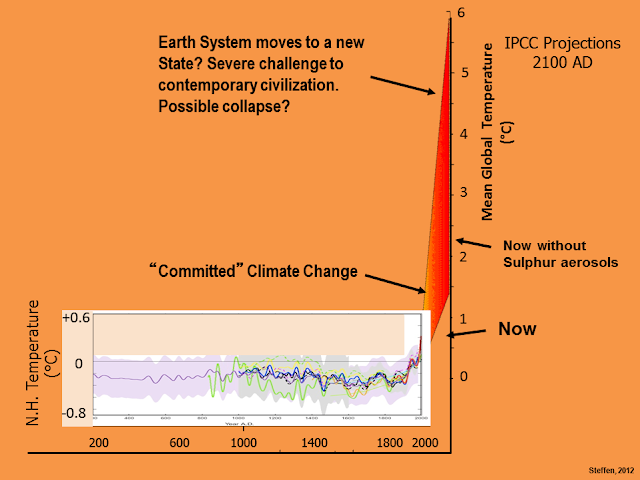
Since 1880 mean global temperatures rose at a rate of 0.08°C per decade, from 1981 by 0.18°C per decade and more when emitted aerosols are accounted for (Hansen et al., in Berwyn, 2022). According to Will Steffen, Australia’s leading climate scientist “there was already a chance we have triggered a global tipping cascade that would take us to a less habitable Hothouse Earth climate, regardless of whether we reduced emissions” (Figure 2).

Figure 2. Global mean temperature profile since 200 AD projected to beyond 2000 AD (Will Steffen)

Over a brief span of less than two centuries (Figure 1) anthropogenic reversal of the carbon cycle induced the emission of some 1.5 10¹² tonnes of CO₂ and an increased release of 150% more CH₄ from the crust, accumulated in sediments for hundreds of million years through photosynthesis and calcification, as well as from permafrost and oceans. Permeation of the atmosphere and the hydrosphere with the toxic residues of ancient plants and organisms, poisoning the biosphere, is leading to the Sixth mass extinction of species in the history of nature.

Following failed attempts to deny climate science, vested business and political interests are proceeding, with the support of many governments, to mine coal, sink oil wells and frack hydrocarbon gas, regardless of the consequences in term of global heating, sea level rise, inundation of islands and coastal zones, collapse of the permafrost, heat waves, floods, ocean acidification, migration of climate zones and dissemination of plastic particles, rendering the future of much of the biosphere uninhabitable.

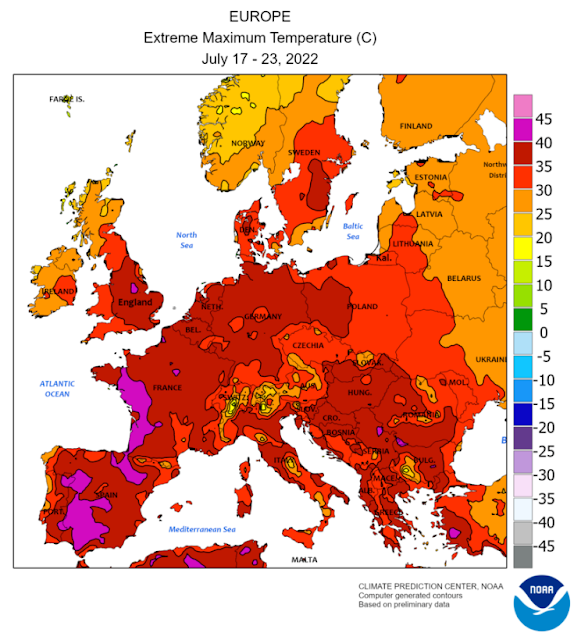
Figure 3. Europe: Maximum extreme temperatures, July 17-23, 2002.

The progression of global warming is unlikely to be linear as the flow of cold ice melt water from Greenland and Antarctica glaciers would cool parts of the ocean and in part the continents (Figure 4), leading toward a stadial-type phenomenon, the classic case of which is symbolized by the Younger dryas cool period 12,900 to 11,700 years ago.

Figure 4. Projected transient stadial cooling events (Hansen et al., 2016)

National and international legal systems appear unable to restrict the saturation of the atmosphere with greenhouse gases, as governments preside over the worst calamity in natural history since the demise of the dinosaurs. Facing heatwaves (Figure 3), fires, floods and sea level rise, those responsible may in part remain oblivious to the magnitude of the consequences, waking up when it is too late.

There was a time when leaders fell on their sword when defeated in battle or lose their core beliefs, nowadays most not even resign their privileged positions to resist the existential danger posed to advanced life, including human civilization, preoccupied as nations are with preparations for nuclear wars.

It is long past time to declare a global climate and nuclear emergency.


Andrew Glikson
A/Prof. Andrew Glikson

Earth and Paleo-climate scientist
School of Biological, Earth and Environmental Sciences
The University of New South Wales,
Kensington NSW 2052 Australia

Books:
The Asteroid Impact Connection of Planetary Evolution
https://www.springer.com/gp/book/9789400763272
The Archaean: Geological and Geochemical Windows into the Early Earth
https://www.springer.com/gp/book/9783319079073
Climate, Fire and Human Evolution: The Deep Time Dimensions of the Anthropocene
https://www.springer.com/gp/book/9783319225111
The Plutocene: Blueprints for a Post-Anthropocene Greenhouse Earth
https://www.springer.com/gp/book/9783319572369
Evolution of the Atmosphere, Fire and the Anthropocene Climate Event Horizon
https://www.springer.com/gp/book/9789400773318
From Stars to Brains: Milestones in the Planetary Evolution of Life and Intelligence
https://www.springer.com/us/book/9783030106027
Asteroids Impacts, Crustal Evolution and Related Mineral Systems with Special Reference to Australia
https://www.springer.com/us/book/9783319745442
The Event Horizon: Homo Prometheus and the Climate Catastrophe
https://www.springer.com/gp/book/9783030547332
The Fatal Species: From Warlike Primates to Planetary Mass Extinction
https://www.springer.com/gp/book/9783030754679


Wednesday, October 5, 2022

Methane keeps rising

WMO Report on Greenhouse Gases 

In 2020 and 2021, the global network of the World Meteorological Organization (WMO) detected the largest within-year increases (15 and 18 ppb, respectively) of atmospheric methane (CH₄) since systematic measurements began in the early 1980s. 

[ IPCC/WMO data through 2021 ]
The image on the right illustrates methane's rise, showing IPCC and, more recently, WMO data. Methane reached 1908 parts per billion (ppb) in 2021, 262% of the 1750 level, while carbon dioxide (CO₂) reached 415.7 parts per million (ppm) in 2021, 149% of the 1750 level, and nitrous oxide (N₂O) reached 334.5 ppb, 124% of the 1750 level. 

The WMO adds that analyses of measurements of the abundances of atmospheric CH₄ and its stable carbon isotope ratio ¹³C/¹²C (reported as δ¹³C(CH₄)) indicate that the increase in CH₄ since 2007 is associated with biogenic processes.

Methane's rise has been accelerating since 2007, which makes this a scary suggestion, as increasing decomposition of plant material as a result of climate change is a self-reinforcing feedback loop that is hard to stop.

Interestingly, a different explanation is pointed at in the 2019 analysis is shale gas a major driver of recent increase in global atmospheric methane?

Another explanation, discussed in an earlier post, is that there was a slowdown from 1984 to 2004 in the rise of methane as a result of rising temperatures increasing the water vapor in the atmosphere, resulting in more hydroxyl decomposing more methane in the atmosphere in the 1990s (compared to the 1980s). Accordingly, while the rise in methane concentration appeared to slow down over those years, methane emissions actually kept growing and continued to do so at accelerating pace, but since an increasingly large part of methane was decomposed by hydroxyl, this continuing rise in methane emissions was overlooked.

This could still mean that plant material is now getting decomposed at higher rates, but an even larger danger is that methane emissions started to increase more strongly from the early 2000s due in part to more methane eruptions from the seafloor of the Arctic Ocean. In other words, while hydroxyl kept increasing, seafloor methane emissions kept increasing even faster, to the extent that methane emissions increasingly started to overwhelm this growth in hydroxyl, resulting in a stronger rise in overall methane abundance in the atmosphere. 

Sadly, there are few measurements available for methane that could erupt from the seafloor of the Arctic Ocean. Moreover, WMO and NOAA data that are used to calculate global means are typically taken at marine surface level, which may be appropriate for carbon dioxide that is present more strongly at sea surface level, but methane is much lighter and will rise quickly and accumulate at higher altitude, as indicated by the satellite images further below. Moreover, the lack of measurements of methane over the Arctic Ocean and at higher altitudes makes it hard to determine from where the methane originated. Much methane could originate from the seafloor of the Arctic Ocean and rise to the Tropopause, while moving from there closer to the Equator, all largely without getting reported.  

What's happening in 2022?

So, what's happening in 2022? Well, it appears that the rise in methane keeps accelerating, as illustrated by the image below showing daily average methane measurements at Mauna Loa, Hawaii, since 2001.

The image below shows methane in situ measurements at Barrow, Alaska, indicating that methane is present in even higher abundance over the Arctic and that levels are rising fast over the Arctic. 


The image below, adapted from Copernicus, shows a forecast for October 27, 2022, 03 UTC at 500 hPa. High levels of methane show up over the Arctic. 


The MetOp-B satellite recorded a mean methane level of 1981 ppb at 293 mb on October 2, 2022 am, while plenty of methane was present over the Arctic Ocean at the three altitudes shown on compilation image below.
The MetOp-B satellite recorded a peak methane level of 2901 ppb at 293 mb on October 20, 2022 am, while plenty of methane was again present over the Arctic Ocean at the three altitudes shown on the compilation image below.

This supports the possibility that large amounts of methane are getting released from the Arctic Ocean, with even more to follow.

While the IPCC keeps hiding the potential for a huge rise in temperature by 2026, as discussed in an earlier post, a recently-published article points out that prudent risk management requires consideration of bad-to-worst-case scenarios. 

How bad could it be? A 2016 analysis warned that there could be a temperature rise of more than 10°C from pre-industral by 2026. An additional danger is that, as methane keeps rising, the clouds tipping point could be crossed even earlier than in 2026. Let's re-evaluate these dangers. 

The above 1981 ppb mean methane level translates into 396.2 ppm CO₂e at a 1-year GWP of 200. Destabilization of sediments at the seafloor of the Arctic Ocean could cause a large abrupt burst of methane to enter the atmosphere over the Arctic Ocean. A doubling of the mean methane level could push up the mean methane level to twice as much, to 792.4 ppm CO₂e, which is only 407.6 ppm CO₂ away from the 1200 ppm CO₂e clouds tipping point that on its own could push up the temperature by some 8°C globally. This gap of 407.6 ppm CO₂ could be more than covered by the current carbon dioxide level. The September 2022 CO₂ level at Mauna Loa was higher than that, i.e. 415.96 ppm. Since the CO₂ level at Mauna Loa in September typically is at its lowest point for the year, this implies that a large abrupt burst of methane could cause the the clouds tipping point to be instantly crossed due to methane and CO₂ alone.

Note that there are additional forcers, such as CFCs, while there are also further events and developments that could additionally speed up the temperature rise, as further discussed below. The scary situation therefore is that the clouds tipping point could be instantly crossed with a burst of methane that is far smaller in size than the methane already in the atmosphere. Such a burst of methane could be released at any time, as discussed in earlier posts such as this one

[ from earlier post ]
That's not even the worst-case scenario. In the above calculation, global mean methane levels are used. However, there is a possibility that low-lying clouds could at first break up and vanish abruptly at one specific point, due to a high methane peak, and that this could lead to break-up of neighboring clouds, propagating break-up across the globe and thus pushing up the temperature rise virtually instantly by some 8°C globally.

The MetOp satellite recorded a peak methane level of 3644 ppb and a mean level of 1944 ppb at 367 mb on November 21, 2021, pm, as discussed in an earlier post. This 3644 ppb translates into 728.8 ppm CO₂e, again at a 1-year GWP of 200. This is 471.2 ppm CO₂e away from the clouds tipping point and that 471.2 ppm CO₂e could be covered by the carbon dioxide, nitrous oxide and CFCs currently in the atmosphere.

How high could the temperature rise be by 2026? 

There are a number of scenarios that could cause the clouds tipping point to be crossed soon, e.g. if the rise in methane kept following a trend as depicted in the image below, showing WMO 2015-2021 global annual surface mean methane abundance, with a trend added.

[ click on images to enlarge ]
The trend points at a potential mean global abundance of methane of more than 700 ppm CO₂e by the end of 2026, implying that when including further forcers the clouds tipping point could be crossed in 2026. Furthermore, the trend points at 1200 ppm CO₂e getting crossed in 2028 due to the forcing of methane alone. 

Even without such an increase in methane, a huge temperature rise could eventuate by 2026, first of all due to a cataclysmic alignment of El Niño and sunspots.

We are currently in the depths of a persistent La Niña, as illustrated by the image on the right, adapted from NOAA, and this suppresses the temperature rise at the moment.

The next El Niño is already overdue, so the peak of the next El Niño may well coincide with a peak in sunspots which look set to reach a higher than expected maximum impact around July 2025. The rise in sunspots from May 2020 to July 2025 could make a difference of some 0.15°C, concluded an earlier post.

Moving from the bottom of the current La Niña to the peak of a strong El Niño could make a difference of more than half a degree Celsius, as indicated by the image below, adapted from NOAA


Therefore, the rise due to the combined impact of El Niño and sunspots could be 0.65°C by 2025. When adding this to the temperature rise that has already occurred and that, when measured from pre-industrial could be as high as 2.29°C, the total land-ocean global temperature rise could be as high as 2.94°C by 2025,  while the rise on land on the Northern Hemisphere could peak at more than 3°C above pre-industrial, noting that when there was a strong El Niño in February 2016, the land-only monthly anomaly from 1880-1920 was 2.95°C, as illustrated by the image below. 

[ from earlier post ]
Such a huge rise could cause heatwaves and droughts that could result in a huge peak in power demand, as everyone switches on their air conditioners, while at the same time rivers could either dry up or their water could become too hot to cool power plants. This could bring the grid down, which would mean that coal-fired power plants would stop emitting sulfates.

[ from Track Buckling Research ]
This could mean that equipment and appliances that need electricity such as heaters and air conditioners could stop working. Electric pumps could stop working, so there may no longer be water coming out of taps. The internet could stop working where routers require power from the grid.

Furthermore, the heat could cause asphalt and tarmac to melt and rail tracks to buckle, while airports could be closed, not only because the surface of the runway could get too hot, but also because the air could become too thin for planes to take off due to the heat.

In short, traffic, transport and industrial activities such as smelting, which are emitting a lot of sulfates as well at the moment, could grind to a halt at many places on the Northern Hemisphere. The result would be a large reduction in aerosols that are currently masking the full wrath of global warming (mainly sulfates). 

[ see the Extinction page ]
How much difference could it make? The IPCC in AR6 estimates the aerosol ERF to be −1.3 W m⁻², adding that there has been an increase in the estimated magnitude of the total aerosol ERF relative to AR5. In AR6, the IPCC estimate for liquid water path (LWP, i.e., the vertically integrated cloud water) adjustment is 0.2 W m⁻², but a recent analysis found a forcing from LWP adjustment of −0.76 W m⁻², which would mean that the IPCC estimate of −1.3 W m⁻² should be changed to -2.26 W m⁻². When using a sensitivity of ¾°C per W m⁻², this translates into an impact of -1.695°C. Since the IPCC's total for aerosols includes a net positive impact for warming aerosols such as black carbon, the impact of cooling aerosols only (without warming aerosols) will be even more negative.

This supports the 2016 analysis that warned that by 2026 there could be a 1.9°C temperature rise due to a decrease in cooling aerosols, while there could be an additional 0.6°C temperature rise due to an increase in warming aerosols and gases as a result of more biomass and waste burning and forest fires by 2026.

So, together with the upcoming El Niño and a peak in sunspots, that could result in a total rise by 2026 of 5.44°C above pre-industrial. There's more to come! Additionally, the 2016 analysis warned about further rises in temperature due to loss of Arctic sea ice and permafrost, and associated changes, as well as further rises due to gases, concluding that there could be a temperature rise by 2026 of more than 10°C compared to pre-industrial.

With a temperature rise of more than 10°C by 2026, the clouds tipping point will also be crossed, which would result in a total rise of more than 18°C by 2026. Keep in mind that humans are likely to go extinct with a rise of 3°C, as illustrated by the image below, from an analysis discussed in an earlier post.


The situation is dire and the right thing to do now is to help avoid or delay the worst from happening, through action as described in the Climate Plan.


Links

• WMO - More bad news for the planet: greenhouse gas levels hit new highs 

• WMO - Greenhouse Gas Bulletin 
https://public.wmo.int/en/greenhouse-gas-bulletin

• Ideas and perspectives: is shale gas a major driver of recent increase in global atmospheric methane? - by Robert Howarth

• NOAA - Global Monitoring Laboratory
https://gml.noaa.gov/dv/iadv

• Copernicus methane at 500 hPa, forecast for October 18, 2022, 03 UTC
https://atmosphere.copernicus.eu/charts/cams/methane-forecasts?facets=undefined&time=2022101800,3,2022101803&projection=classical_global&layer_name=composition_ch4_500hpa

• What the IPCC impacts report is hiding
https://arctic-news.blogspot.com/2022/02/what-the-ipcc-impacts-report-is-hiding.html

• Climate Endgame: Exploring catastrophic climate change scenarios - by Luke Kemp et al.
https://www.pnas.org/doi/full/10.1073/pnas.2108146119

Also discussed at:
https://www.facebook.com/groups/arcticnews/posts/10160138721434679

• The Clouds Feedback and the Clouds Tipping Point
https://arctic-news.blogspot.com/p/clouds-feedback.html

• Arctic Ocean invaded by hot, salty water

• Sunspots
https://arctic-news.blogspot.com/p/sunspots.html

• NOAA National Centers for Environmental Information, State of the Climate: Monthly Global Climate Report for September 2022, retrieved October 16, 2022
https://www.ncei.noaa.gov/access/monitoring/monthly-report/global/202209/supplemental/page-4

• NOAA Climate Prediction Center - ENSO: Recent Evolution, Current Status and Predictions 
https://www.cpc.ncep.noaa.gov/products/analysis_monitoring/lanina/enso_evolution-status-fcsts-web.pdf

• Crossing 3C
https://arctic-news.blogspot.com/2022/09/crossing-3c.html

• Pre-industrial
https://arctic-news.blogspot.com/p/pre-industrial.html

• Track Buckling Research
https://www.volpe.dot.gov/infrastructure-systems-and-technology/structures-and-dynamics/track-buckling-research

• Invisible ship tracks show large cloud sensitivity to aerosol - by Peter Manhausen et al. 

• Extinction
https://arctic-news.blogspot.com/p/extinction.html


Wednesday, January 19, 2022

The climatic effects of a nuclear winter on a warming Earth

 by Andrew Glikson

Figure 1.The Nuclear Winter” by Carl Sagan
The Cretaceous-Paleocene boundary (~66 million years-ago) asteroid impact, described in 1980 by Alvarez et al., caused enough dust and debris to cloud large parts of planet and result in the mass extinction of some 80% of all species of animals.

When Turco et al. (1983) and Carl Sagan (1983) warned the world about the climatic effects of a nuclear war, they pointed out that the amount of carbon stored in a large city was sufficient to release enough aerosols (smoke, soot and dust) to block sunlight over large regions, leading to a widespread failure of crops and thereby extensive starvation.

Current nuclear arsenals by the United States and Russia could inject 150 Teragram (Tg) (10⁹ kilogram) of soot from fires ignited by nuclear explosions into the upper troposphere and lower stratosphere (Coupe et al., 2019), lasting for a period of 10 years or longer, followed by a period of intense radioactive radiation over large areas. Even a “limited” nuclear war, such as between India and Pakistan, would release enough aerosols to affect large regions, killing millions or billions through starvation. As stated by Robock et al., 2007): “The casualties from the direct effects of blast, radioactivity, and fires resulting from the massive use of nuclear weapons by the superpowers would be so catastrophic … the ensuing nuclear winter would produce famine for billions of people far from the target zones”.

By 2021, with a global arsenal of ~13.000 nuclear warheads, 90 percent of which held by Russia and the US, regional conflicts such as in the Ukraine and Taiwan threaten to spill world-wide. As the clock of the atomic scientists is set at 100 seconds to doomsday, the rising probability of an intended or inadvertent nuclear war, in the background of rising global warming, indicate an hour of truth for the species―a choice between the defence of life on Earth and global suicide.

While the inhabitants of the planet are preoccupied with the 24 hours news cycle, media hype, superlatives, a deadly Virus, economic issues and sport games, the hair-trigger nuclear gun loaded by the powers to be, east and west, are threatening all life on Earth.

Figure 2. Robock et al. (2007)Global average surface air temperature change from the 5 Tg standard case (red) in the context of climate change over 125 years climate change (125 years NASA data). From Robock et al. (2007).

A release of 5Tg (Tera-gram) of black carbon is modelled to lower the average global temperature by about 1.5°C (Robock et al. 2007), although over the continents cooling is likely to be more abrupt. 

Figure 3. Robock et al. (2007): Time variation of global average net surface shortwave radiation, surface air temperature, and precipitation changes for the 5 Tg standard case. The global average precipitation in the control case is 3.0 mm/day, so the changes in years 2-4 represent a 9% global average reduction in precipitation. The precipitation recovers faster than the temperature, but both lag the forcing. For comparison the global average net surface shortwave forcing from a model simulation of the 1991 Mt. Pinatubo eruption (Oman et al., 2005) is shown.

Inherent in nuclear war strategy is a “use them or lose them” approach, namely hitting the enemy’s air and missile launch pads before missiles can be launched, which amounts to a virtual guarantee many or most nuclear war heads are potentially used. With the estimated size of the global nuclear warheads inventory of many tens of thousands warheads (Figure 4) this guarantees a global catastrophe.


Such an extreme event would arrest global warming for a period of about 10 years or longer (Figures 2 and 3), possibly in part analogous to the consequences of a less abrupt flow of polar ice melt into the oceans, as modelled by Bronselaer et al. (2018) (Figure 5).
Figure 5. Model 2080–2100 meltwater-induced sea-air temperature anomalies relative to the standard RCP8.5 ensemble (Bronselaer et al., 2018), indicating marked cooling of parts of the southern oceans. Hatching indicates where the anomalies are not significant at the 95% level.

When Sagan and colleagues published their observations of a nuclear winter scenario as a warning to humanity, Sagan was painted as an “alarmist” by many, facing extensive criticism not just from pro-nuclear conservatives but also from scientists who resented him for leveraging his personal fame for advocating what some regarded as political views. A similar situation occurs nowadays with regard to the accelerating global warming and the nuclear threat, as confirmed by the warning by the Bulletin of the Atomic Scientists.

From the January 20, 2022 Bulletin of the Atomic Scientists news release:
While the past year offered glimmers of hope that humankind might reverse its march toward global catastrophe, the Doomsday Clock was set at just 100 seconds to midnight. The time is based on continuing and dangerous threats posed by nuclear weapons, climate change, disruptive technologies, and COVID-19. All of these factors were exacerbated by “a corrupted information ecosphere that undermines rational decision making.” The Doomsday Clock statement explains that the “decision does not, by any means, suggest that the international security situation has stabilized. On the contrary, the Clock remains the closest it has ever been to civilization-ending apocalypse because the world remains stuck in an extremely dangerous moment.”


Time is running out.

Andrew Glikson
A/Prof. Andrew Glikson

Earth and Paleo-climate scientist
School of Biological, Earth and Environmental Sciences
The University of New South Wales,
Kensington NSW 2052 Australia

Books:
The Asteroid Impact Connection of Planetary Evolution
https://www.springer.com/gp/book/9789400763272
The Archaean: Geological and Geochemical Windows into the Early Earth
https://www.springer.com/gp/book/9783319079073
Climate, Fire and Human Evolution: The Deep Time Dimensions of the Anthropocene
https://www.springer.com/gp/book/9783319225111
The Plutocene: Blueprints for a Post-Anthropocene Greenhouse Earth
https://www.springer.com/gp/book/9783319572369
Evolution of the Atmosphere, Fire and the Anthropocene Climate Event Horizon
https://www.springer.com/gp/book/9789400773318
From Stars to Brains: Milestones in the Planetary Evolution of Life and Intelligence
https://www.springer.com/us/book/9783030106027
Asteroids Impacts, Crustal Evolution and Related Mineral Systems with Special Reference to Australia
https://www.springer.com/us/book/9783319745442
The Event Horizon: Homo Prometheus and the Climate Catastrophe
https://www.springer.com/gp/book/9783030547332
The Fatal Species: From Warlike Primates to Planetary Mass Extinction
https://www.springer.com/gp/book/9783030754679