Showing posts with label IPCC. Show all posts

Thursday, May 22, 2025

Paris Agreement thresholds crossed (update May 2025)

High temperatures persist

In the image below, created with NASA data, the decade from 1904 through 1913 is used as a custom base, illustrating that the temperature anomaly has been more than 1.5°C above this base for each of the past consecutive 22 months (July 2023 through April 2025), and even longer when compared to a pre-industrial base. The red line shows a trend (two-year Lowess Smoothing) that is pointing at 2°C above this base (1904-1913) getting crossed in the course of 2026.

[ trend points at 2°C above 1904-1913 getting crossed in 2026 ]
The temperature rise on land looks even more threatening, as illustrated by the image below. 

The above image shows land only monthly temperature anomalies from 1880-1920, with the red line (2-year Lowess Smoothing trend) showing an acceleration in April 2022. If extended, the red line points at crossing 3°C in the course of 2026. Humans are likely to go extinct with a 3°C rise, as discussed in earlier posts such as this one

An earlier analysis mentions that, when using 1750 as a base, this could add 0.3°C to the historic rise. The analysis adds that when using an even earlier base, even more could be added to the historic temperature rise.

Those who seek to delay or sabotage climate action typically call for use of a late base, in efforts to minimize the historic temperature rise. Using an earlier base can mean that temperatures are already higher than the thresholds that politicians at the adoption of the Paris Agreement pledged wouldn't be crossed, and it can also imply that the temperature rise is accelerating faster and further, due to stronger feedbacks such as more water vapor in the atmosphere and disappearance of lower clouds, all of which would constitute a stronger call for climate action.

The image below illustrates that air temperatures in the Northern Hemisphere have been very high over the past few months, at times reaching record high temperatures for the time of year, e.g. the temperature in the Northern Hemisphere was 10.08°C on May 14, 2025, the highest temperature on record for that day.

[ from earlier post, click on images to enlarge ]

These record high temperatures are the more significant as they were reached under ENSO-neutral conditions. On May 24, 2025, the sea surface temperature was 27.51°C, 0.35°C below 1991-2020, in Niño 3.4, an area in the Pacific (inset) that is critical to the development of El Niño, as illustrated by the image below. The Niño 3.4 anomaly is now lower than it has been for each day in March 2025, when La Niña conditions dominated.


The ENSO outlook below is dated May 8, 2025. It shows that ENSO-neutral conditions are likely to persist for the remainder of 2025, edging on La Niña conditions.


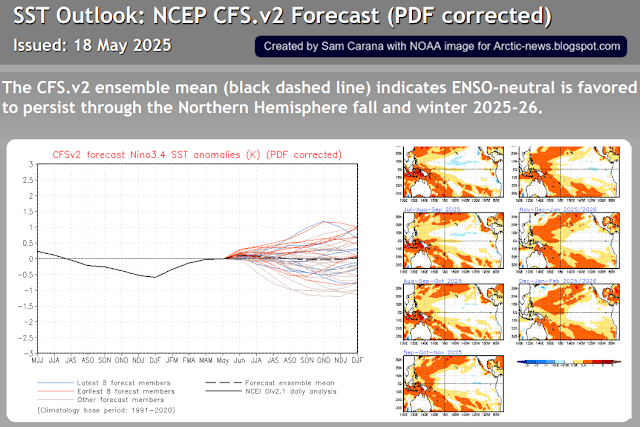
The ENSO outlook is dated May 18, 2025.


As said, to see such high temperatures under ENSO-neutral conditions is significant, it indicates that feedbacks are stronger than many models have anticipated, which implies that feedbacks will continue to grow stronger, given the rapid temperature rise over the past few years (black trend). A new El Niño may develop soon, potentially in April 2026, as the red trend in the image below warns about. The result could be a huge rise in temperature over the course of 2026 (red trend).


As said, different bases can be used, e.g. in the above images anomalies are calculated versus bases such as 1904-1913, 1880-1920, 1991-2020 and 1901-2000. None of them is pre-industrial. So, what would the temperature anomaly look like when a genuinely pre-industrial base was used? 

The image below, from an earlier post, uses NASA monthly data through March 2023. Data are first adjusted from NASA's default 1951-1980 base to an earlier 30-year base, i.e. a 1886-1915 base, and then further adjusted by 0.99°C to reflect ocean air temperatures, higher polar anomalies and a pre-industral base

The image below is an update, the same adjustments are made to data through April 2025.  


How the 0.99°C adjustment in the above images is calculated is shown in the bright yellow inset of the image below. 

[ from April 2024 post, click on images to enlarge ]
The images show that, when adjusting the data and using a genuinely pre-industrial base, the temperature rise may have already crossed both the 1.5°C and the 2°C thresholds that politicians at the 2015 Paris Agreement pledged shouldn't and wouldn't be crossed.

IPCC keeps downplaying the danger

The IPCC keeps downplaying the danger in many ways. One way the IPCC does this is by selecting a base that minimizes the temperature rise and then to keep making the claim that we're still well below the 1.5°C threshold. The above image, from an April 2024 post, shows that the February 2024 temperature was 1.76°C above 1885-1915, and potentially 2.75°C above pre-industrial (bright yellow inset right). The red line (a six-months Lowess smoothing trend) highlights the steep rise that had already taken place by then. Minimizing the temperature rise will also minimize feedbacks that come with the temperature rise, such as a rise in water vapor and loss of lower clouds, which are self-amplifying feedbacks that further accelerate the temperature rise. In other words, by minimizing the historic temperature rise, the IPCC also seeks to minimize the rise to come. 

[ from a 2014 post, click on images to enlarge ]
An additional way used by the IPCC to downplay the danger is to suggest there was a "carbon budget", as if there was an amount of carbon to be divided among polluters that could continue to be consumed for decades to come.

The image on the right, from a 2014 post, points at the fallacy and deceit that comes with a carbon budget, carbon credits, offsets and net-zero emission targets that would, according to the IPCC, accomplish and maintain a "balance" between sources and sinks.

Instead, comprehensive and effective action is needed on multiple lines of action, simultaneously yet separately.

Indeed, action is needed to reduce concentrations of carbon both in oceans and in the atmosphere, while on land, the soil carbon content needs to increase, which can best be achieved by methods such as pyrolysis of biowaste and adding the resulting biochar to the soil, to reduce emissions, reduce fire hazards, sequester carbon, support the presence of moisture & nutrients in the soil and thus support the health & growth of vegetation, as discussed at the Climate Plan group and the biochar group.

The IPCC has failed on at least three points:
1. failed to warn about the historic temperature rise and associated larger feedbacks 
2. failed to warn about mechanisms that could cause further acceleration of temperature rise soon  
3. failed to point at the best ways to combat climate change.

Higher temperatures come with feedbacks, as illustrated by the image below, from an earlier post.

[ the temperature in the atmosphere can keep rising, even in the absence of further emissions ]
The above image illustrates how feedbacks and crossing of tipping points can cause the temperature of the atmosphere to keep rising, even in the absence of further emissions, due to shrinking heat sinks (e.g. sea ice thickness loss and oceans taking up less heat).

The IPCC failed to warn about Antarctic sea ice decline, and - importantly - the amplifying impact of Antarctic sea ice decline on the global temperature rise. This was addressed in an earlier post as follows:
Sea ice loss results in less sunlight getting reflected back into space and instead getting absorbed by the ocean and the impact of Antarctic sea ice loss is even stronger than Arctic sea ice loss, as Antarctic sea ice is located closer to the Equator, as pointed out by Paul Beckwith in a video in an earlier post. A warmer Southern Ocean also comes with fewer bright clouds, further reducing albedo, as discussed here and here. For decades, there still were many lower clouds over the Southern Ocean, reflecting much sunlight back into space, but these lower clouds have been decreasing over time, further speeding up the amount of sunlight getting absorbed by the water of the Southern Ocean, and this 'pattern effect' could make a huge difference globally, as this study points out. Emissivity is a further factor; open oceans are less efficient than sea ice when it comes to emitting in the far-infrared region of the spectrum (feedback #23 on the feedbacks page).

2024 study led by Norman Loeb finds that large decreases in stratocumulus and middle clouds over the sub-tropics and decreases in low and middle clouds at mid-latitudes are the primary reasons for increasing absorbed solar radiation trends in the northern hemisphere.

Slowing down of the Atlantic meridional overturning circulation (AMOC) can cause more heat to accumulate at the ocean surface. Higher sea surface temperatures also come with greater stratification (image below, from earlier post).

Stratification and further changes in oceans and in wind patterns can cause a freshwater lid to form on top of the ocean surface, enabling more hot & salty water to flow underneath this lid (feedback #28), contributing to calving of glaciers and destabilization of sediments at the seafloor.


Increases in water vapor in the atmosphere, loss of sea ice and loss of lower clouds are three self-amplifying feedbacks, i.e. as temperatures rise, such feedbacks will push temperature up even further and due to their self-amplification, the temperature rise will accelerate.

Sea ice loss

One feedback of high temperatures and high concentrations of greenhouse gases is loss of sea ice. Polar amplification of the temperature rise is hitting the Arctic hard, and is also causing dramatic loss of Antarctic sea ice. Global sea ice area has been very low for the past few years, as illustrated by the image below. This has caused a lot of sunlight that was previously reflected back into space, to instead get absorbed by the sea surface. On May 24, 2025, global sea ice area was 17.75 million km², lowest on record for the day.


The image below, adapted from the Danish Metereological Institute, shows that Arctic sea ice volume on May 29, 2025, was at a record low for the time of year, as it has been for more than a year.


Sea ice is disappearing over large parts of the Arctic Ocean. The image below, adapted from the University of Bremen, shows sea ice concentration on May 29, 2025.


The screenshot below, from an earlier post, further illustrates the dangers that come with sea ice loss. Eruptions of methane from the seafloor of the Arctic Ocean is one of the most terrifying dangers. 

As the image below illustrates, some of the thickest sea ice disappears from the Arctic Ocean as it gets broken up by sea currents and the pieces get moved out along the edges of Greenland. The image shows how, on May 27, 2025, the sea ice gets broken up just north of Greenland, due to ocean currents that will also move the pieces to the south, alongside the edges of Greenland, toward the North Atlantic.

[ click on images to enlarge ]

Climate Emergency Declaration


The situation is dire and the precautionary principle calls for rapid, comprehensive and effective action to reduce the damage and to improve the situation, as described in this 2022 post, where needed in combination with a Climate Emergency Declaration, as discussed at this group.


Links

• NASA - datasets and images
https://data.giss.nasa.gov

• When Will We Die?
https://arctic-news.blogspot.com/2019/06/when-will-we-die.html

• Copernicus - Climate Pulse
https://pulse.climate.copernicus.eu

• Climate Reanalyzer
https://climatereanalyzer.org

• NOAA - Climate Prediction Center - ENSO: Recent Evolution, Current Status and Predictions
https://www.cpc.ncep.noaa.gov/products/analysis_monitoring/lanina/enso_evolution-status-fcsts-web.pdf

• NOAA - Climate Prediction Center - El Niño/Southern Oscillation (ENSO) Diagnostic Discussion

• Pre-industrial
https://arctic-news.blogspot.com/p/pre-industrial.html

• Feedbacks
https://arctic-news.blogspot.com/p/feedbacks.html

• NOAA - Office of Satellite And Product Operations - Sea Surface Temperatures
https://www.ospo.noaa.gov/products/ocean/sst/contour/index.html

• Nullschool.net
https://earth.nullschool.net

• Jet Stream
https://arctic-news.blogspot.com/p/jet-stream.html

• Cold freshwater lid on North Atlantic
https://arctic-news.blogspot.com/p/cold-freshwater-lid-on-north-atlantic.html

• Danish Meteorological Institute - Arctic sea ice volume and thickness
https://ocean.dmi.dk/arctic/icethickness/thk.uk.php

• University of Bremen
https://seaice.uni-bremen.de/start

• NASA - Worldview satellite images
https://worldview.earthdata.nasa.gov

• Transforming Society
https://arctic-news.blogspot.com/2022/10/transforming-society.html

• Climate Plan
https://arctic-news.blogspot.com/p/climateplan.html

• Climate Emergency Declaration
https://arctic-news.blogspot.com/p/climate-emergency-declaration.html




Friday, May 3, 2024

Is CMIP6 SSP585 the worst-case scenario?

The image below, adapted from Climate Reanalyzer, shows the temperature in the year 2100, in a CMIP6 SSP585 scenario. The image shows how much the temperature will have risen in 2100, at 2 meters above the surface and compared to the period 1979-2000. 


The image below shows a progressive temperature rise reaching 4.589°C in 2100 compared to the same period, i.e. 1979-2000 and in a CMIP6 SSP585 scenario.


The 1979-2000 period is relatively recent. The temperature has been rising for longer than that. The image below shows a progressive temperature rise reaching 4.91°C by 2100 in a CMIP6 SSP585 scenario when instead using a 1901-2000 period as a base.

The 1901-2000 period is also relatively recent, much later than pre-industrial. When using a pre-industrial base, the temperature rise will be well over 5°C.

As illustrated by the top image, the temperature rise over land will be much higher than over oceans, which makes the situation even more dire, given that most people live on land and could face a rise of  8°C by 2100 in a CMIP6 SSP585 scenario.

In a CMIP6 SSP585 scenario, temperatures are projected to keep rising strongly beyond 2100, as illustrated by the image below, from a 2016 paper by Brian O'Neill et al.


In the study by Brian O'Neill et al., CO₂ emissions keep rising until 2100, to then fall gradually to current levels, while the CO₂ concentration in the atmosphere keep rising, to remain at levels beyond 2000 ppm and result in a temperature rise of 8°C by 2300 in a CMIP6 SSP585 scenario.

Is CMIP6 SSP585 the worst-case scenario?

To check whether CMIP6 SSP585 is indeed the worst-case scenario, one can look at how fast CO₂ is rising. According to the IEA, global energy-related CO₂ emissions grew in 2023, reaching a new record high of 37.4 Gt (or 10.098 GtC). The image below, from a recent post, confirms the recent acceleration in CO₂ concentrations, while showing the potential for CO₂ concentration to cross 1200 ppm before the year 2060.


In other words, CO₂ may well be rising even faster than anticipated in a CMIP6 SSP585 scenario, while this scenario doesn't take into account the potential for CO₂e concentrations to cross 1200 ppm much earlier than 2100 (inset), e.g. before 2060 as illustrated by the red trend in the main image. Furthermore, CMIP6 SSP585 doesn't take into account that, in addition to the temperature rise resulting from high greenhouse gas concentrations, crossing the clouds tipping point at 1200 ppm in itself would push up temperatures by a further 8°C.

Indeed, the clouds tipping point could be crossed even earlier when also taking into account methane, nitrous oxide and further greenhouse gases, while there are additional developments such as organic carbon and inorganic carbon release from soils that could further raise both CO₂ concentrations and temperatures. The Extinction page and posts such as this one and this one warn about the potential for a temperature rise of well over 18°C unfolding as early as 2026. 
In conclusion, the temperature looks set to be rising higher and faster at accelerating rate, dwarfing anything seen in previous extinction events, as illustrated by the image below, from an earlier post.


"Now I am become Death, the destroyer of worlds."


The above image is a screenshot from the video (further above) in which physicist J. Robert Oppenheimer reflects on the first test of the atomic bomb. His haunting words mark the moment when science met conscience.

Similarly, climate change is a destroyer of worlds with unfathomable consequences, yet politicians refuse to heed the warnings, in an unprecedented breach of moral values, neglect of the precautionary principle, betrayal of trust and violation of the duty of care.

As a result, the IPCC persists with downplaying the potential for dangerous developments in efforts to hide the need for the most effective climate action. The IPCC keeps pointing at less effective policies such as support for BECCS and biofuel, while continuing to make it look as if there was a carbon budget to divide among polluters, as if polluters could continue to pollute for decades to come, as discussed in earlier posts such as this one.

Meanwhile, a 2018 study (by Strona & Bradshaw) indicates that most life on Earth will disappear with a 5°C rise. Humans, who depend for their survival on many other species, will likely go extinct with a 3°C rise, as illustrated by the image below, from an earlier post.


Climate Emergency Declaration

The situation is dire and the precautionary principle calls for rapid, comprehensive and effective action to reduce the damage and to improve the situation, as described in this 2022 post, where needed in combination with a Climate Emergency Declaration, as discussed at this group.


Links

• Climate Reanalyzer
https://climatereanalyzer.org

• The Scenario Model Intercomparison Project (ScenarioMIP) for CMIP6 - by Brian O'Neill et al. (2016)

• International Energy Agency (IEA) - CO2 Emissions in 2023 report
https://www.iea.org/reports/co2-emissions-in-2023

• September 2023, highest anomaly on record?
https://arctic-news.blogspot.com/2023/09/september-2023-highest-anomaly-on-record.html

• CO2 keeps accelerating
https://arctic-news.blogspot.com/2024/04/co2-keeps-accelerating.html

• Feedbacks in the Arctic
https://arctic-news.blogspot.com/p/feedbacks.html

• Pre-industrial
https://arctic-news.blogspot.com/p/pre-industrial.html

• Clouds Feedback and the Clouds Tipping Point
https://arctic-news.blogspot.com/p/clouds-feedback.html

• The Threat
https://arctic-news.blogspot.com/p/threat.html

• Amplifying feedback loop between drought, soil desiccation cracking, and greenhouse gas emissions - by Farshid Vahedifard et al. 


Tuesday, April 4, 2023

IPCC keeps downplaying the danger even as reality strikes

Record hot sea surface


The daily sea surface temperature (SST) between 60°South and 60°North was at a record high on April 2, 2023, i.e. the highest temperature in the NOAA record that started in 1981, as illustrated by the above image. The black line shows this year's SST, up to April 2, 2023. The orange line shows last year's SST, i.e. 2022. The thicker grey line shows SST in the year 2020, when annual temperatures on land and ocean reached a record high, since 2020 was an El Niño year. 

This record high sea surface temperature comes as we're moving into a new El Niño, as illustrated by the image on the right, adapted from NOAA.

There are further reasons why this uptick doesn't come unexpected. The emerging El Niño looks set to coincide with high sunspots, while the 2022 Tonga submarine volcano eruption did add a huge amount of water vapor to the atmosphere, as discussed in an earlier post

Greenhouse gas concentrations keep rising

Reducing emissions is the right thing to do, even though it comes with loss of the aerosol masking effect that causes a rise in temperatures, as discussed in an earlier post. Moreover, greenhouse gas levels aren't falling.

Global monthly nitrous oxide rose to 336.33 ppb in December 2022, as illustrated by the image on the right. A recent study found that atmospheric abundances and emissions of five CFCs (CFC-13, CFC-112a, CFC-113a, CFC-114a and CFC-115) increased between 2010 and 2020.

Carbon dioxide (CO₂) broke three records recently at Mauna Loa, Hawaii, as illustrated by the image on the right. 

The daily mean (green points) rose to 423.23 ppm (parts per million) on April 12, 2023, a record high in the NOAA record for in situ measurements. The weekly mean CO₂ (red lines) was 422.54 ppm in the week that started April 2, 2023, and the monthly mean CO₂ (blue lines) was 421.00 ppm in March 2023.

Furthermore, CO₂ was as high as about 424.5 ppm in a flask measurement at Mauna Loa, Hawaii recently, as illustrated by the image on the right.

Monthly methane recently rose to above 1950 ppb at Mauna Loa, Hawaii, as illustrated by the image on the right underneath.

Globally, methane rose to 1924.99 ppb in December 2022, the highest in the NOAA globally averaged marine surface monthly mean methane record that goes back to July 1983.

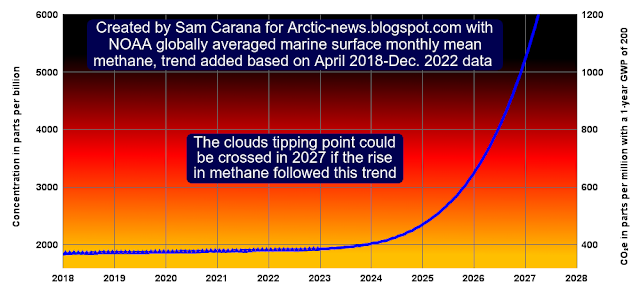
The image below has a polynomial trend added based on April 2018 to December 2022 NOAA global methane data and pointing at 1200 ppm CO₂e (carbon dioxide equivalent) getting crossed in 2027.

The Clouds Tipping Point, at 1200 ppm CO₂e, could be crossed and this on its own could result in a further rise of 8°C. This tipping point could be crossed as early as in 2027 due to forcing caused by the rise in methane alone. When further forcing is taken into account, this could happen even earlier than in 2027.


NOAA's 1924.99 ppb for the December 2022 global methane mean translates into 385 ppm CO₂e when using a 1-year GWP of 200 for methane.

So, adding this 385 ppm CO₂e to 424.5 ppm CO₂ would leave just 390.5 ppm CO₂e for further forcing, before the Clouds Tipping Point would get crossed, as the image on the right illustrates.

Methane at higher altitude can reach even higher levels than NOAA's global marine surface data. As the image further above shows, monthly methane recently rose to above 1950 ppb at Mauna Loa, Hawaii.

Further changes such as caused by sea ice loss and changes in aerosols can also speed up the temperature rise.

[ see the Extinction page ]
Vast amounts of ocean heat are headed to invade the Arctic. Last year, North Atlantic sea surface temperatures reached a record high of 24.9°C in early September. The continuing rise of ocean heat threatens to trigger massive loss of sea ice and eruptions of methane from the seafloor of the Arctic Ocean, as has been described many times before, such as in this post and in this post. 

All this is pushing up temperatures and will likely keep pushing up temperatures even further over the next few years. To say that the situation is dangerous is a vast understatement.

Politicians keep downplaying the danger

Meanwhile, the Intergovernmental Panel on Climate Change (IPCC) is reading the Synthesis Report of its 6th Assessment Report line by line, asking for approval from politicians who seek to downplay such dangers. "There are multiple, feasible and effective options to reduce greenhouse gas emissions and adapt to human-caused climate change, and they are available now" says the IPCC in an earlier news release with the title Urgent climate action can secure a liveable future for all.

The IPCC was created in 1988 by politicians and set up under the UNEP and WMO to provide politicians with the best-available scientific analysis on climate change. Yet, emissions have kept rising ever since, even accelerating, and the situation has continued to become ever more dire. 

Let's face it, the IPCC is an instrument used by politicians to keep downplaying the danger, even as reality strikes it in the face as to how dire the situation is. Politicians control the IPCC and politicians have proven to be prone to make deals in which they sell out climate action. Politicians have forfeited their chance to influence the process.

Climate action flowchart

In conclusion, politicians should be kept as much as possible out of the climate picture. We, the people, should support communities seeking effective climate action. Below is a flowchart showing how climate action can be achieved without politicians.

[ click on images to enlarge ]


Links

• Climate Reanalyzer - Daily sea surface temperatures
https://climatereanalyzer.org/clim/sst_daily

• NOAA - Climate Prediction Center - ENSO: Recent Evolution, Current Status and Predictions
https://www.cpc.ncep.noaa.gov/products/analysis_monitoring/lanina/enso_evolution-status-fcsts-web.pdf

• Sea surface temperature at record high

• Global increase of ozone-depleting chlorofluorocarbons from 2010 to 2020 - by Luke Western et al. 

• NOAA - greenhouse gases at Mauna Loa, Hawaii 

• NOAA - Recent Daily Average Mauna Loa CO2
https://gml.noaa.gov/ccgg/trends/monthly.html

• NOAA - global methane 

Saturday, November 12, 2022

There is no Carbon Budget

[ Sam Carana: "There is no carbon budget!" ]

In the above image, the atmosphere is presented as a "bucket" filling with greenhouse gas pollution from fossil fuel use from 1870 to 2020. The image depicts the idea that there is some carbon budget left, before 1.5°C above pre-industrial will be reached. The Global Carbon Project has just issued an update of what it refers to as the Global Carbon Budget

[ adapted from Global Carbon Budget 2022 ]
The Global Carbon Project insists that there still is some carbon budget left, even as global fossil fuel C₂O emissions in 2021 were higher than 2020, and are projected to be higher again in 2022 than 2021, as illustrated by the image on the right.

Arctic-news has long said that the suggestion of a carbon budget is part of a narrative that polluters seek to spread, i.e. that there was some budget left to be divided among polluters, as if polluters could safely continue to pollute for years to come before thresholds would be reached that could make life uncomfortable, such as a rise of 1.5°C above pre-industrial. 

For starters, an earlier analysis warns that the 1.5°C threshold may have been crossed long ago. The situation looks set to soon become even more catastrophic. The upcoming El Niño could make a difference of more than 0.5°C over the next few years. Additionally, there will be a growing impact of sunspots, forecast to peak in July 2025. 

Arctic-news has long warned about rising temperatures, not only due to high greenhouse gas levels, but also due to a number of events and developments including a rise of up to 1.6°C due to loss of Arctic sea ice and permafrost, and associated changes, a rise of up to 1.9°C due to a decrease in cooling aerosols, and a rise of up to 0.6°C due to an increase in warming aerosols and gases as a result of more biomass and waste burning and forest fires.

More recent posts also warn that the rise could cause the clouds tipping point at 1200 ppm CO₂e to be crossed. Accordingly, the total temperature rise could be as high as 18.44°C from pre-industrial by 2026. Keep in mind that humans are likely to go extinct with a rise of 3°C, as discussed in an earlier post.

[ image from quotes, text from 2013 post ]
So, there is no carbon budget left. There is just a huge amount of carbon to be removed from the atmosphere and oceans, a "debt" that polluters would rather be forgotten or passed on to future generations.

This "debt" has been growing since well before the industrial revolution started. Long ago, people should have started to reduce emissions and remove greenhouse gases, as well as take further action to improve the situation, and Arctic-news has long said that comprehensive and effective action must be taken without delay.

The IPCC has betrayed the very scientific basis it was supposed to reflect

The IPCC keeps insisting that there was a carbon budget, and this goes hand in hand with peddling the notion that the temperature rise was still less than 1.5°C. As discussed in an earlier analysis, the temperature has been rising for thousands of years and may have crossed the 1.5°C mark long ago.

Furthermore, the Paris Agreement instructs the IPCC to specify pathways to limit the rise to 1.5°C. In its arrogance, the IPCC on the one hand keeps insisting that 1.5°C has not been crossed, while on the other hand bluntly refusing to specify credible pathways to keep it that way. The untenability of this attitude is illustrated by a recent UN news release Climate change: No 'credible pathway' to 1.5C limit, UNEP warns.

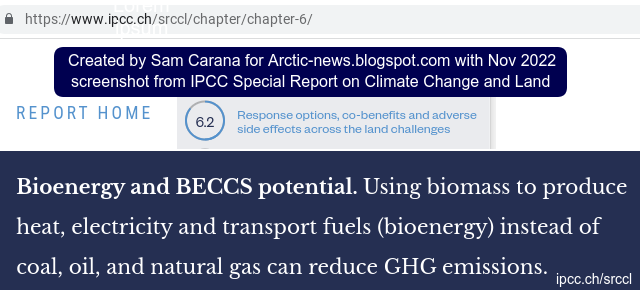
Many studies point at ways improvements could be facilitated, such as by support for solar panels, wind turbines, heat pumps, biochar, vegan-organic food, air taxis, etc. This analysis and this earlier post agree and also conclude that local feebates work best and that it is preferable for decision-making regarding their implementation to be delegated to local communities. The IPCC on the one hand refuses to contemplate policy instruments, yet on the other hand it keeps peddling pet projects pushed by polluters, such as cap-and-trade, nuclear power, CCS, bioenergy and BECCS (bioenergy with carbon capture and storage), as illustrated by the image below. 

[ IPCC keeps peddling pet projects pushed by polluters ]

The IPCC keeps downplaying the potential for a huge temperature rise

The IPCC keeps downplaying developments that could lead to a huge temperature rise. Such developments include:

• Rising greenhouse levels due to more emissions by people and collapse of the biosphere, and due to more emissions from forest, peatlands and waste fires;

• Collapse of the cryosphere, including decline of permafrost, glaciers and sea ice loss and latent heat buffer loss resulting in more clouds over the Arctic, more ocean heat moving into the Arctic Ocean and associated seafloor methane releases;

• Loss of cloud reflectivity and the potential for CO₂e levels to cross the clouds tipping point;

• Loss of the aerosol masking effect;

• More water vapor in the atmosphere in line with rising temperatures and as a result from loss of sea ice.

Altogether, these developments have the potential to raise the temperature by 18.44°C from pre-industrial, as discussed at the extinction page

One of the most harmful ways in which the IPCC has been downplaying the potential for temperatures to rise is by using a too low Global Warming Potential (GWP) for methane. 

This is illustrated by the image on the right, from an earlier post. In the IPCC special report Climate Change and Land a GWP for methane is used of 28 over 100 years to assess the impact of AFOLU (agriculture, forestry, and other land use) versus the impact of fossil fuel, etc. The image illustrates the difference in impact when a GWP for methane of 171 over a few years is used instead.

The IPCC seeks to justify its use of a GWP of 28 by focusing on a pulse of methane over 100 years. The impact of such a pulse declines over the years, since the lifetime of methane is only 11.8 years. However, using a pulse to calculate the impact of the total methane in the atmosphere isn't appropriate, because methane doesn't just disappear, but is constantly replenished, or rather is more than replenished, as illustrated by the image further below. Because of this and because of the potentially huge temperature rise within a few years, it makes more sense to calculate the impact of methane over a short period. Over one year, methane's GWP is 200, as discussed at this page. A GWP of 200 is used in the image below (right axis). 

[ from earlier post ]
Very threatening is a rise in methane that kept following the trend depicted in the above image, created with WMO 2015-2021 global annual surface mean methane abundances, with an added trend that points at a potential mean global abundance of methane of more than 700 ppm (parts per million) CO₂e by the end of 2026. The image warns that, if such a trend kept continuing, the clouds tipping point could be crossed as a result of the forcing of methane alone.
The above NOAA image shows a methane monthly average for November 2022 of more than 1950 parts per billion (ppb) at Mauna Loa, Hawaii.  

Conclusions

The situation is dire and the right thing to do now is to help avoid or delay the worst from happening, through action as described in the Climate Plan and at the recent post Transforming Society.

Links

• Global Carbon Project - Global Carbon Budget 2022 
https://www.globalcarbonproject.org/carbonbudget/index.htm

• The upcoming El Nino and further events and developments (2022) 
https://arctic-news.blogspot.com/2022/11/the-upcoming-el-nino-and-further-events-and-developments.html

• Arctic Methane Monster (2013)
https://arctic-news.blogspot.com/2013/09/arctic-methane-monster.html

• The Clouds Feedback and the Clouds Tipping Point
https://arctic-news.blogspot.com/p/clouds-feedback.html

• Methane levels threaten to skyrocket (2014) 
https://arctic-news.blogspot.com/2014/09/methane-levels-threaten-to-skyrocket.html

• Pre-industrial
https://arctic-news.blogspot.com/p/pre-industrial.html

• Sunspots
https://arctic-news.blogspot.com/p/sunspots.html

• Extinction
https://arctic-news.blogspot.com/p/extinction.html

• NOAA - Global Monitoring Laboratory
https://gml.noaa.gov/dv/iadv

• Methane Keeps rising
https://arctic-news.blogspot.com/2022/10/methane-keeps-rising.html

• When will we die? 
https://arctic-news.blogspot.com/2019/06/when-will-we-die.html

• IPCC - Special Report on Climate Change and Land
https://www.ipcc.ch/srccl

• Climate change: No ‘credible pathway’ to 1.5C limit, UNEP warns 
https://news.un.org/en/story/2022/10/1129912

• Human Extinction by 2025? 
https://arctic-news.blogspot.com/2022/07/human-extinction-by-2025.html

• Climate Plan
https://arctic-news.blogspot.com/p/climateplan.html

• Transforming Society (2022)
https://arctic-news.blogspot.com/2022/10/transforming-society.html