NOAA figures show that 2013 CO2 level growth was the highest ever recorded, i.e. 2.95 ppm.
The EPA expects U.S. 2013 energy-related CO2 emissions to be 2% higher than in 2012.
The UC San Diego image below shows CO2 levels in the atmosphere over the past two years.
The post featured a graph with a 4th-order polynomial trendline pointing at some 7.5 ppm CO2 annual growth by 2040. While many welcomed the warning contained in the graph, some argued against using higher-order polynomial trendlines. So, for those who don't feel comfortable with a 4th-order polynomial trendline, the graph below adds both a linear trendline and a 3rd-order polynomial trendline.
The 3rd-order polynomial trendline, based on the recent data, points at CO2 annual growth of some 7 ppm by 2040, justifying the warning sounded by the 2013 graph.
And what do the recent data say, when a 4th-order polynomial trendline is applied? As the image below shows, they show an even steeper rise, reaching 7 ppm growth per year as early as 2030.
As many posts at this blog have warned, rapid growth in greenhouse gases and numerous feedbacks are threatening to push Earth into runaway global warming.
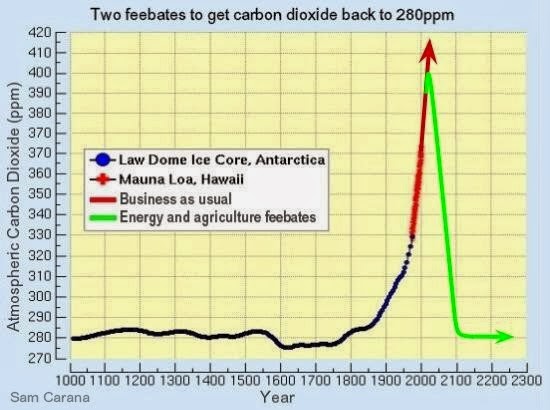
This calls for comprehensive and effective action to - among other things - reduce atmospheric CO2 levels back to 280 ppm, as illustrated by the above image and as also discussed at the Climate Plan blog, at the Policies page, and at the Climate Plan group.


