Showing posts with label global. Show all posts

Monday, February 5, 2024

Too late?

Climate change denial and the rise of fascism

by Andrew Glikson

but they can be sure that they won't be recorded for their crimes in history -- because
there 
won't be any history” (Noam Chomsky, 2023, in a letter to the author)


Extreme planetary heating, the failure of effective mitigation and the rise of denial around the world combine to lead to a seventh mass extinction of species. While originally Global warming constituted an unintended consequence of the 18-20ᵗʰ centuries industrial revolution, the collapse of attempts to arrest it in the 20-21st centuries is already leading toward a mass extinction, but the rise of fascist movements and their neoconservative kins is jeopardizing a unified global approach to the climate crisis. Inherently however racist ideology, worship of power, glorification of war, the pride of killing and “honourable” death is not concerned with the fatal consequences of climate change.

Figure 1. 2023 was the warmest year since global records began in 1850 by a wide margin. It was 1.18°C
above the 20th-century average of 13.9°C. It was 1.35°C above the pre-industrial average (1850-1900).

While the authorities (so-called) claim they are trying to arrest global warming, temperatures continue to rise to fatal levels (Figure 1). Ignoring climate science, dismissing climate scientists and confecting lies while global heating accelerates with deleterious consequences, the species sapiens is finding itself on track to carbon saturation to Miocene levels (420< ppm) of its atmosphere ─ the lungs of the Earth ─ at a geologically unprecedented rate. The extreme rise in the chemistry of the atmosphere, the acidification of the oceans and the coating of the land with carbon residues and plastics are leading toward an uninhabitable Earth.

With exceptions governments pretend the introduction of alternative energy ─ solar, wind, hydrothermal, hydro and tide ─ is likely to reduce the mining of and emission from fossil fuels, but this has hardly occurred since 2022. Oblivious to the implications of climate science, the concerns of the powers that be hinge on the bottom line, an attitude echoed by much in the population. False claims abound in high places, as exemplified by the chair of COP-28 conference claiming: “there is ‘no science’ behind demands for phase-out of fossil fuels”.

Everywhere, including Australia, carbon counting hinges on domestic mining and emissions to the exclusion of carbon exports. Thus “Oil, gas, and coal exports are not counted when countries tally their greenhouse gas emissions under the Paris Agreement.”

Hopeful popular belief abound, as if new science-based discoveries could resolve climate change, as by the optimistic projection by NASA: “While we cannot stop global warming overnight, we can slow the rate and limit the amount of global warming by reducing human emissions of heat-trapping gases and soot. Such suggestions overlook the amplifying feedback from warming oceans, melting ice sheets. disintegrating permafrost, release of methane from the oceans, and migrating climate zones. Scientists are caught between a need to promote mitigation and adaptation on the one hand and a reluctance to communicate the impending calamity.

Australia’s enshrined emissions cut target of 43% by 2030, up from 26-28%, has limited consequences since it has become the fifth largest miner and the world’s third biggest exporter of fossil fuels, exporting only behind Russia and Saudi Arabia, more than Iraq, Venezuela and any country in the EU.

The blood-stained history of Homo sapiens since the mastery of fire (Figure 2), all the way to the Anthropocene crisis, combined with the proliferation of doomsday weapons, do not bode well for the future of terrestrial species.

Global empires east and west have become increasingly brutal. Fascism ─ the ideology of death ─ and its neo-conservative (so-called) followers are not concerned with global warming and its consequences, except where it hurts the profit motive. References to “climate change” by politicians constitute hollow words they hardly mean. There are not too many angels left except where the young like Greta Thunberg rebel.

Figure 2. The deep time origin of the Anthropocene.

A/Prof. Andrew Y Glikson
Earth and Paleo-climate scientist

Andrew Glikson
Books:
The Asteroid Impact Connection of Planetary Evolution
https://www.springer.com/gp/book/9789400763272
The Archaean: Geological and Geochemical Windows into the Early Earth
https://www.springer.com/gp/book/9783319079073
The Plutocene: Blueprints for a Post-Anthropocene Greenhouse Earth
https://www.springer.com/gp/book/9783319572369
The Event Horizon: Homo Prometheus and the Climate Catastrophe
https://www.springer.com/gp/book/9783030547332
Climate, Fire and Human Evolution: The Deep Time Dimensions of the Anthropocene
https://www.springer.com/gp/book/9783319225111
Evolution of the Atmosphere, Fire and the Anthropocene Climate Event Horizon
https://www.springer.com/gp/book/9789400773318
From Stars to Brains: Milestones in the Planetary Evolution of Life and Intelligence
https://www.springer.com/us/book/9783030106027
Asteroids Impacts, Crustal Evolution and Related Mineral Systems with Special Reference to Australia
https://www.springer.com/us/book/9783319745442
The Fatal Species: From Warlike Primates to Planetary Mass Extinction
https://www.springer.com/gp/book/9783030754679
The Trials of Gaia. Milestones in the evolution of Earth with reference to the Antropocene
https://www.amazon.com.au/Trials-Gaia-Milestones-Evolution-Anthropocene/dp/3031237080


Saturday, November 13, 2021

Human Extinction by 2022?

The NASA image below shows the October 2021 temperature anomaly. The Arctic is heating up enormously, with anomalies showing up of up to 9.1°C. 


The image below shows that the global temperature over the past century, i.e. from 1920 to 2020, has risen by 1.3°C. The image shows anomalies from 1900-1920. When adjusting data to reflect a pre-industrial base, ocean air (2m) temperatures and higher polar anomalies, temperatures may have crossed 2°C long ago.

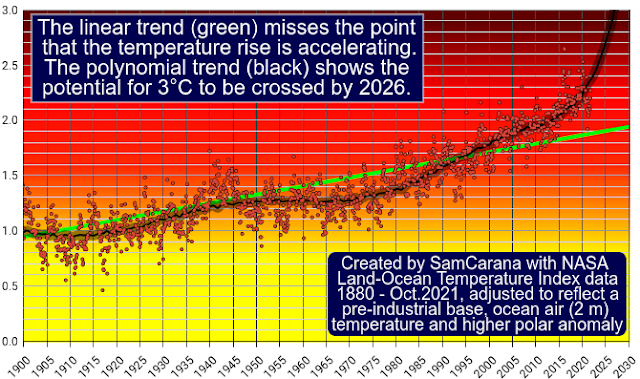
The image below shows two trends, based on NASA 1880-October 2021 data, adjusted to reflect a pre-industrial base, ocean air (2m) temperatures and higher polar anomalies. The linear trend (green) misses the point that the temperature rise is accelerating. The polynomial trend (black) shows the potential for 3°C to be crossed by 2026.


Acceleration of the temperature rise may speed up further soon, for a number of reasons:

Aerosols: As cleaner alternatives become more economic, and as calls for cleaner air become stronger, this could result in a strong temperature rise soon, as sulfate cooling falls away and more black carbon may result from more wood burning and forest fires, as discussed at the aerosols page.

Sunspots: Within a few years time, sunspots will be reaching the peak of their cycle, and they are looking stronger than forecast, as illustrated by the image on the right showing sunspots up to October 2021.

ENSO: An upcoming El Niño could raise surface temperatures significantly. The image on the right shows that the current La Niña is forecast to end in 2022 and move toward a new El Niño. As the temperature keeps rising, ever more frequent strong El Niño events are likely to occur, as confirmed by a recent study. Authors also confirm concerns that the IPCC downplays the threat that a super El Nino event could occur soon.

The image below indicates that the difference between the top of El Niño and the bottom of La Niña could be more than half a degree Celsius.


As illustrated by the bar on the right, there are many further elements that could dramatically push up the temperature soon. Altogether, there could be a rise from pre-industrial of more than 18°C by end 2026, as discussed in earlier posts such as this one.

As the image at the top shows, the Arctic is heating up enormously, with anomalies showing up of up to 9.1°C.

Decline of Arctic snow and ice can result in huge albedo losses, loss of latent heat buffer, jet stream changes, more and more extreme weather events, and more. Slowing down of the Atlantic meridional overturning circulation (AMOC) and increasing ocean stratification can result in less heat getting transferred from the atmosphere to the depths of the ocean, as also described at this page.

One of the largest threats is seafloor methane and despite repeated warning from some of the best experts in the field, the IPCC simply waves away this threat. This and other elements in the bar have been discussed in detail in many earlier posts such as this one and on the extinction page.

The image below shows three trends, i.e. the same black polynomial and green linear trends, based on NASA 1880-October 2021 data, and a blue polynomial trend based on 2015-October 2021 data. Data are again adjusted to reflect a pre-industrial base, ocean air (2m) temperatures and higher polar anomalies.

The blue polynomial trend better reflects short-term climate forcing such as aerosols, sunspots and an upcoming El Niño, as discussed above. The blue trend also shows the potential for 3°C to be crossed by the end of 2022.


The current situation is extremely dangerous

Huge amounts of heat are entering the Arctic Ocean, driven by ocean currents and temperature differences. Sea ice acts as a buffer, by consuming energy in the process of melting, thus avoiding that this energy can raise the temperature of the water of the Arctic Ocean. Furthermore, huge amounts of heat get transferred to the atmosphere over the Arctic Ocean, as long as sea ice is low in extent.


The latent heat buffer has now virtually disappeared, while lower air temperatures are causing the sea ice to grow in extent, effectively sealing off the Arctic Ocean and reducing heat transfer from the Arctic Ocean to the atmosphere, as illustrated on the right by the 30-day navy.mil animation (up to November 12, the last 8 days are forecasts). 

Heat that was previously melting the ice or that was getting transferred to the atmosphere is now instead heating up the water. Some 75% of ESAS (East Siberian Arctic Shelf) is shallower than 50 m. Being shallow, these waters can easily warm up all the way down to the sea floor, where heat can penetrate cracks and conduits, destabilizing methane hydrates and sediments that were until now sealing off methane held in chambers in the form of free gas in these sediments.

Methane can then be released abruptly from the seabed in the form of plumes, causing it to rapidly pass through a shallow water column. Such plumes can quickly deplete oxygen in the water, making it harder for microbes to break down the methane. Where such plumes reach the atmosphere, they will also quickly deplete hydroxyl, which is present only in very low quantities in the Arctic in the first place.


Ominously, methane recently reached very high levels. As illustrated by above image, the MetOp-B satellite (also known as MetOp-1) recorded a peak methane level of 3644 ppb and a mean level of 1944 ppb at 367 mb on November 21, 2021, pm.

Given that humans may go extinct with a 3°C rise, and a 5°C rise will likely end most life on Earth, the COP26 summit in Glasgow could have acted more decidedly. The situation is dire and calls for the most comprehensive and effective action, as described at the Climate Plan.


Added below is the presentation Paths to Extinction by Guy McPherson


Links

• NASA Temperature Analysis
https://data.giss.nasa.gov/gistemp/

• NOAA - Monthly Temperature Anomalies Versus El Niño
https://www.ncdc.noaa.gov/sotc/global/202110/supplemental/page-4

• Historical change of El Niño properties sheds light on future changes of extreme El Niño - by Bin Wang et al. (study, 2019)

• Climate warming promises more frequent extreme El Niño events (news release, 2019)

• Changing El Niño–Southern Oscillation in a warming climate - by Wenju Cai et al. (2021)
https://www.nature.com/articles/s43017-021-00199-z

• IPCC report may have underplayed risk of freak El Nino and La Nina events
https://www.smh.com.au/environment/climate-change/ipcc-report-may-have-underplayed-risk-of-freak-el-ninos-and-la-ninas-20210820-p58klm.html

• Changing El Niño–Southern Oscillation in a warming climate
https://cshor.csiro.au/changing-el-nino-southern-oscillation-in-a-warming-climate

• How much warming have humans caused?
https://arctic-news.blogspot.com/2016/05/how-much-warming-have-humans-caused.html

• A Temperature Rise Of More Than 18 Degrees Celsius By 2026?
https://arctic-news.blogspot.com/2021/07/a-temperature-rise-of-more-than-18-degrees-celsius-by-2026.html

• Could temperatures keep rising?
https://arctic-news.blogspot.com/2021/06/could-temperatures-keep-rising.html

• Overshoot or Omnicide?
https://arctic-news.blogspot.com/2021/03/overshoot-or-omnicide.html

• Will COP26 in Glasgow deliver?
https://arctic-news.blogspot.com/2021/10/will-cop26-in-glasgow-deliver.html

• Climate Plan
https://arctic-news.blogspot.com/p/climateplan.html

• Pre-industrial
https://arctic-news.blogspot.com/p/pre-industrial.html

• Feebates
https://arctic-news.blogspot.com/p/feebates.html

• Quotes
https://arctic-news.blogspot.com/p/quotes.html

• Feedbacks
https://arctic-news.blogspot.com/p/feedbacks.html

• Extinction
https://arctic-news.blogspot.com/p/extinction.html

• Latent Heat
https://arctic-news.blogspot.com/p/latent-heat.html

• Aerosols
https://arctic-news.blogspot.com/p/aerosols.html

• Is the IPCC creating false perceptions, again?
https://arctic-news.blogspot.com/2021/08/is-the-ipcc-creating-false-perceptions-again.html

• Can we weather the Danger Zone?
https://arctic-news.blogspot.com/2018/07/can-we-weather-the-danger-zone.html

• How much warmer is it now?
https://arctic-news.blogspot.com/2018/04/how-much-warmer-is-it-now.html

• When will we die?
https://arctic-news.blogspot.com/2019/06/when-will-we-die.html

• Most Important Message Ever
https://arctic-news.blogspot.com/2019/07/most-important-message-ever.html

• Arctic Ocean invaded by hot, salty water

Wednesday, September 16, 2020

Temperatures threaten to become unbearable

Many people could face unbearable temperatures soon. 

Temperature anomalies on land in the Northern Hemisphere (red) are spread out much wider and they are more than 0.5°C higher than global land+ocean anomalies (blue).


The pale green and grey trends are both long-term trends based on January 1880-August 2020 NOAA data. The short-term red and blue trends, based on January 2013-August 2020 NOAA data, are added to show the potential for a rapid rise. How could temperatures possibly rise this fast? 

A rapid temperature rise could eventuate by 2026 due to a number of contributing factors:
• crossing of the latent heat and methane tipping points
• moving toward an El Niño 
• entering solar cycle 25
• changes in aerosols
• feedbacks kicking in more strongly as further tipping points get crossed.

Crossing the Latent Heat and Methane Hydrate Tipping Points

The image below, updated from an earlier post, shows two such tipping points.


The August 2020 ocean temperature anomaly on the Northern Hemisphere was 1.13°C above the 20th century average. The image shows a trend based on January 1880-August 2020 NOAA data. The latent heat tipping point is estimated to be 1°C above the 20th century average. Crossing the latent heat tipping point threatens to cause the methane hydrates tipping point to be crossed, estimated to be 1.35°C above the 20th century average.

Keep in mind that above images show temperature anomalies from the 20th century average, which is NOAA's default baseline. As an earlier analysis points out, when using a 1750 baseline and when using ocean air temperatures and higher Arctic anomalies, we may have already crossed both the 1.5°C and the 2°C thresholds that politicians at the Paris Agreement pledged would not get crossed.

Natural Variability - El Niño and Solar Cycle

Currently, we are currently in a La Niña period, which suppresses air temperatures.

Only a thin layer of sea ice remained left in the Arctic, with extent almost as low as it was in 2012 around this time of year, as discussed in the previous post. As air temperatures dropped in September 2020, Arctic sea ice extent started to increase again about September 15, 2020. This made that a patch of sea ice remained present at the surface of the Arctic Ocean, despite the dramatic thinning of the sea ice. 

When an El Niño event returns, conditions will get worse. 


How long will it take before we'll reach the peak of the upcoming El Niño? NOAA says
El Niño and La Niña episodes typically last nine to 12 months, but some prolonged events may last for years. While their frequency can be quite irregular, El Niño and La Niña events occur on average every two to seven years. Typically, El Niño occurs more frequently than La Niña.
The temperature rise is strongest in the Arctic, as illustrated by the zonal mean temperature anomaly map below. The map has latitude on the vertical axis and shows anomalies as high as 4.83°C or 8.69°F in the Arctic. The North Pole is at the top of the map, at 90° North, the Equator is in the middle, at 0°, and the South Pole is at the bottom, at -90° South. And yes, NASA's default baseline is 1951-1980, so anomalies are even higher when using a 1750 baseline. 


So, what could make the difference next year is an upcoming El Niño. Solar irradiance is also on the rise, in line with the 11-year Solar Cycle.


Above image shows a NOAA graph depicting the current Solar Cycle (24) and the upcoming Solar Cycle (25). 

In 2019, Tiar Dani et al. analyzed a number of studies and forecasts pointing at the maximum in the upcoming Solar Cycle occurring in the year 2023 or 2024.

The analysis found some variation in intensity between forecasts, adding images including the one on the right, which is based on linear regression and suggests that the Solar Cycle 25 may be higher than the previous Solar Cycle 24. 

In 2012, Patrick (Pádraig) Malone analyzed factors critical in forecasting when an ice-free day in the Arctic sea first might occur. 

Patrick concluded that once solar activity moved out of the solar minimum, Arctic sea ice extent would start to crash. Accordingly, a Blue Ocean Event could occur as early as 2021, as illustrated by the image below.  


Further Tipping Points and Feedbacks

Further tipping points and feedbacks can start kicking in more strongly as one tipping point gets crossed. At least ten tipping points apply to the Arctic, as discussed in an earlier post and it looks like the latent heat tipping point has already been crossed. 

Ocean heat is very high in the North Atlantic and the North Pacific, and heat continues to enter the Arctic Ocean. 


Arctic sea surface temperatures and air temperature are now high since ocean heat, previously consumed by sea ice, is now coming to the surface where the sea ice has disappeared.

As above image shows, sea surface temperature anomalies in the Arctic Ocean on September 14, 2020, were as high as 9.3°C or 16.8°F (at the location marked by green circle), compared to the daily average during the years 1981-2011. 

These high sea surface temperature anomalies occur at locations where the daily average during the years 1981-2011 was around freezing point at this time of year.

Part of this ocean heat is rising into the atmosphere over the Arctic Ocean, resulting in high air temperatures that in turn prevent formation of sea ice thick enough to survive until the next melting season. The image on the right shows a forecast of Arctic air temperatures (2 m) that are 5°C higher than 1979-2000 (forecast for October 5, 2020, 18Z run Sep 26, 2020 06Z). 

Methane Danger is High


Ominously, peak methane levels of 2762 parts per billion (ppb) were recorded by the MetOp-1 satellite on the morning of September 20, 2020, at 586 milibar (mb), as above image shows.


Mean methane levels of 1925 ppb were recorded by the MetOp-1 satellite on the morning of September 20, 2020, at 293 mb, as above image shows.


Peak methane levels of 2813 ppb were recorded by the MetOp-1 satellite on the afternoon of September 30, 2020, at 469 mb, as above image shows. 


Methane has been rising most at higher altitudes over the past few years. On September 26, 2020 pm, the MetOp-1 satellite recorded a mean global methane level of 1929 ppb at 293 mb, which is equivalent to a height of 9.32 km or 30,57 ft, i.e. in the lower stratosphere over the North Pole (the top of the troposphere over the Equator is higher, at about 17 km).

Why methane is so important

As illustrated by the image on the right, from an earlier post, high methane levels could be reached within decades, and such a scenario could unfold even without sudden big bursts, but merely due to a continuation of a trend based on data up to 2014. This would obviously result in a huge rise in global temperature. 

A huge rise in global temperature would eventuate even earlier in case of a big burst of methane erupting from the seafloor of the Arctic Ocean. 

Methane's initial global warming potential (GWP) is very high. For the first few years after its release, methane is more than 150 times as strong as a greenhouse gas compared to carbon dioxide, as discussed in an earlier post.

How high are current methane levels? NOAA's May 2020 level for methane was 1874.7 ppb

Using a GWP of 150, this translates into 1.8747 x 150 = 281.205 ppm CO₂e. 

NOAA's figures are conservative, given that NOAA measures methane at marine surface level. 

Anyway, when using this conservative NOAA methane figure of 1874.7 ppb which at a GWP of 150 results in 281.205 ppm CO₂e, and when using an additional 413.6 ppm for recent carbon dioxide levels (NOAA's global May 2020 CO₂ level), these two add up to 694.805 ppm CO₂e, which is 505.195 CO₂e away from the cloud feedback tipping point (1200 CO₂e) that can, on its own, raise global temperatures instantly by 8°C. 

This is illustrated by the image on the right, an update from an earlier post

An additional eruption of methane from the Arctic Ocean into the atmosphere of 505.195 CO₂e translates into 505.195 / 150 = 3.368 ppm or 3368 ppb of methane. 

If the current amount of methane in the atmosphere is about 5 Gt, then 3368 ppb of methane corresponds with an amount of methane just under 9 Gt.

Coincidently, a peak level of 3369 ppb was recorded on August 31, 2018, pm. Granted, there is a large difference between a local peak level and a global mean level, but then again, a much smaller burst of methane can trigger the clouds feedback.

Even a relatively small burst of methane could trigger the clouds feedback, given that it will cause huge heating of the Arctic both directly and indirectly, in turn triggering further eruptions of methane from the seafloor of the Arctic Ocean.

Huge direct heating of the Arctic could occur due to methane's high immediate GWP and its even higher Local Warming Potential (LWP) given that the release takes place in the Arctic, while huge indirect heating of Arctic would occur due to the resulting decline of sea ice and of much of the permafrost on land.

Even a relatively small burst of methane could cause not only albedo losses but also releases of carbon dioxide, methane and nitrous oxide and further fast feedbacks such as a rise in clouds and water vapor, especially over the Arctic Ocean, as illustrated by the image on the right, from the extinction page and an earlier post.

Importantly, the initial trigger to a huge temperature rise by 2026 could be an event that is typically categorized under natural variability, such as an El Niño, increased solar irradiance or a storm causing a sudden large influx of hot, salty water into the Arctic Ocean and causing an eruption of seafloor methane. Indeed, a seemingly small forcing can result in total collapse that takes place so rapidly that any political action will be too little, too late.

The video below illustrates the importance of the Precautionary Principle. The video shows how a seemingly small bump by a forklift causes all shelves in a warehouse to collapse. 


The situation is dire and calls for immediate, comprehensive and effective action, as described in the Climate Plan.


Links

• NOAA Global Climate Report - August 2020
https://www.ncdc.noaa.gov/sotc/global/202008

• Multivariate El Niño/Southern Oscillation (ENSO) Index Version 2 (MEI.v2)
https://psl.noaa.gov/enso/mei

• What are El Niño and La Niña?

• NOAA ISIS Solar Cycle Sunspot Number Progression

• Multiple regression analysis predicts Arctic sea ice - by Patrick Malone (Pádraig) Malone 
https://www.facebook.com/Amber.and.Patrick/posts/1140053003062976 

• Prediction of maximum amplitude of solar cycle 25 using machine learning - by Tiar Dani et al. 
https://iopscience.iop.org/article/10.1088/1742-6596/1231/1/012022

• NOAA - Trends in Artmospheric Methane 

• Trends in Atmospheric Carbon Dioxide - global

• When will we die?

• A rise of 18°C or 32.4°F by 2026?

• Most Important Message Ever

• Blue Ocean Event
https://arctic-news.blogspot.com/2018/09/blue-ocean-event.html

• Record Arctic Warming
https://arctic-news.blogspot.com/2016/04/record-arctic-warming.html

• Warning of mass extinction of species, including humans, within one decade


Wednesday, September 2, 2020

The unthinkable consequences of global warming

The unthinkable consequences of global warming
by Andrew Glikson

“We’re simply talking about the very life support system of this planet”. Hans Joachim Schellnhuber 2009.

“Burning all fossil fuels would create a different planet than the one that humanity knows. The paleoclimate record and ongoing climate change make it clear that the climate system would be pushed beyond tipping points, setting in motion irreversible changes, including ice sheet disintegration with a continually adjusting shoreline, extermination of a substantial fraction of species on the planet, and increasingly devastating regional climate extremes” and “this equates to 400,000 Hiroshima atomic bombs per day 365 days per yearJames Hansen et al. 2012.

Humanity is fast reaching our moment of truth. What Hansen, Schellnhuber and others have warned us is based on evidence consistent with the basic laws of science, the discipline which, contrary to medieval superstition, is founded on direct observations, calculations and on reason.

Figure 1. The change in state of the planetary climate since the onset of the industrial age in the 17ᵗʰ century.
To elaborate on the nature of the threat humanity and nature are now facing:
A. The rise in greenhouse gas levels (Figure 1) and temperatures at the Earth surface, rising by more than 1°Celsius since 1880, has been underestimated. This is because the temperature values take little account of the masking effects of sulphur dioxide and other aerosols, which transiently mitigates global temperatures by at least ~ -0.5°C. The actual rise could already be as much as 1.5 degrees Celsius, the upper level recommended by the Madrid climate conference. On present trends temperatures will rise to above 2 degrees relative to pre-industrial levels Celsius by 2030. Further temperature rises are likely to be irregular and affected by the flow of ice melt water from melting ice sheets into the oceans by mid-century.

B. The rise in temperature of large ocean regions, with much of the warming occurring to ~800 meter deep levels, reduces the ocean’s ability to absorb CO₂. This means that more CO₂ is trapped in the atmosphere, causing further warming. Also, as ocean temperatures rise, the oceans are depleted in oxygen, which leads to increased production of methane and hydrogen sulphide, which are poisonous to marine life.

C. Models projecting global warming as a linear trajectory, as outlined by the International panel of Climate Change (IPCC), take only limited account of the weakening of climate zone boundaries, as temperatures rise in the polar regions, notably the circum-Arctic jet stream. The weakening of the boundaries allows penetration of warm air masses from the south, as expressed by fires in the Tundra and the Arctic. Conversely, the injection of freezing air masses from the Arctic into North America and Europe (The so-called Beast from the East) provides further evidence for the weakening of the Arctic boundary. These are likely to produce more violent winter storms and heavier snowfalls, forming direct results of global warming. Cooling of large surface areas of the ocean by ice melt water flowing from Greenland and the Antarctica, and accumulation of warmer water in depth, lead to irregular warming trends, with a consequent three-fold rise in extreme weather events (Figure 2), especially where high temperature and cold air masses collide.
Figure 2. The number (bars, left axis), type (colors), and annual cost (right vertical axis) of U.S. billion-dollar disasters from 1980-2018. Running annual cost (grey line), along with the 95% confidence interval, and 5-year average costs (black line).The number and costs of disasters are increasing. Inland flooding (blue bars) and severe storms (green bars) are making in increasingly large contribution to the number of U.S. billion-dollar disasters.  
D. An estimated 1,400 billion tons (400 GTC) of carbon is embedded in the world’s permafrost, mostly in the Arctic and sub-Arctic, from where large amounts of carbon are released under the fast warming conditions. By comparison, the atmosphere presently contains 750 billion tons of carbon. Should a large part of the existing permafrost thaw, Earth could experience dramatic, fast and very dangerous warming. Huge amounts of methane (CH₄), the gas considered responsible for mass extinctions in the history of Earth about 251 million years ago (Permian -Triassic boundary) and 56 million years ago (Paleocene-Eocene boundary), are being released from melting permafrost and Arctic sediments, raising the atmospheric concentration of the gas by more than three-fold (from <600 to 1800 parts per billion) (Figure 3). Temperature rises during the PETM event are estimated as 5 to 8 degrees Celsius. When emitted the warming induced by methane is more than 84 times that of CO₂, declining to 25 times over some 20 years. The release to the atmosphere of a significant part of the stored carbon (permafrost ~900 billion ton carbon [GtC]), peatland 500 GtC and vegetation prone to fires (650 GtC), is sufficient to shift most of the Earth’s climate into a tropical to hyper-tropical state.
Figure 3. Global reserves and growth in the release of methane 1988-2019
E. The 2019-2010 wildfires in Australia have unleashed about 900 million tons of carbon dioxide into the atmosphere, which is equivalent to nearly double the country's total yearly fossil fuel emissions. As the planet warms, wildfires become more frequent and accelerate the warming process.

F. Sea level rise will flood the very regions where civilization has emerged, low river valleys, delta and coastal planes, which are also vital to food production. This is estimated to displace 100 million people initially, and more over time as major coastal cities are flooded.

G. The rising energy levels in warming regions of the Earth, notably tropical island chains such as the Caribbean and the Philippines, generate devastating tropical storms known as cyclones and typhoons. These wreak havoc on coastal regions of southeast North America, India, southern Africa, the Pacific and Australia.

H. Rising heat levels in tropical, subtropical and intermediate Mediterranean climate zones may render large areas unsuitable for agriculture and are physiologically difficult for humans to live in as “heat bulb” conditions set in.
An outline of the migration of climate zones in Australia and the southwestern Pacific is given in Figure 4. Further to NASA’s reported mean land-ocean temperature rise to +1.18°C for March 2020 relative to 1951-1980, large parts of the continents, including Siberia, central Asia, Canada, parts of west Africa, eastern South America and Australia, are warming toward mean temperatures of +2°C and higher. The rate exceeds that of the Last Glacial Termination (LGT) during 21–8 thousand years ago and earlier warming events. These includes the Paleocene-Eocene hyperthermal event (PETM) (about 55.9 million years ago [Ma]) and the Cretaceous-Tertiary boundary (K-T) (64.98 Ma) impact event. The relationships between the global warming rate and the migration of climate zones toward the poles are portrayed in detail on global climate maps (Figure 4).
Figure 4. The migration of the northward into southern Europe. Note the drying up of Spain,
Italy, Greece and Turkey and the increased in precipitation in Northern Europe.
In the 20th century the Earth climate has reached a tipping point, namely a point of no return. Global CO₂ and other greenhouse gases rise have reached a large factor to an order of magnitude higher than those of the past geological and mass extinction events, as have the rate of warming, the shift of climate zones and the rate of extreme weather events (Figure 2). Given the abrupt change in state of the atmosphere-ocean-cryosphere-land system, accelerating since the mid-20ᵗʰ century, the terms “climate change” and “global warming” no longer reflect the extreme scale and rate of these shifts.

Time is running out.


Andrew Glikson
Dr Andrew Glikson
Earth and Paleo-climate scientist
ANU Climate Science Institute
ANU Planetary Science Institute
Canberra, Australia


Books:
The Asteroid Impact Connection of Planetary Evolution
http://www.springer.com/gp/book/9789400763272
The Archaean: Geological and Geochemical Windows into the Early Earth
http://www.springer.com/gp/book/9783319079073
Climate, Fire and Human Evolution: The Deep Time Dimensions of the Anthropocene
http://www.springer.com/gp/book/9783319225111
The Plutocene: Blueprints for a Post-Anthropocene Greenhouse Earth
http://www.springer.com/gp/book/9783319572369
Evolution of the Atmosphere, Fire and the Anthropocene Climate Event Horizon
http://www.springer.com/gp/book/9789400773318
From Stars to Brains: Milestones in the Planetary Evolution of Life and Intelligence
https://www.springer.com/us/book/9783030106027
Asteroids Impacts, Crustal Evolution and Related Mineral Systems with Special Reference to Australia

http://www.springer.com/us/book/9783319745442


Friday, January 17, 2020

Could Humans Go Extinct Within Years?


Above image depicts how humans could go extinct within years. The image was created with NASA LOTI 1880-Dec.2019 data, 0.78°C adjusted to reflect ocean air temperatures (as opposed to sea surface temperatures), to reflect higher polar temperature anomalies (as opposed to leaving out 'missing' data) and to reflect a 1750 baseline (as opposed to a 1951-1980 baseline), with two trends added. Blue: a long-term trend based on Jan.1880-Dec.2019 data. Red: a short-term trend, based on Jan.2009-Dec.2019 data, to illustrate El Niño/La Niña variability and how El Niño could be the catalyst to trigger huge methane releases from the Arctic Ocean. This updates an earlier post with more detail on how the image was created.

The image below shows El Niño/La Niña variability going back to 1950, added to the NOAA monthly temperature anomaly.
[ click on images to enlarge ]

The image on the right shows how ocean heat has increased over the years (from: from the paper Record-Setting Ocean Warmth Continued in 2019, by Lijing Chang et al.).

Ocean heat is increasing rapidly, especially on the Northern Hemisphere, as illustrated by the NOAA image below, showing the rise from 1980 through 2019.

The image underneath uses the same data and has a trend added pointing at a 1.5°C anomaly from the 20th century average by the year 2026.

As discussed in an earlier point, there is a tipping point at 1°C above the 20th century average, i.e. there are indications that a rise of 1°C will result in most of the sea ice underneath the surface to disappear. This sea ice used to consume the inflow of warm, salty water from the Atlantic Ocean and the Pacific Ocean. So, while there may still be sea ice left at the surface, the latent heat buffer will be gone.
[ click on images to enlarge ]
Loss of the latent heat buffer speeds up heating of the Arctic Ocean, with the danger that huge amounts of methane will be released from the seafloor. The image below illustrates the danger, showing that peak methane levels as high as 2670 parts per billion (ppb) were recorded by the MetOp-1 satellite on January 2, 2020 pm at 469 mb.


Most worryingly, above image shows a large almost-solidly magenta-colored area blanketing the East Siberian Arctic Shelf (ESAS), with magenta indicating levels above 1950 ppb. Such satellite measurements indicate that large amounts of methane are erupting from the seafloor of the Arctic Ocean.


Above image shows that, a few years ago, methane was accumulating most strongly at an altitude corresponding to a pressure of some 400 mb. More recently, methane has been accumulating most strongly at higher altitudes, corresponding to a pressure of just under 300 mb, which is the upper limit of the troposphere over the North Pole. Methane tends to follow the Tropopause, i.e. at higher altitudes methane will be present in higher concentrations closer to the Equator, where the troposphere extends further into space, as discussed in an earlier post.

The NOAA graph below indicates that methane levels are growing at over 10 parts per billion per year, and this may actually underestimate global methane concentrations. The graph uses land-based measurements taken at sea level that can miss methane rising from the seafloor, especially from the seafloor of the Arctic Ocean, since there are few measuring stations in the Arctic in the first place. Land-based measurements can additionally overlook methane that is moving along the Tropopause from the Arctic toward the Equator.

Ominously, the image below shows high methane levels at Barrow, Alaska, at the end of January 2020.


Rising CO₂ levels are also worrying. A daily average CO₂ level of 415.79 ppm was recorded by NOAA at Mauna Loa, Hawaii, on January 21, 2020, a level that is unprecedented for millions of years. Since an annual peak is typically reached in May, we can expect even higher levels over the coming months.


It's not just at Mauna Loa that such high CO₂ readings were recorded recently. The image below shows CO₂ levels recorded recent;y at Barrow, Alaska.


Fires in Australia have contributed to these high CO₂ levels. The image below shows smoke plumes from fires in Australia on January 4, 2020.


Such fires can generate huge amounts of smoke, with smoke rising up high in the atmosphere and entering the stratosphere, while circumnavigating Earth. The ferocity of these fires is also shown in the NASA video below.


In the video below, Guy McPherson gives examples of species that went extinct rapidly.


Meanwhile, the Bulletin of the Atomic Scientists has moved the Doomsday Clock closer to Midnight, to 100 seconds to Midnight, adding that Civilization-ending nuclear war—whether started by design, blunder, or simple miscommunication—is a genuine possibility. Climate change that could devastate the planet is undeniably happening. And for a variety of reasons that include a corrupted and manipulated media environment, democratic governments and other institutions that should be working to address these threats have failed to rise to the challenge. Faced with a daunting threat landscape and a new willingness of political leaders to reject the negotiations and institutions that can protect civilization over the long term, the Bulletin of the Atomic Scientists Science and Security Board moved the Doomsday Clock 20 seconds closer to midnight—closer to apocalypse than ever. 

The image below, created with thebulletin.org content and data from 1991 to 2020, has a linear trend added that points at Midnight by 2022.


The situation is dire and calls for immediate, comprehensive and effective action, as described in the Climate Plan.


Links

• Extinction in 2020?
https://arctic-news.blogspot.com/2019/12/extinction-in-2020.html

• NOAA Global Climate Report - Annual 2019 - Monthly temperature anomalies versus El Niño
https://www.ncdc.noaa.gov/sotc/global/201913/supplemental/page-2

• Record-Setting Ocean Warmth Continued in 2019 - by Lijing Chang et al.
https://link.springer.com/article/10.1007/s00376-020-9283-7

• 2020 El Nino could start 18°C temperature rise
https://arctic-news.blogspot.com/2019/11/2020-el-nino-could-start-18-degree-temperature-rise.html

• Near-Term Human Extinction
http://arctic-news.blogspot.com/2014/04/near-term-human-extinction.html

• NOAA Global CH4 Monthly Means
https://www.esrl.noaa.gov/gmd/ccgg/trends_ch4

• Methane Erupting From Arctic Ocean Seafloor
http://arctic-news.blogspot.com/2017/03/methane-erupting-from-arctic-ocean-seafloor.html

• NASA: Global Transport of Smoke from Australian Bushfires
https://gmao.gsfc.nasa.gov/research/science_snapshots/2020/Australia_fires_smoke.php

• NASA: Global Transport of Australian Bushfire Smoke
https://climate.nasa.gov/climate_resources/202/global-transport-of-australian-bushfire-smoke

• Bulletin of the Atomic Scientists
https://thebulletin.org/doomsday-clock/past-statements/

• Doomsday by 2021?
https://arctic-news.blogspot.com/2018/11/doomsday-by-2021.html

• Climate Plan
https://arctic-news.blogspot.com/p/climateplan.html