Showing posts with label projection. Show all posts

Thursday, June 13, 2013

Arctic sea ice thickness falls by 2m in 21 days in some areas

For years, warnings have been raised about the dramatic decline of Arctic sea ice. Various posts at this blog have also analyzed the exponential nature of the decline in summer sea ice volume and the many feedbacks that fuel this decline. And for years, the conclusion has been that - without action - the sea ice looks set to disappear altogether within years.

Yet, many are still ignoring this warning, often with remarks such as "some of the ice is 5 meters thick; it would take decades for all that ice to melt!" Thick ice does indeed pile up along the northern coast of Greenland and Ellesmere Island, due to the way the ice drifts. This has lead some to argue that an S-shaped curve (sigmoid or gompertz trendline) was more appropriate, with the decline in sea ice volume slowing down as it approaches zero.

However, this argument doesn't seem make much sense, since such a S-shaped trendline would only apply to a relatively small area with very thick sea ice. Exponential curves would still remain the best fit to predict the decline of the sea ice in the Arctic Ocean at large.

Moreover, is it really more appropriate to say that summer sea ice looks set to virtually disappear within years, with just a tiny sliver of ice remaining north of Greenland and Ellesmere Island, instead of saying that the sea ice looks set to disappear altogether within years? How persistent will such a sliver really be?

One of the feedbacks of sea ice decline is that, as the decline progresses, cyclones can be expected to hit the remaining sea ice ever harder. How much damage can such cyclones and further feedbacks do? A previous post describes thin spots developing in the sea ice under the influence of a cyclone. The image below shows areas at the center of the Arctic Ocean (large circle) where thickness of the sea ice fell from 2 meters to 1 meters over a period of 21 days. Furthermore, the image below also shows that, over this period, 5m-thick ice was reduced to 3-meters thickness (top small circle), while 2m-thick ice was reduced to zero (bottom small circle).

2m falls in thickness in 21 days - click on image to enlarge
In conclusion, without action the Arctic sea ice looks set to continue to decline exponentially, while strong feedbacks such as cyclones developing when there is more open water, look set to add to the decline and cause the Arctic sea ice to disappear completely within years. For an overview of lines of action, see this post at the methane hydrates blog.

Saturday, April 6, 2013

How much will temperatures rise?

Runaway Global Warming


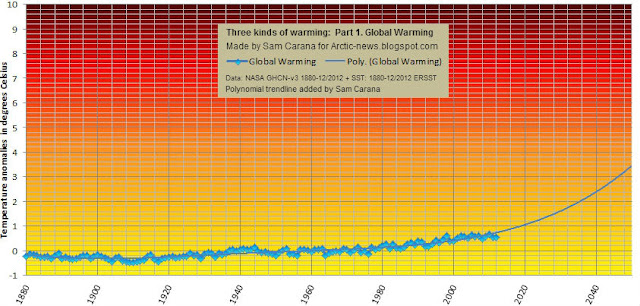
If we take the NASA Annual Mean Land-Ocean Temperatures and draw a projection into the future, temperatures will quickly be 3 degrees Celsius higher than the base period (1951-1980), i.e. well before 2050, as illustrated on image 1. below. 

Image 1. Temperatures will be 3 degrees Celsius higher well before 2050

Above projection appears to be steeper than even the worst-case scenario pictured by the IPCC for years, such as on the image below.

Image 2. from IPCC 2001. Projections of globally averaged surface temperature 2000-2100 are shown for six SRES scenarios and IS92a using a model with average climate sensitivity. The grey region marked "several models all SRES envelope" shows the range of results from the full range of 35 SRES scenarios in addition to those from a range of models with different climate sensitivities. The temperature scale is departure from the 1990 value.
Could temperatures rise faster in future than what the IPCC anticipated in 2001? The answer must be yes! In 2007, the IPCC described that, even if greenhouse gas concentrations in the atmosphere were stabilized for 100 years at year 2000 values (B1), then we would still be committed to a further warming of 0.5°Celsius. This committed warming should not be confused with ‘unavoidable climate change’ over the next half century, which would be greater because forcing cannot be instantly stabilized. And of course, as it turned out, emissions have not been stabilized at 2000 values, but have in fact increased substantially.

As it turned out, the models used by the IPCC made all kinds of assumptions that didn't eventuate. But before deciding to instead settle for a relatively simple extrapolation of observed data, there are some issues that require a further look.  

As discussed in the earlier post Accelerated Arctic Warming, temperatures in the Arctic have been rising at a much faster pace than global temperatures, and if this accelerated rise continues, we can expect a 10 degrees Celsius rise in the Arctic before 2040, as illustrated by image 3. below.  

Image 3. Three kinds of warming - 2: Accelerated warming in the Arctic 
Such a temperature rise in the Arctic will undoubtedly lead to additional greenhouse gas emissions in the Arctic, of carbon dioxide, nitrous oxide and particularly methane, threatening to trigger runaway global warming. 

The image below, from the methane-hydrates blog, combines these three kinds of warming, showing global temperatures that soon catch up with accelerated Arctic warming, as heatwaves at high latitudes will cause wildfires, in particular in Siberia, where firestorms in peat-lands, tundras and forests could release huge amounts of emissions, including soot, much of which could settle on the Himalayan plateau, darkening the ice and snow and resulting in more local heat absorption. Rapid melt of glaciers will then cause flooding at first, followed by dramatic decreases in the flow of river water that up to a billion people now depend on for water supply and irrigation.

In other words, the situation looks much more dire than what most models make us believe; the more reason to adopt the climate plan that is also described at the post at the methane-hydrates blog.

Image 4. Three kinds of warming - 1, 2 and 3 


References

- IPCC (TAR) - Climate Change 2001: Synthesis Report

- IPCC (AR4) - Climate Change 2007: Working Group I: The Physical Science Basis

- Accelerated Arctic Warming

- Methane hydrates

Sunday, June 10, 2012

Arctic sea ice volume on track to reach zero around 2015

The image below shows recent data on Arctic sea ice volume, as calculated using the Pan-Arctic Ice Ocean Modeling and Assimilation System (PIOMAS, Zhang and Rothrock, 2003) developed at the Polar Science Center, Applied Physics Laboratory, University of Washington.


As shown on the images below, by Wipneus and earlier published at the Arctic Sea Ice Blog, sea ice volume loss is on track to reach a minimum of 3000 cubic kilometers this summer.
The recent sea ice volume is in line with the exponential trend calculated by Wipneus that is pointing at zero ice volume around 2015 (image below).


Will sea ice collapse in 2014?As described in an earlier post, I believe that a trendline pointing at 2014 fits the data best (image left).

As discussed, some ice may persist close to Greenland for a few years more, since Greenland constitutes a barrier that holds the sea ice in place. Similarly, natural variability could prolong the ice longer than expected.

However, such arguments offer no reason to rule out an imminent collapse of the sea ice, since natural variability works both ways, it could bring about such a collapse either earlier or later than models indicate.

In fact, the thinner the sea ice gets, the more likely an early collapse is to occur. There is robust evidence that global warming will increase the intensity of extreme weather events, so more heavy winds and more intense storms can be expected to increasingly break up the remaining ice in future, driving the smaller parts out of the Arctic Ocean more easily. Much of the sea ice loss already occurs due to sea ice moving along the edges of Greenland into the Atlantic Ocean.

Could you think of any reason why Arctic sea ice would NOT collapse in 2014?