Showing posts with label drought. Show all posts

Thursday, November 14, 2019

Portents of continental-scale fires as the Earth warms

Andrew Glikson
Earth and climate scientist
Australian National University
15.11.2019

The effects of encroaching deserts and of fire storms on terrestrial forests originally developed under moderate conditions distinct from those emerging under rapid global warming and extreme weather events may have been underestimated. Average global temperatures do not tell the story — it is the increasingly frequent weather anomalies which do. Powerful psychological factors prevent many scientists from expressing their worst fears, a phenomenon dubbed as “scientific reticence”.

As the tropical climate zones expand toward the poles, moderate climate zones shift polar-ward and are contracting where they clash with polar-derived cold air and ice melt water flow through weakened jet stream boundaries. As climate zones are shifting at a rate of 56-111 km per decade and ecosystems have only a short time to adapt, arid zones expand and droughts and fires consume the moderate-climate forests and formerly fertile habitats. Allen et al. (2012) suggest the increase in black carbon aerosols and tropospheric ozone constitute significant factors generating a polar-ward shift of moderate climate zones.

Global fire maps by NASA document the progression of wildfires since about 2000, including major fires in Siberia, northwest Europe, southern Europe, Russia, Southeast Asia, Australia, central and southern America, California and elsewhere (Fig. 1).

Figure 1. The Moderate Resolution Imaging Spectro-radiometer (MODIS) on NASA's Terra satellite showing fires around the world. Credit: NASA
Some of the global patterns that appear in the fire maps are the result of natural cycles of rainfall, dryness, and lightning. For example, naturally-occurring fires are common in the boreal forests of Canada in the summer. In other parts of the world, the patterns are the result of human activity. For example, the intense burning in the heart of South America from August-October is a result of human-triggered fires, both intentional and accidental.

Many scientists and the IPCC have underestimated the scale and rate of global warming and its consequences. With exceptions, the need for excessive caution and absolute certainty in science is often manifested in reticence from the mainstream science (‘Down to Earth’ 2019). However, the available evidence suggests that scientists have in fact been conservative in their projections of the impacts of climate change and at least some of the key attributes of global warming from increased atmospheric greenhouse gases have been underpredicted, particularly in IPCC assessments of the physical science by Working Group I.

By contrast, at a speed hardly anticipated about 20 years ago, wildfires have been spreading around the globe over large parts of the continents.

Nor do average global land-ocean temperatures tell the whole story. It is the increasingly frequent anomalies which underlie extreme weather events (Fig. 2), including rapid Arctic melt, heatwaves, fires, storms and cyclones, which underpin the fundamental shift in the state of the terrestrial climate.

Figure 2. Temperature anomaly distribution: The frequency of occurrence (vertical axis) of local temperature anomalies (relative to 1951-1980 mean) in units of local standard deviation (horizontal axis). Area under each curve is unity. Image credit: NASA/GISS.
It has been stated “What happens in the Arctic doesn't stay in the Arctic”. Temperatures in the Arctic have reached 34°C in July 2019, affecting melting over 700,000 km² in Greenland late May 2019. The weakening of the circum-Arctic jet stream ensues in its undulation and intersection by warm air masses moving north and by cold air masses moving south, along with ice melt from the Greenland ice sheet forming cold regions in the North Atlantic Ocean.

Figure 3. Weather systems driven by the 
strong westerly winds of the Antarctic 
polar vortex curl over the southern 
continents (NASA, Galileo).
According to the Australian Climate Council, climate change has contributed to a southward shift in weather systems that typically bring cool season rainfall to southern Australia. As the cold humid spirals of the Antarctic vortex (Fig. 3) recede to the south, since the 1970s late autumn and early winter rainfall has decreased by 15% in southeast Australia, and Western Australia’s southwest region. Current drought conditions come after a 2016/2017 and 2018 Summer characterized by record-breaking temperatures, followed by a record dry winter. Rainfall over southern Australia during autumn 2018 was the second lowest on record (Fig. 4). The drought has reached extreme level, accompanied by wildfires. Australia, like other parts of the world, is paying the price of climate change in terms of growing damage to its agriculture, communities and way of life.

Figure 4. Australia: Current effects of global warming. 
A. 2018 annual mean temperatures compared to historical temperature observations. 
B. 2018 annual rainfall compared to historical rainfall observations.
The global rise rate in CO₂ has reached 2 to 3 ppm/year, the fastest rate since 66 million years ago, and a level of CO₂-equivalent (a value including the radiative forcing of methane and nitrous oxide) near 500 ppm. According to the IMF (2017), the world is subsidizing fossil fuels by $5.2 trillion, equal to roughly 6.5% of global GDP. By contrast, the loss of wealth due to reduced agricultural productivity due to climate change is projected to exceed $19 billion by 2030, $211 billion by 2050 and a projected $4 trillion by 2100.

Figure 5. Fires in Australia, November 8, 2019, NASA Worldview 
As stated by Hansen et al. (2012): “Burning all fossil fuels would create a different planet than the one that humanity knows. The palaeoclimate record and ongoing climate change make it clear that the climate system would be pushed beyond tipping points, setting in motion irreversible changes, including ice sheet disintegration with a continually adjusting shoreline, extermination of a substantial fraction of species on the planet, and increasingly devastating regional climate extremes”.


Andrew Glikson
Dr Andrew Glikson
Earth and climate scientist
Australian National University


Books:
The Archaean: Geological and Geochemical Windows into the Early Earth
The Asteroid Impact Connection of Planetary Evolution
The Plutocene: Blueprints for a Post-Anthropocene Greenhouse Earth
Evolution of the Atmosphere, Fire and the Anthropocene Climate Event Horizon
Asteroids Impacts, Crustal Evolution and Related Mineral Systems with Special Reference to Australia
Climate, Fire and Human Evolution: The Deep Time Dimensions of the Anthropocene
From Stars to Brains: Milestones in the Planetary Evolution of Life and Intelligence


Thursday, August 2, 2018

Global fires, droughts and Orwellian Newspeak while Nero fiddles

By Andrew Glikson

There was a time when the contamination of drinking water constituted a punishable crime. Nowadays those who willfully ignore or promote the destruction of the Earth’s atmosphere and ocean acidification through the rise in emission of carbon gases (2014 ~36.08 billion ton CO₂/year ; 2017 ~36.79 billion ton CO₂/year), hold major sway in the world. Consequently the rise rate of atmospheric CO₂ at 2 ppm/year (from 408.84 ppm in June 2014 to 410.79 ppm in June 2018) is the fastest observed in the geological record since 66 million years ago, when an asteroid hit the Earth, wiping out the dinosaurs. (onlinelibrary.wiley.com/doi/abs/10.1111/gcb.13342). The hapless residents of planet Earth are torn between survival in several parts of the world and sport circuses in other parts, while some of their representatives are playing with chunks of coal in their parliament.

See interactive version of image at:
carbonbrief.org/analysis-global-co2-emissions-set-to-rise-2-percent-in-2017-following-three-year-plateau

The consequences in terms of heat waves, fires, droughts, storms, floods, human lives and devastation of nature are everywhere. From Japan to Sweden, Oman to Texas and California, a global heat wave is setting records, igniting wildfires, and killing hundreds.
nymag.com/daily/intelligencer/2018/07/a-global-heat-wave-has-set-the-arctic-circle-on-fire.html

The south-central region is home to the highest temperatures in the U.S. this week, with nearly 35 million people living under excessive heat warnings issued by the National Weather Service. Temperatures are expected to be in the triple digits across Texas this weekend, marking the most severe heat wave in the state since 2011. The Texas heat has already led to record-breaking days for the Texas power grid twice this week. Things aren’t any better elsewhere in the region, with heat indexes in Oklahoma, Arkansas, and Louisiana reaching up to 110°F.

Dozens are dead in Japan from record-setting, long duration extreme heat event.
climatesignals.org/headlines/dozens-dead-japan-record-setting-long-duration-extreme-heat-event
theweek.in/news/world/2018/07/23/japanese-heat-wave-pushes-temperature-to-record.html
Across the globe in Kyoto, Japan, Thursday marked the seventh straight day of temperatures that exceeded 100 degrees, breaking all known records for the ancient capital city. At least 30 people have died in Japan during the heat wave, which has complicated rescue efforts following floods and landslides that killed more than 200 in western Japan earlier this month. On Thursday alone ten people died and 2,605 people were sent to hospitals in Tokyo due to heat, the Japan Times reports. The day before, Tokyo rescue workers set a record by responding to more than 3,000 emergency calls.

In Sweden, the Arctic Circle is on fire. High temperatures and a prolonged drought have caused 49 fires to ignite across Sweden, with temperatures reaching 90 degrees as far north as the Arctic Circle this week. According to the Washington Post, temperatures in Scandinavia typically settle in the 60s and 70s this time of year, meaning the current heat wave is making things around 20 degrees hotter than normal. In Quebec, more than 90 people were killed by extreme heat in early July. An Algerian city earlier this month broke the record for the highest temperature ever in Africa when it hit 124.3°F.
nymag.com/daily/intelligencer/2018/07/a-global-heat-wave-has-set-the-arctic-circle-on-fire.html

The current heatwave has been caused by an extraordinary stalling of the jet stream wind, which usually funnels cool Atlantic weather over the continent. This has left hot, dry air in place for two months – far longer than usual. The stalling of the northern hemisphere jet stream is being increasingly firmly linked to global warming, in particular to the rapid heating of the Arctic and resulting loss of sea ice.
theguardian.com/environment/2018/jul/27/heatwave-made-more-than-twice-as-likely-by-climate-change-scientists-find

Prof Michael Mann declares “This is the face of climate change … We literally would not have seen these extremes in the absence of climate change … The impacts of climate change are no longer subtle … We are seeing them play out in real time and what is happening this summer is a perfect example of that … We are seeing our predictions come true …". Mann points out that the link between smoking tobacco and lung cancer is a statistical one, which does not prove every cancer was caused by smoking, but epidemiologists know that smoking greatly increases the risk. “That is enough to say that, for all practical purposes, there is a causal connection between smoking cigarettes and lung cancer and it is the same with climate change.”
theguardian.com/environment/2018/jul/27/extreme-global-weather-climate-change-michael-mann

Australia, emitting 138 million tons of CO₂e in 2017 and in 2017 exporting 200 million tonnes thermal coal and 172 million tons metallurgical coal, is currently suffering major consequences in terms of drought in New South Wales, north-west Victoria and eastern South Australia.

The factors, as explained by Blair Trewin of the Bureau of Meteorology, include: “a stronger than usual sub-tropical ridge over southern Australia. That means that frontal systems that would normally start affecting southern Australia more generally during the winter are instead mostly passing south of the continent, really only affecting Tasmania and perhaps southern Victoria."

Although the polar-ward migration of climate zones pushed southward by the tropical Hadley Cell constitutes an integral feature of global climate change, rarely does the term “climate change” appear in relevant government and farmers’ statements. Orwellian Newspeak has won the day once again, where talk about the “National energy guarantee” appears to divert attention from the global climate crisis to power prices, in a country where the sky is the limit for alternative clean energy—solar, wind and tide.

The cover-up by the compliant mainstream media, radio and TV of the climate change origin of the heat waves and of fires in the northern hemisphere, and of the drought in the southern hemisphere, is now almost complete. In true Orwellian newspeak terms the words “climate change” have now been replaced with “energy security”..

Andrew Glikson
Dr Andrew Glikson
Earth and Paleo-climate science
ANU Climate Change Institute
ANU Planetary Science Institute
Books:
http://www.springer.com/gp/book/9783319079073
http://www.springer.com/gp/book/9789400763272
http://www.springer.com/us/book/9783319745442
http://www.springer.com/gp/book/9783319225111
http://www.springer.com/gp/book/9783319572369
http://www.springer.com/gp/book/9789400773318


Saturday, May 31, 2014

How many deaths could result from failure to act on climate change?

A recent OECD analysis concludes that outdoor air pollution is killing more than 3.5 million people a year globally. The OECD estimates that people in its 34 Member countries would be willing to pay USD 1.7 trillion to avoid deaths caused by air pollution. Road transport is likely responsible for about half.

[ from an earlier post ]
A 2012 report by DARA calculated that 5 million people were dying each year from climate change and carbon economies, mostly from indoor smoke and (outdoor) air pollution.

Back in 2012, a Reuters report calculated that this could add up to a total number of 100 million deaths over the coming two decades. This suggests, however, that failure to act on climate change will not cause even more deaths due to other causes.

Indeed, failure to act on climate change could result in many more deaths due to other causes, in particular food shortages. As temperatures rise, ever more extreme weather events can be expected, such as flooding, heatwaves, wildfires, droughts, and subsequent crop loss, famine, disease, heat-stroke, etc.

So, while currently most deaths are caused by indoor smoke and outdoor air pollution, in case of a failure to act on climate change the number of deaths can be expected to rise most rapidly among people hit by heat stress, famine, fresh water shortages, as well as wars over who controls access to land, food, fresh water, etc.

How high could figures rise? Below is an update of an image from the earlier post Arctic Methane Impact with a scale in both Celsius and Fahrenheit added on the right, illustrating the danger that temperature will rise to intolerable levels if little or no action is taken on climate change. The inset shows projected global number of annual climate-related deaths for these two scenarios, i.e. little or no action, and also shows a third scenario of comprehensive and effective action that instead seeks to bring temperature rise under control.

[ click on image to enlarge ]
For further details on comprehensive and effective climate action, see the ClimatePlan.


Links


• The Cost of Air Pollution | OECD analysis, published May 2014
http://www.oecd.org/environment/cost-of-air-pollution.htm

• DARA Climate Vulnerability Monitor
http://daraint.org/climate-vulnerability-monitor/climate-vulnerability-monitor-2012/

• 100 mln will die by 2030 if world fails to act on climate - report | REUTERS
http://www.reuters.com/article/2012/09/25/climate-inaction-idINDEE88O0HH20120925

• Arctic Methane Impact
https://arctic-news.blogspot.com/2013/11/arctic-methane-impact.html

• Is death by lead worse than death by climate? No. | by Paul Beckwith
https://arctic-news.blogspot.com/2012/10/is-death-by-lead-worse-than-death-by-climate-no.html

• Climate Plan
https://arctic-news.blogspot.com/p/climateplan.html


Saturday, April 5, 2014

Escalating extreme weather events to hammer humanity


By Paul Beckwith

Extreme weather events are rocketing upwards in their frequency of occurrence, intensity, and duration and are impacting new regions that are unprepared. These events, such as torrential rains, are causing floods and damaging crops and infrastructure like roads, rail, pipelines, and buildings. Cities, states, and entire countries are being battered and inundated resulting in disruption to many peoples lives as well as enormous economic losses. As bad as this is, it is going to get much worse by at least 10 to 20 times. Why?

Greenhouse gas emissions from humans have changed the chemistry of the atmosphere. The optical absorption of infrared heat has increased in the atmosphere which raises temperature, and thus water vapor content, and therefore fuels more intense storms. The jet streams that guide these storms are slower and wavier and more fractured and cause our weather gyrations and weird behavior. Areas far north can get very warm, while areas far south can get very cold. Some areas get persistent drought. Then, the pattern can flip. The jet streams are much wavier in the north-south direction since the Arctic temperatures have warmed 5 to 8 times faster than the global average. This reduces the temperature difference between the Arctic and equator and basic physics forces the jets to slow and get wavier.

Why is the Arctic warming greatly amplified? The region is darkening and thus absorbing more sunlight, since the land-based snow cover in spring and the Arctic sea ice cover volume are both declining exponentially. The white snow and ice is being replaced by dark surfaces like the ocean and the tundra. The most detailed computer model on sea ice decline is a U.S. Naval Graduate School model, and it shows the sea ice cover could be gone by late summer in 2016. If this happens, the Arctic warming will rocket upwards, the jets will distort much more, and the extreme weather events will rocket upwards in frequency, amplitude, and duration and civilization will be hammered.


Paul Beckwith
Paul Beckwith is part-time professor with the laboratory for paleoclimatology and climatology, department of geography, University of Ottawa. Paul teaches climatology/meteorology and does PhD research on 'Abrupt climate change in the past and present'. Paul holds an M.Sc. in laser physics and a B.Eng. in engineering physics and reached the rank of chess master in a previous life. Below are Paul's earlier posts at the Arctic-news blog.

Thursday, June 27, 2013

The Threat of Wildfires in the North

NASA/NOAA image based on Suomi NPP satellite data from April 2012 to April 2013, with grid added
A new map has been issued by NOAA/NASA. The map shows that most vegetation grows in two bands, i.e. the Tropical Band (between latitudes 15°N and 15°S) and the Northern Band in between 45°N and 75°N, i.e. in North America, Europe and Siberia. On above image, the map is roughly overlayed with a grid to indicate latitude and longitude co-ordinates.


Vegetation in the Northern Band extends beyond the Arctic Circle (latitude 66° 33′ 44″ or 66.5622°, in blue on above image from Arcticsystem.no) into the Arctic, covering sparsely-populated areas such in Siberia, Alaska and the northern parts of Canada and Scandinavia. Further into the Arctic, there are huge areas with bush and shrubland that have taken thousands of years to develop, and once burnt, it can take a long time for vegetation to return, due to the short growing season and harsh conditions in the Arctic.


Above map with soil carbon content further shows that the top 100 cm of soil in the northern circumpolar region furthermore contains huge amounts of carbon.

May 16 2013 Drought 90 days Arctic
Global warming increases the risk of wildfires. This is especially applicable to the Arctic, where temperatures have been rising faster than anywhere else on Earth. Anomalies can be very high in specific cases, as illustrated by the temperature map below. High temperatures and drought combine to increase the threat of wildfires (see above image showing drought severity).

June 25, 2013 from Wunderground.com - Moscow broke its more than 100-year-old record for the hottest June 27
Zyryanka, Siberia, recently recorded a high of 37.4°C (99.3°F), against normal high temperatures of 20°C to 21°C for this time of year. Heat wave conditions were also recorded in Alaska recently, with temperatures as high as 96°F (36°C).

On June 19, 2013, NASA captured this image of smoke from wildfires burning in western Alaska. The smoke was moving west over Norton Sound. (The center of the image is roughly 163° West and 62° North.) Red outlines indicate hot spots with unusually warm surface temperatures associated with fire. NASA image by Jeff Schmaltz, LANCE/EOSDIS Rapid Response. Caption by Adam Voiland. - also see this post with NASA satellite image of Alaska.
Siberian wildfires June 21, from RobertScribbler 
from methanetracker.org

Wildfires raged in Russia in 2010. Flames ravaged 1.25 million hectares (4,826 mi²) of land including 2,092 hectares of peat moor.

Damage from the fires is estimated to be $15 billion, in a report in the Guardian.

Cost of fire-fighting efforts and agricultural losses alone are estimated at over $2bn, reports Munich Re, adding that Moscow's inhabitants suffered under a dense cloud of smoke which enveloped the city. In addition to toxic gases, it also contained considerable amounts of particulate matter. Mortality increased significantly: the number of deaths in July and August was 56,000 higher than in the same months in 2009. 


[From: Abrupt Local Warming, May 16, 2012]

Wildfires in the North threaten to cause large emissions of greenhouse gases and soot, which can settle on snow and ice in the Arctic and the Himalayan Plateau, with the resulting albedo changes causing a lot more sunlight to be absorbed, instead of reflected as was the case earlier. This in turn adds to the problem. Additionally, rising temperatures in the Arctic threaten to cause release of huge amounts of methane from sediments below the Arctic Ocean. This situation threatens to escalate into runway global warming in a matter of years, as illustrated by the image below.

How much will temperatures rise?
In conclusion, the risk is unacceptable and calls for a comprehensive and effective action plan that executes multiple lines of action in parallel, such as the 3-part Climate Action Plan below. Part 1 calls for a sustainable economy, i.e. dramatic reductions of pollutants on land, in oceans and in the atmosphere. Part 2 calls for heat management. Part 3 calls for methane management and further measures.


The Climate Action Plan set out in above diagram can be initiated immediately in any country, without the need for an international agreement to be reached first. This can avoid delays associated with complicated negotiations and on-going verification of implementation and progress in other nations.

In nations with both federal and state governments, such as the United States of America, the Climate Action Plan could be implemented as follows:
  • The President directs federal departments and agencies to reduce their emissions for each type of pollutant annually by a set percentage, say, CO2 and CH4 by 10%, and HFCs, N2O and soot by higher percentages.
  • The President demands states to each make the same cuts. 
  • The President directs the federal Environmental Protection Agency (EPA) to monitor implementation of states and to act step in where a state looks set to fail to miss one or more targets, by imposing (federal) fees on applicable polluting products sold in the respective state, with revenues used for federal benefits.
Such federal benefits could include building interstate High-Speed Rail tracks, adaptation and conservation measures, management of national parks, R&D into batteries, ways to vegetate deserts and other land use measurements, all at the discretion of the EPA. The fees can be roughly calculated as the average of fees that other states impose in successful efforts to meet their targets.

This way, the decision how to reduce targets is largely delegated to state level, while states can similarly delegate decisions to local communities. While feebates, preferably implemented locally, are recommended as the most effective way to reach targets, each state and even each local community can largely decide how to implement things, provided that each of the targets are reached.

Similar targets could be adopted elsewhere in the world, and each nation could similarly delegate responsibilities to local communities. Additionally, it makes sense to agree internationally to impose extra fees on international commercial aviation, with revenues used to develop ways to cool the Arctic.

- Climate Plan


Monday, December 31, 2012

How to avoid mass-scale death, destruction and extinction

The image below shows the FAO Food Price Index (Cereals), updated to October 2012.

[ image from earlier post ]

The above FAO Food Price Index shows that high food prices have been around for the past few years. The FAO, in its recent Cereal Supply and Demand Brief, explains that we can expect prices to rise, as illustrated below.


The Economic Research Service of the U.S. Department of Agriculture mentions, in its Food Price Outlook, 2012-2013, that the "drought has affected prices for corn and soybeans as well as other field crops which should, in turn, drive up retail food prices".

Global food supply is under stress as extreme weather becomes the new norm. Farmers may be inclined to respond to drought by overusing ground water, or by slashing and burning forest, in efforts to create more farmland. Such practices do not resolve the problems; instead, they tend to exacerbate the problems over time, making things progressively worse.

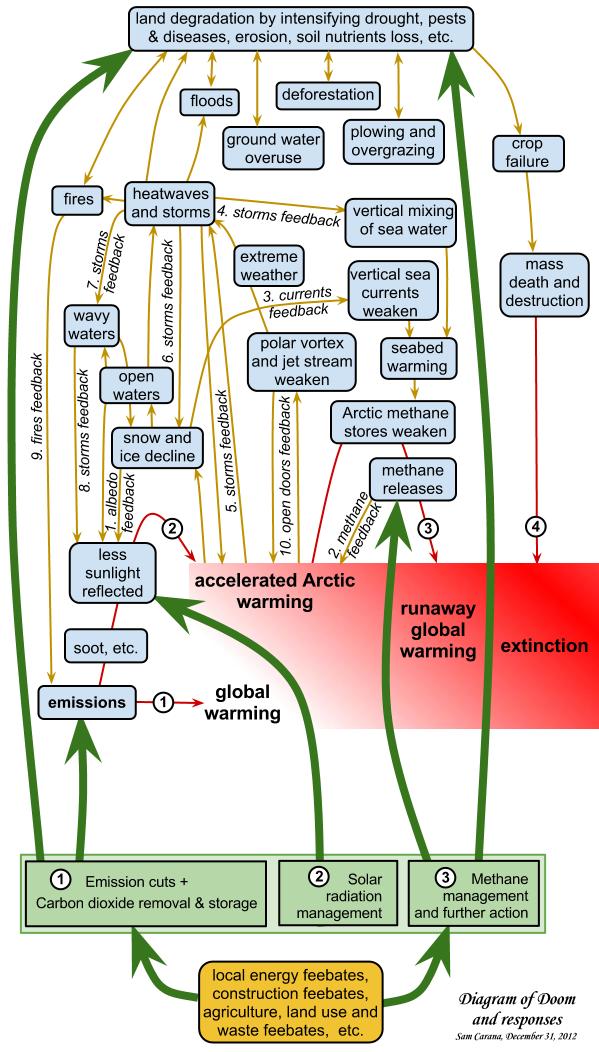
The diagram below shows that there are many climatological feedbacks (ten of which are pictured) that make climate change worse. At the top, the diagram pictures vicious cycles that are responses by farmers that can add to make the situation even worse. Without effective action, the prospect is that climate change and crop failure combine to cause mass death and destruction, with extinction becoming the fourth development of global warming.

How can we avoid that such a scenario will eventuate? Obviously, once we are in the fourth development, i.e. mass-scale famine and extintion, it will be too late for action. Similarly, if the world moves into the third development, i.e. runaway global warming, it will be hard, if not impossible to reverse such a development. Even if we act now, it will be hard to reverse the second development, i.e. accelerated warming in the Arctic.

The most effective action will target causes rather than symptoms of these developments.

Part 1. Since emissions are the cause of global warming, dramatic cuts in emissions should be included in the first part of the responses. In addition, action is needed to remove excess carbon dioxide from the atmosphere and oceans. Storing the carbon in the soil will also improve soil quality, as indicated by the long green arrow on the left.

Part 2. Solar radiation management is needed to cool the Arctic.

Part 3. Methane management and further action is needed, e.g. to avoid that methane levels will rise further in the Arctic, which threatens to trigger further releases and escalate into runaway global warming. Measures to reduce methane can also benefit soil quality worldwide, as indicated by the long green arrow on the right.

Thus, the proposed action tackles the prospect of mass death and extinction by increasing soil fertility, as illustrated by the image below.


As indicated at the bottom of the image, the most effective policies to accomplish the goals set out in both part 1. and part 3. are feebates, preferably implemented locally.

Saturday, September 15, 2012

Threat to global food supply makes comprehensive action imperative

Climate change is strongly affecting the Arctic and the resulting changes to the polar vortex and jet stream are in turn contributing to extreme weather in many places, followed by crop loss at a huge scale.

The U.N. Food and Agriculture Organization (FAO) said in a September 6, 2012, forecast that continued deterioration of cereal crop prospects over the past two months, due to unfavourable weather conditions in a number of major producing regions, has led to a sharp cut in FAO’s world production forecast since the previous report in July.

The bad news continues: Based on the latest indications, global cereal production would not be sufficient to cover fully the expected utilization in the 2012/13 marketing season, pointing to a larger drawdown of global cereal stocks than earlier anticipated. Among the major cereals, maize and wheat were the most affected by the worsening of weather conditions.

The image below shows the FAO Food Price Index (Cereals), updated to October 2012.

Apart from crop yield, extreme weather is also affecting soils in various ways. Sustained drought can cause soils to lose much of their vegetation, making them more exposed to erosion by wind, while the occasional storms, flooding and torrential rain further contribute to erosion. Higher areas, such as hills, will be particularly vulnerable, but even in valleys a lack of trees and excessive irrigation can cause the water table to rise, bringing salt to the surface.

Fish are also under threat, in part due to ocean acidification. Of the carbon dioxide we're releasing into the atmosphere, about a third is (still) being absorbed by the oceans. Dr. Richard Feely, from NOAA’s Pacific Marine Environmental Laboratory, explains that this has caused, over the last 200 years or so, about a 30% increase in the overall acidity of the oceans. This affects species that depend on a shell to survive. Studies by Baumann (2011) and Frommel (2011) indicate further that fish, in their egg and larval life stages, are seriously threatened by ocean acidification. This, in addition to warming seawater, overfishing, pollution and eutrification (dead zones), causes fish to lose habitat and is threatening major fish stock collapse.

Without action, this situation can only be expected to deteriorate further, while ocean acidification is irreversible on timescales of at least tens of thousands of years. This means that, to save many marine species from extinction, geoengineering must be accepted as an essential part of the much-needed comprehensive plan of action.

Similarly, Arctic waters will continue to be exposed to warm water, causing further sea ice decline unless comprehensive action is taken that includes geoengineering methods to cool the Arctic. The image below shows the dramatic drop in sea ice extent (total area of at least 15% ice concentration) over the past 7 years, compared to the average 1972-2011, as calculated by the Polar View team at the University of Bremen, Germany. This illustrates that a firm commitment to a comprehensive plan of action can now no longer be postponed.