Showing posts with label Baffin Bay. Show all posts

Sunday, December 15, 2013

Methane emerges from warmer areas

As the year draws to a close, it's time to review where warming has occured most strongly in 2013. Surface temperature anomalies in November 2013 were 0.77°C, the highest global November anomalies on record. In November 2013, high temperature anomalies occurred in the Arctic, well over 9°C north and south of Novaya Zemlya.

Indeed, global warming is hitting the Arctic particularly hard, and some models have underestimated the pace at which this is occuring. Most heat goes into the oceans, which - due to the Gulf Stream - contributes to accelerated warming in the Arctic, where also less monitoring takes place than over land. Stefan Rahmstorf, Co-Chair of Earth System Analysis at the Potsdam Institute for Climate Impact Research, says at RealClimate:
new study by British and Canadian researchers shows that the global temperature rise of the past 15 years has been greatly underestimated. The reason is the data gaps in the weather station network, especially in the Arctic. If you fill these data gaps using satellite measurements, the warming trend is more than doubled in the widely used HadCRUT4 data.
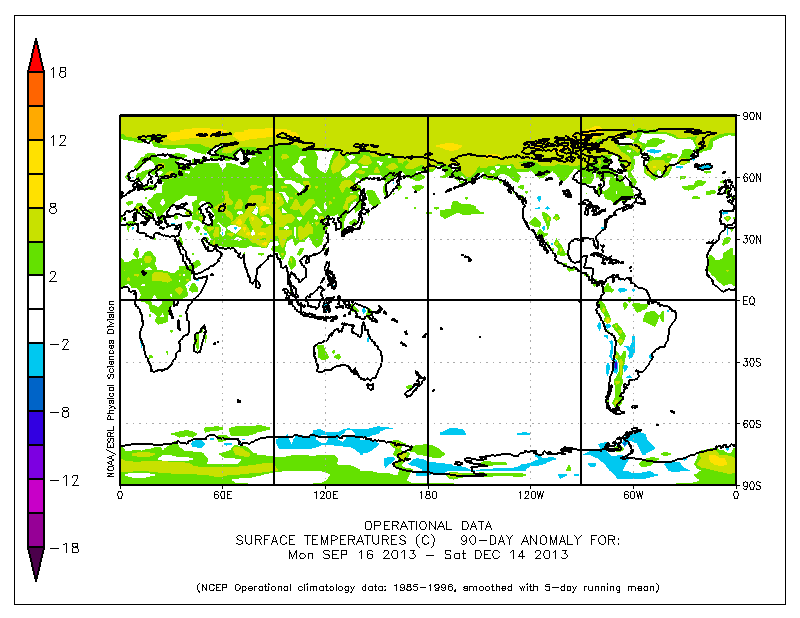
Where did warming occur most strongly in 2013? The red/orange areas on the image below shows surface temperature anomalies of more than 2°C for the year from December 13, 2012, to December 12, 2012.


As the image shows, temperature anomalies have hit Earth most strongly in the cryosphere, i.e.
- in Antarctica, as discussed at this post;
- on the Qinghai-Tibetan Plateau, as earlier discussed at this post;
- in the Arctic, as discussed below.

Over the past 90 days, the Arctic Ocean has shown surface temperature anomalies of over 5°C and in some spots over 8°C.


Looking at anomalies over longer periods can mask the occurrence of much higher anomalies on individual days. As an example, temperature anomalies of over 20°C were recorded over a large part of the Arctic Ocean on November 17, 2013. 


Baffin Bay, west of Greenland, has until now received little attention. High temperature anomalies over the past year show up on the top image. These high temperatures are the more striking given that a cold sea current runs through Baffin Bay, as shown on the image below. 
Methane has emerged strongly from areas that have warmed most in 2013. In August 2013, high concentrations of methane showed up over Siberia. High methane releases have further occurred in all three parts of the cryosphere mentioned above, i.e. from the heights of Antarctica, as discussed at this post, on the Qinghai-Tibetan Plateau, as earlier discussed at this post, and in the Arctic, as discussed in many posts at the Arctic-news blog.

Huge methane concentrations have featured over Baffin Bay recently. The animation below shows huge methane emissions emerging from Baffin Bay on December 1-2, 2013. The power behind these methane releases is strong enough to make it difficult for thicker ice to form in Baffin Bay. The animation below shows an area marked by a red rectangle where it looks like the water would have been covered with thicker ice, had there not been so much methane bubbling up in the area.


This area with very thin ice in Baffin Bay is further illustrated in the Naval Research Laboratory 30-day Arctic sea ice thickness animation below.


This constitues yet another feedback, i.e. methane bubbling up from the seafloor of the Arctic Ocean with a force strong enough to prevent sea ice from forming in the area. 


Thursday, November 21, 2013

High Methane Levels all over Arctic Ocean

High levels of methane were recorded all over the Arctic Ocean on November 19, 2013, as illustrated by the image below. The image also shows that most methane was present over the fault line that crosses the Arctic Ocean (as also indicated on the inset).

[ Click on image to enlarge ]
A recent post described that more methane may actually be present closer to the North Pole than IASA images may indicate. This because measurements can be obscured by clouds. If no data are recorded over a certain area, no methane levels will show up on images for the respective area. This was the case on November 17, 2013, when the Arctic Ocean was quite cloudy, and little or no data were recorded for the center of the Arctic Ocean.

On November 19, 2013, the sky was much clearer, resulting in a lot of data from the center of the Arctic Ocean, as also illustrated by the image below.

In conclusion, high methane levels can actually be present all over the Arctic Ocean, even when images only show high levels in some areas.

An earlier post described how the sea ice can act as a shield, especially when the ice is more than one meter thick.

How does this rhyme with the above image? The November 19, 2013, Naval Research Laboratory image on the right shows that the sea ice was meters thick in some locations where methane shows up on the top image.

So, is methane actually rising from the seafloor of the entire Arctic Ocean, perforating even the thickest ice and entering the atmosphere all across the Arctic Ocean? Or, if thick sea ice does act as a shield, how did methane appear all over the Artic Ocean in such huge quantities?

The images on the right indicate that the methane may actually only rise from the seafloor in a few locations.

As the top image on the right says, the Coriolis Effect can make methane over the Laptev Sea end up over Canada a few days later. So, methane may not be perforating the sea ice in the north of Canada, but may instead originate from elsewhere in the Arctic.

The animation underneath shows methane readings from November 9 to 19, 2013, with each of the 20 frames covering a period of 24 hours and with frames following each other up 12 hours after each other. As the animation shows, it looks like methane is predominantly entering the atmosphere at specific locations, most notably along the fault line that crosses the Arctic Ocean.

It may well be that this methane ends up all the way in Baffin Bay, to the left of Greenland. Since the Greenland ice sheet is 3 kilometers (1.9 miles) thick, this may form a natural barrier that keeps the methane there, also helped by winds rising vertically from Baffin Bay to well above Greenland's mountains. Methane may also be traveling under the sea ice, all the way from the Gakkel Ridge and the Laptev Sea right to Baffin Bay.

On the other hand, it could also be that hydrates underneath the sea bed of Baffin Bay itself have become destabilized and that, since the ice over Baffin Bay is rather thin, methane has no problem perforating the ice and is entering the atmosphere there in huge quantities.

Either way, the end-conclusion is that the methane that is now showing up all over the Arctic Ocean, is rising from the seafloor, due to destabilization of sediments that hold huge amounts of methane in the form of free gas and hydrates. As warming in the Arctic continues to accelerate, the danger is that this will cause more methane to rise from the seafloor and that the methane itself will contribute to warming in the Arctic, in a deadly spiral set to cause abrupt climate change at a devastating scale.


Saturday, November 16, 2013

More Methane as Sea Ice thins

The image below shows methane readings of 1950 ppb and higher, as at November 15, 2013, p.m., close to sea level. The image also shows sea ice concentration, as at November 7, 2013, i.e. the most recent SSMIS data available on methanetracker.

[ click on image to enlarge ]
The image shows huge amounts of methane rising from the seafloor along the fault line that crosses the Arctic Ocean. The image also shows huge amounts of methane over thinner parts of the sea ice. To illustrate this further, the November 15, 2013, Naval Research Laboratory image is added below, showing ice thickness based on the most recent sea ice data.


The image below zooms in on the large amounts of methane, stretching out all the way from the Beaufort Sea to Baffin Bay.

[ click on image to enlarge ]
Above image illustrates that methane does show up prominently where the sea ice is thin, confirming earlier conclusions that the sea ice acts as a shield, a seal if you like, holding the methane in place and thus giving microbes the time needed to decompose the methane while it is held underneath the ice.

This spells bad news, because it implies that, as the sea ice thins, more methane will be able to enter the atmosphere and contribute to warming that is already accelerating in the Arctic.

As discussed in a recent post, methane is rising from the seafloor of the Arctic Ocean due to destabilization of sediments that hold huge amounts of methane in the form of free gas and hydrates. This destabilization is in part due to warm water flowing in the Arctic Ocean along the Gulf Stream. Record warm water was present off the coast of North America in July 2013, and this warm water took some time to reach the Arctic Ocean, as shown on the image below, from that earlier post.


Water in the currents that are returning water to the Atlantic Ocean north of Canada is typically cold, as indicated by the blue color on the image below. So, while it is possible that the water was still sufficiently warm to cause methane releases from the seabed in the Beafort Sea and in Baffin Bay, in the northern parts of Canada, it seems more likely that the methane originated from areas along the fault line that crosses the Arctic Ocean and that the methane traveled - underneath the sea ice - with these currents all the way to the edges of the sea ice where the ice is sufficiently fractured and thin to allow methane to rise to the surface.

Image credit: Jack Cook, Woods Hole Oceanographic Institute
This seems confirmed by recent sea surface temperature data, as pictured below.


As above image shows, sea surface temperature anomalies (in orange, red and brown) are still showing up prominently along many parts of the Gulf Stream, all the way into the Arctic Ocean, where anomalies of more than 8 degrees Celcius have been recorded for some time now. At the same time, colder water (in green and blue) is flowing back into the Atlantic Ocean from the Arctic Ocean, along the edges of Greenland and further south. Colder currents typically flow at greater depth, but the above image also shows colder waters emerging at sea surface level, especially in areas somewhat off the coasts of Newfoundland and Nova Scotia, effectively preventing some warm water from traveling along the Gulf Stream to the Arctic Ocean.

Why are the currents that are flowing out of the Arctic Ocean into the Atlantic Ocean so strong at the moment? Powerful winds have speeded up these currents, as illustrated by the 30-days Naval Research Laboratory animation below, which also includes a 7-days forecast from November 15, 2013.


One of the feedbacks of accelerated warming in the Arctic is stronger winds and a huge amount of sea ice is currently flowing into the Atlantic Ocean, partly due to these strong winds. Similarly, the Naval Research Laboratory animation below shows huge amounts of sea ice, often very thick ice, being pushed into the Atlantic Ocean.


Last but not least, the youtube video below, Arctic Death Spiral and the Methane Time Bomb, shows some of the most powerful video footage on climate change, highlighting the danger that methane will continue to rise from the seafloor of the Arctic Ocean in ever greater quantities, resulting in a wipe-out of civilization, extinctions at massive scale and devastation of the planet as we know it.


Monday, March 18, 2013

Huge patches of warm air over the Arctic

Over the past month or so, huge patches with temperature anomalies of over 20 degrees Celsius have been forming over the Arctic.

The three images below show such patches stretch out from Svalbard to Novaya Zemlya (top), north of Eastern Siberia (middle) and over West Greenland and Baffin Bay (bottom).


How these patches with warm air developed is further illustrated by the animation below, which goes from February 12, 2013, to March 18, 2013.