Additional albedo loss occurs due to thawing of permafrost and retreat of glaciers, and - as said - due to loss of lower clouds as temperatures rise.
6. Latent heat buffer loss - as sea ice, permafrost and glaciers disappear.
Latent heat is energy associated with a phase change, such as the energy consumed when ice turns into water. During a phase change, the temperature remains constant. As long as there is ice, additional heat will be absorbed by the process of ice turning into water, so the temperature doesn't rise at the surface.
The amount of energy absorbed by melting ice is as much as it takes to heat an equivalent mass of water from zero to 80°C. The energy required to melt a volume of ice can raise the temperature of the same volume of rock by as much as 150ºC.
Warmer water flowing into the Arctic Ocean causes Arctic sea ice to lose thickness and thus volume, diminishing its capacity to act as a buffer that consumes ocean heat entering the Arctic Ocean from the North Atlantic. This means that - as sea ice thickness decreases - a lot of incoming ocean heat can no longer be consumed by melting the sea ice from below, and the heat will therefore contribute to higher temperatures of the water of the Arctic Ocean. Similarly, there is a point beyond which thawing of permafrost on land and melting of glaciers can no longer consume heat, and all further heat will instead warm up the surface.
 |
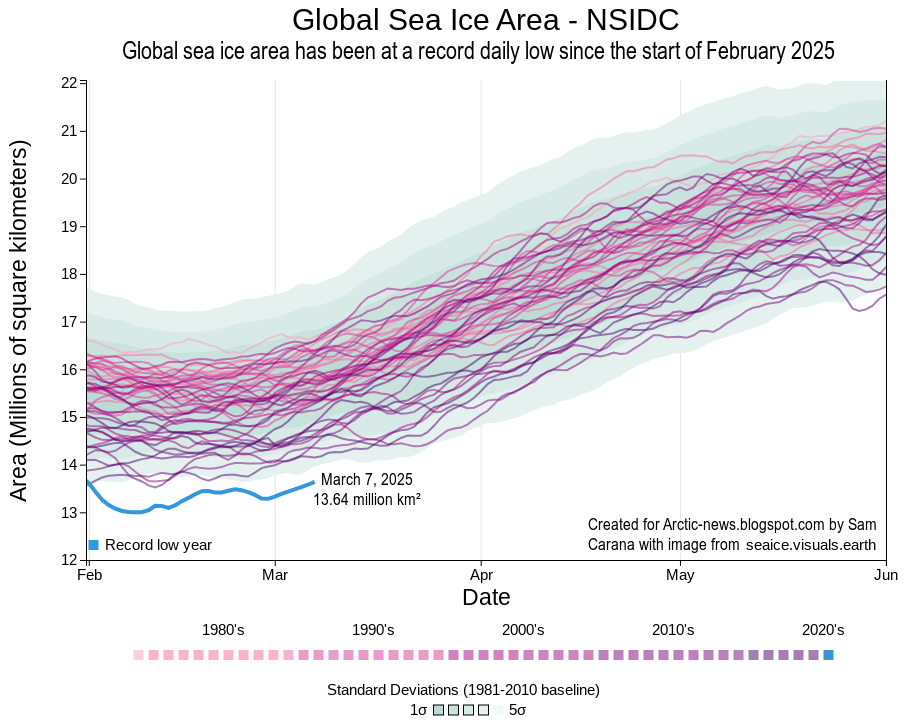
| [ Arctic sea ice volume, click to enlarge ] |
The image on the right shows Arctic sea ice volume through March 3, 2025. The image shows that Arctic sea ice volume in 2024 and 2025 to date has been much lower than in previous years.
More incoming heat therefore threatens to reach the seafloor of the Arctic Ocean and destabilize methane hydrates contained in sediments at the seafloor, resulting in eruptions of huge amounts of methane, in turn threatening increased loss of permafrost, resulting in additional emissions.
The danger is especially large in the Arctic, which contains
huge amounts of methane and which is hit most strongly by the temperature rise, as illustrated by the image below.
7. Increase in concentrations of greenhouse gases in the atmosphere - carbon dioxide (CO₂), methane (CH₄), nitrous oxide (N₂O), water vapor (H₂O), tropospheric ozone (O₃) and fluorinated gases (HFCs, PFCs, SF₆ and NF₃).
Methane in the atmosphere could be doubled by 2026 if a trend unfolds as depicted in the image below. A rapid rise is highlighted in the inset and reflected in the trend. The trend is based on January 2023-October 2024 data.
 |
| [ click on images to enlarge ] |
A rise like the one depicted in the trend could eventuate as rising ocean heat destabilizes methane hydrates contained in sediments at the seafloor of the Arctic Ocean. The temperature rise in the Arctic would accelerate since the methane would initially have a huge impact over the Arctic and cause depletion of hydroxyl, of which there is very little in the atmosphere over the Arctic in the first place. Such a rise in methane would also dramatically increase concentrations of ozone in the troposphere and concentrations of water vapor in the stratosphere.
Carbon dioxide is rising rapidly. The mean annual carbon dioxide was 424.61 ppm in 2024, an increase of 3.53 ppm compared to 2023 and the highest annual growth on record. This record high growth rate indicates that emissions of carbon dioxide are increasing while carbon sinks are weakening at the same time.
The above image shows a trend, based on 2015-2024 annual data, pointing at 1200 ppm CO₂ getting crossed in the year 2032, illustrating that the
clouds tipping point could get crossed in 2032 due to rising CO₂ alone. Crossing this tipping point could on its own increase temperatures by an additional 8°C. Since the clouds tipping point is at 1200 ppm CO₂e, the tipping point could be crossed much earlier than in 2032, potentially in 2026, when growth of other greenhouse gases and further mechanisms are taken into account.
The rise in water vapor in the atmosphere is also higher if the temperature rise from
pre-industrial turns out to be higher than what many until now have suggested.
The above image illustrates that the February 2024 temperature was potentially 2.75°C above pre-industrial. A much higher rise from
pre-industrial than the rise mentioned in the IPCC assessment reports would come with much more water vapor in the atmosphere. A 2.75°C rise corresponds with almost ⅕ more water vapor in the atmosphere, since
7% more water vapor will be in the atmosphere for every 1°C warming. Extra water vapor will further amplify the temperature rise, since water vapor is a potent greenhouse gas.
As illustrated by the above image, high precipitable water anomalies can occur over the Arctic Ocean.
8. Ocean changes - it becomes increasingly hard for ocean heat to reach deeper parts of the ocean, due to stratification and due to changes in ocean currents, resulting in more heat accumulating at the surface instead.
Furthermore, slowdown of the Atlantic and Southern Meridional Overturning Circulation and increased stratification lead to depletion of nutrients (in particular phosphorus) in the ocean's top layer, in turn decreasing phytoplankton growth and thus decreasing oxygen production and carbon sequestration, as a
recent study confirms.
Additionally, deoxygenation occurs
as temperatures rise, since warm water holds less oxygen than cold water. Oxygen is needed for
methanotroph bacteria to oxidize methane that is rising up from the seafloor, so less oxygen also increases methane entering the atmosphere.
9. More emissions from the environment - as sinks turn into sources, and as there are more emissions from methane hydrate eruptions, from thawing permafrost, from flooded areas, and from fires (including fires in forests, peatland, grassland, urban waste in backyards and landfills, and fires in buildings - especially warehouses that contain flammable materials, chemicals and fluorinated gases), as temperatures keep rising.
10. More emissions from human action and inaction - as more people start to realize how dire the situation is and as they seek to occupy the most habitable areas left.
A
recent analysis estimates that just the emissions from the war in Ukraine since Russia’s full-scale invasion rival the annual emissions of four European nations combined (i.e. Austria, Hungary, Czech Republic and Slovakia). More emissions may also result from more biofuel and wood getting burned in vehicles, heaters and power plants, as it becomes harder to obtain fossil fuel and as the grid shuts down, due to conflicts and people no longer showing up for work.
How do these ten mechanisms add up? A rise potentially exceeding 18°C by 2026?
Ominously, very high temperature anomalies are forecast over the Arctic Ocean for November 2025.
 |
| [ Very high temperature anomalies forecast over Arctic Ocean, from earlier post ] |
The stacked bar chart on the right includes (at the bottom) a potential 2.29°C for the rise in temperature from pre-industrial to 2020.
A rise of 0.5°C is included for the additional CO₂ released through 2026 and for the rising impact of the recently emitted CO₂. Note that the chart was first conceived in 2016, so much of the impact of the CO₂ released from 2016 to today has meanwhile already eventuated.
Changes in aerosols are given the potential for a 1.9°C rise due to reductions in cooling aerosols (mainly sulfate), while a 0.6°C rise is included due to additional warming gases and aerosols.
In the bar chart, a potential rise of 1.6°C is reached by the end of 2026 as a result of snow and ice loss and changes in wind patterns and ocean currents.
An additional 1.1°C is reached as a result of eruption of methane from the seafloor, while additional greenhouse gas emissions result in a 0.35°C rise.
The temperature rise itself triggers further feedbacks such as an increase of water vapor in the atmosphere (2.1°C) and loss of lower clouds (8°C). Altogether, the rise could reach 18.44°C by the end of 2026.
Will events unfold exactly like this?
Those who question whether these mechanisms will jointly cause a temperature rise of more or less than 18°C do miss the point. As the likeliness of a huge and accelerating temperature rise, the severity of its impact, and the ubiquity and the imminence with which it will strike all become more manifest—the more sobering it is to realize that a mere 3°C rise may suffice to cause human extinction.
Climate Emergency Declaration
The situation is dire and the precautionary principle calls for rapid, comprehensive and effective action to reduce the damage and to improve the situation, as described in
this 2022 post, where needed in combination with a Climate Emergency Declaration, as discussed at
this group.
Links
• Copernicus
https://climate.copernicus.eu
• Berkeley Earth - Global Temperature Report for 2024
• Did a Terminal Temperature Acceleration Event start in December 2024?
• Did the climate experience a Regime Change in 2023?
• Sea ice loss
https://arctic-news.blogspot.com/2025/02/sea-ice-loss.html• Kevin Pluck - seaice.visuals.earth
https://seaice.visuals.earth• NSIDC (National Snow and Ice Data Center) - Arctic sea ice extent
https://nsidc.org/sea-ice-today/sea-ice-tools/charctic-interactive-sea-ice-graph
• Sunspots
https://arctic-news.blogspot.com/p/sunspots.html
• Albedo, latent heat, insolation and more
https://arctic-news.blogspot.com/p/albedo.html
• Pre-industrial
https://arctic-news.blogspot.com/p/pre-industrial.html
• Extinction
https://arctic-news.blogspot.com/p/extinction.html
• Cold freshwater lid on North Atlantic
https://arctic-news.blogspot.com/p/cold-freshwater-lid-on-north-atlantic.html
• Oxygenating the Arctic
• Danish Meteorological Institute - Arctic sea ice volume and thickness
https://ocean.dmi.dk/arctic/icethickness/thk.uk.php
• Arctic and Antarctic Data Archive System (ADS) of the National Institute of Polar Research of Japan
https://ads.nipr.ac.jp
• Climate Reanalyzer
https://climatereanalyzer.org
• Forest fires push up greenhouse gas emissions from war in Ukraine
• Climate damage caused by Russia's war in Ukraine in three years – the key numbers
• Tropical Tidbits
https://www.tropicaltidbits.com
• Transforming Society
https://arctic-news.blogspot.com/2022/10/transforming-society.html
• Climate Plan
https://arctic-news.blogspot.com/p/climateplan.html
• Climate Emergency Declaration
https://arctic-news.blogspot.com/p/climate-emergency-declaration.html