The image below shows the June 2025 temperature anomaly versus 1951-1980, using ERA5 data.
 |
| [ June 2025 temperature anomaly, click on images to enlarge ] |
 |
| [ from earlier post, click to enlarge ] |
The above image shows relatively low anomalies over the Arctic Ocean, with a relatively cool area persisting in the North Atlantic, south of Greenland. This appears to reflect heavy melting, slowing down of the Atlantic Meridional Overturning Circulation (AMOC) and strong evaporation followed by more rainfall further down the track of the Gulf Stream, as illustrated by the image on the right.
The above image also shows high anomalies over parts of Antarctica and Antarctic sea ice. This appears to reflect changes to the Southern Meridional Overturning Circulation (SMOC).
Rising temperatures result in a loss of carbon storage, concludes a recent study led by Thomas Werner into marine heatwaves.
 |
| [ marine heatwave in North Pacific ] |
 |
| [ image from: 10°C or 18°F warmer by 2021? ] |
Covering more than 70% of Earth’s surface, our global ocean has absorbed 90% of the warming that has occurred in recent decades due to increasing greenhouse gases, and the top few meters of the ocean store as much heat as Earth's entire atmosphere, as described by a NASA post.
A small reduction in the 90% uptake of heat by oceans could result in a huge rise in the global air temperature, and studies warn about changes that are occurring in the AMOC and SMOC, as discussed in earlier posts such as this one. Such feedbacks could strike hard very rapidly, i.e. as fast feedbacks.
The IPCC (AR6 WG1 SPM page 11) uses an equilibrium climate sensitivity of 3°C, but James Hansen says fast-feedback equilibrium climate sensitivity is 4.8°C and equilibrium global warming for today’s amount of greenhouse gases (4.1 W/m²) is 10°C, which includes a 2°C rise that would eventuate by the falling away of the aerosols that currently mask the temperature rise.
A 2024 study led by Judd finds that climate sensitivity has historically been about 8°C.
 |
| [ Temperature rise vs 1901-2000 (ClimateReanalyzer) and vs 1850-1900 (IPCC, inset left) ] |
The IPCC appears to be downplaying the temperature rise in multiple ways, including by using linear trends, a late baseline and a low climate sensitivity, to give the false impression that polluters could continue to pollute for decades to come.


The 36-month running average for albedo (reflectivity) for May 2025 is down to a record low of 28.711%, as illustrated by the above Eliot Jacobson image.

The 36-month running mean for the Earth energy imbalance grew in May 2025 to 11.36 Hiroshimas per second. That's roughly 980,000 Hiroshimas per day in planetary warming, adds Eliot Jacobson.
As said, the IPCC keeps downplaying the potential impact of feedbacks such as changes to ocean currents, wind patterns, clouds and water vapor, and loss of sea ice and permafrost, thus failing to warn people about a near-future in which temperatures could rise strongly due to such feedbacks, especially during an El Niño, and due to further reduction of the aerosol masking effect, developments that could rapidly speed up existing feedbacks and trigger new feedbacks, resulting in more extreme weather events striking with a ferocity, frequency and ubiquity that keeps increasing at an accelerating pace.
 |
| [ NOAA ENSO outlook ] |
The updated ENSO outlook (CFSv2 ensemble mean, black dashed line, image on the right, adapted from NOAA) favors borderline La Niña during the Northern Hemisphere fall and early winter 2025-2026.
The image below illustrates the outlook of borderline La Niña for the Northern Hemisphere fall and early winter 2025-2026. On July 29, 2025, the average temperature in Niño 3.4, an area in the Pacific that is indicative for El Niño development (inset), had fallen to 26.7°C, an anomaly of -0.35°C from 1991-2020.

The current ENSO conditions make it even more significant that on July 14, 2025, the global temperature was 16.86°C, i.e. higher than the temperature was in 2023 or 2024 on this day, as illustrated by the image below, adapted from Climate Reanalyzer.

The earlier image below shows a preliminary 16.85°C that was later upgraded to 16.86°C (final). The point is that this is a record high for that day and 0.3°C below the highest daily temperature on record (17.16°C) that was reached on July 22, 2024 (image adapted from Copernicus).

The image below shows monthly temperature anomalies through June 2025, based on ERA5 anomalies vs 1951-1980 from Jan 2014-June 2025 (red circles).

In the above image, data are adjusted by 1°C to reflect a pre-industrial base (black circles). Cubic trends are added to show that 3°C could be crossed late 2028 (red) or early 2027 (black).
The image below shows surface air temperature anomalies April 1, 2023, through July 14, 2025 (final), with a red trend added that warns about a potentially huge temperature rise later in 2025.

Furthermore, sea surface temperatures are on the rise again. The image below shows the global sea surface temperature through July 20, 2025 (60°S–60°N, 0–360°E).

How much could temperatures rise? The image below is a combination image. The top image shows a trend based on annual sea surface temperature anomalies in the Northern Hemisphere through 2022. The bottom image shows a trend based on annual sea surface temperature anomalies in the Northern Hemisphere through 2023. The trend in the bottom image shows an even steeper rise than the trend in the top image. This shows that a polynomial trend can sometimes be a good indicator of the rise to come.

The current ENSO conditions also make it even more significant that the global sea ice area anomaly was 2.56 million km² below the 1981-2010 mean on July 30, 2025, a standard deviation of -4.33σ from 1981-2010.


Arctic sea ice volume was at a record daily low on August 3, 2025, as it has been for more than a year, as illustrated by the image below.

The image below shows Arctic sea ice concentration on August 3, 2025.

As the temperature of the water of the Arctic Ocean rises, more ocean heat can penetrate sediments at the seafloor of the Arctic Ocean, which can destabilize methane hydrates contained in these sediments and cause eruptions of huge amounts of methane from the hydrates and from free gas kept underneath these hydrates.
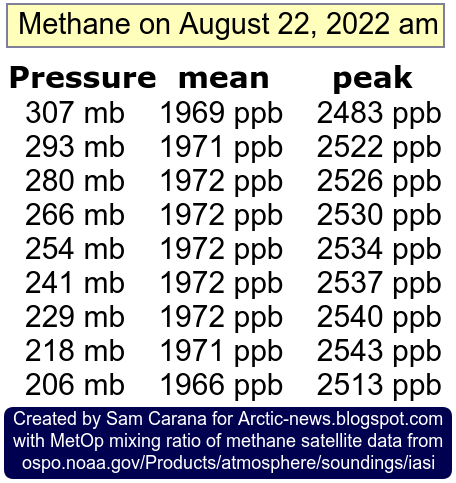
The image below shows that methane concentrations as high as 2535 parts per billion (ppb) were recorded at a pressure level of 695.1 mb by the NOAA 20 satellite on July 30, 2025 AM. High concentrations of methane show up at latitudes higher than 30°N.

The image below shows hourly methane measurements taken at the Barrow Atmospheric Baseline Observatory (BRW), a NOAA facility located near Utqiaġvik (formerly Barrow), Alaska, at 71.32 degrees North.

The image below repeats the IPCC's response, or rather its failure to respond.

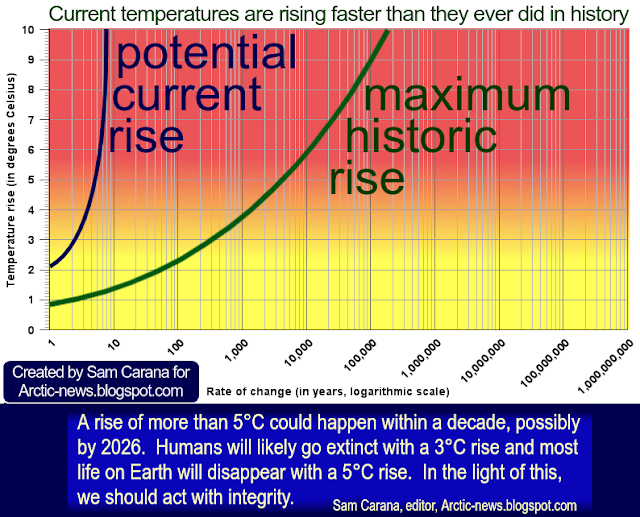
A 3°C rise constitutes an important threshold, since humans will likely go extinct with such a rise. As illustrated by the image below, we may already be more than 2°C above pre-industrial and face a potentially huge temperature rise over the next few years.
 |
| [ from the post When will humans go extinct? ] |
 |
| [ from: When Will We Die? ] |
Recent research led by David Fastivich finds that, historically, vegetation responded at timescales from hundreds to tens of thousands of years, but not at timescales shorter than about 150 years. It takes centuries for tree populations to adapt - far too slow to keep pace with today’s rapidly warming world.
Note that vegetation depends on the presence of a lot of things including healthy soil, microbes, moisture, nutrients and habitat.
A 2018 study by Strona & Bradshaw indicates that most life on Earth will disappear with a 5°C rise (see box on the right). Humans, who depend on a lot of other species, will likely go extinct with a 3°C, as discussed in the earlier post When Will We Die?
Climate Emergency Declaration
The situation is dire and the precautionary principle calls for rapid, comprehensive and effective action to reduce the damage and to improve the situation, as described in this 2022 post, where needed in combination with a Climate Emergency Declaration, as discussed at this group.

Links
• Climate Reanalyzer
https://climatereanalyzer.org
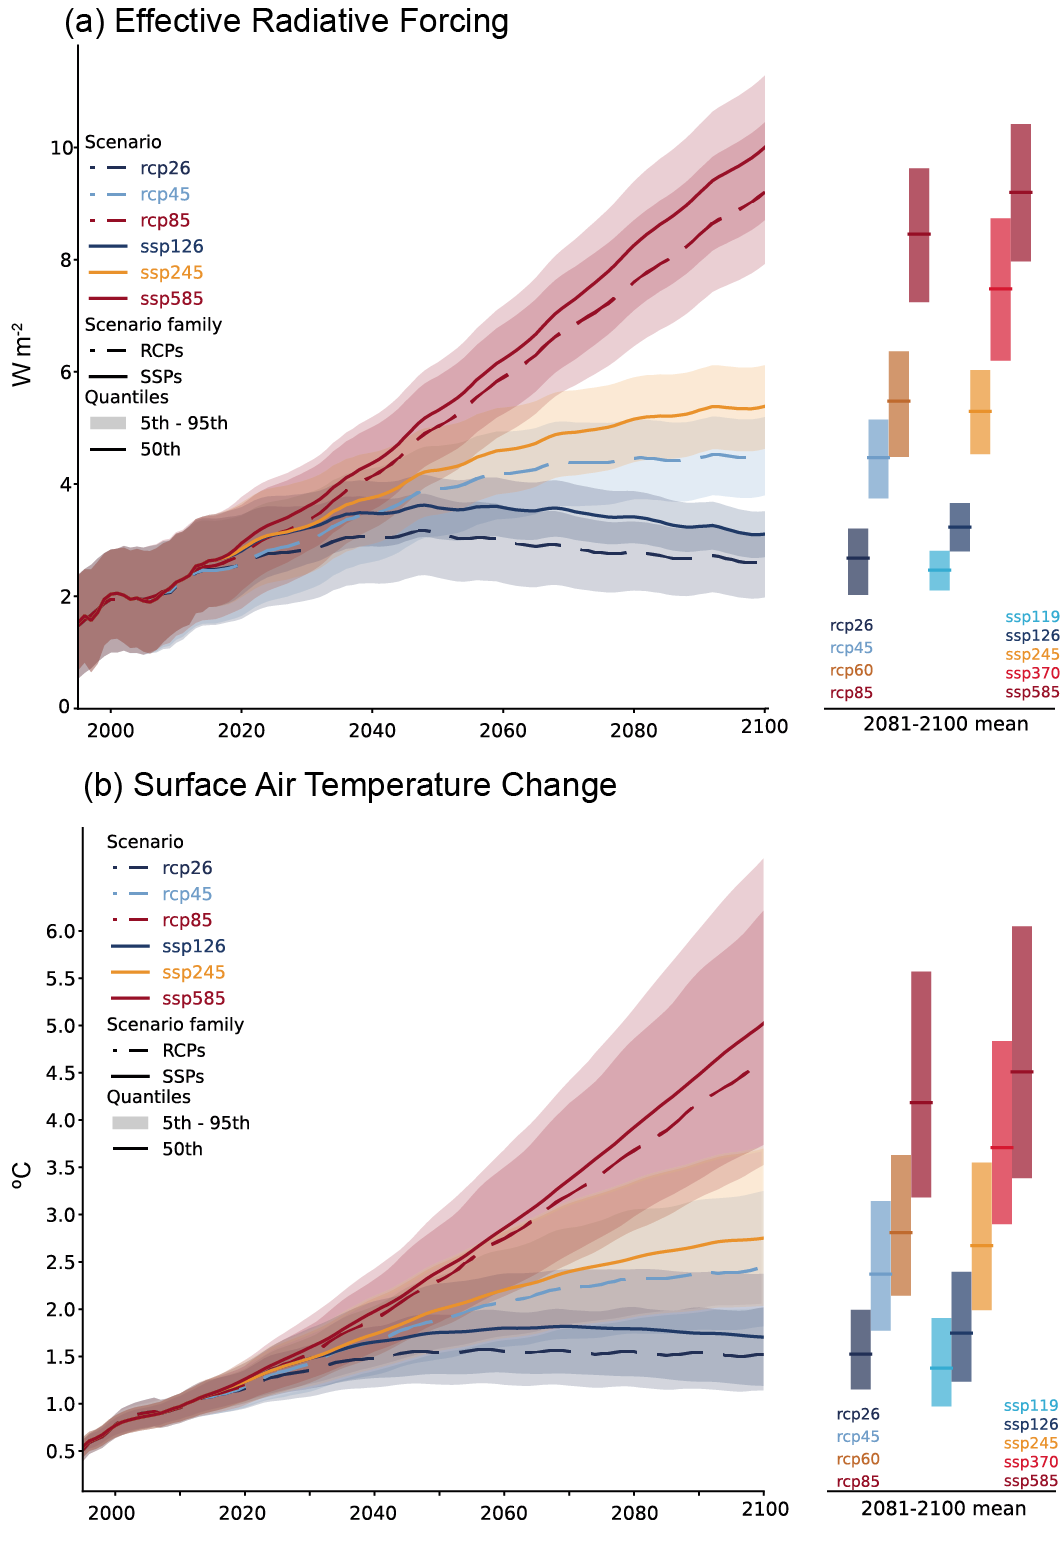
• IPCC AR6 WG1 Figure 4.35 | Comparison of RCPs and SSPs
https://www.ipcc.ch/report/ar6/wg1/downloads/figures/IPCC_AR6_WGI_Figure_4_35.png
https://www.ipcc.ch/report/ar6/wg1/figures/chapter-4/figure-4-35
• Saltier water, less sea ice
https://arctic-news.blogspot.com/2025/07/saltier-water-less-sea-ice.html
• Nullschool.net
https://earth.nullschool.net
• Marine heatwaves as hot spots of climate change and impacts on biodiversity and ecosystem services - by Thomas Wernberg et al.
discussed on Facebook at:
https://www.facebook.com/groups/arcticnews/posts/10162992131044679
• Copernicus
https://pulse.climate.copernicus.eu
• NASA - Ocean warming (December 2024)
https://climate.nasa.gov/vital-signs/ocean-warming/?intent=121
• Arctic Blue Ocean Event 2025? (update June 2025)
https://www.facebook.com/groups/arcticnews/posts/10162992131044679
• Copernicus
https://pulse.climate.copernicus.eu
• NASA - Ocean warming (December 2024)
https://climate.nasa.gov/vital-signs/ocean-warming/?intent=121
• Arctic Blue Ocean Event 2025? (update June 2025)
https://arctic-news.blogspot.com/2025/06/arctic-blue-ocean-event-2025-update-June-2025.html
• A 485-million-year history of Earth’s surface temperature - by Emily Judd et al. (2024)
https://www.science.org/doi/10.1126/science.adk3705
• A 485-million-year history of Earth’s surface temperature - by Emily Judd et al. (2024)
https://www.science.org/doi/10.1126/science.adk3705
discussed on Facebook at:
https://www.facebook.com/groups/arcticnews/posts/10161741588279679
• Global warming in the pipeline - by James Hansen et al.
https://academic.oup.com/oocc/article/3/1/kgad008/7335889
https://www.facebook.com/groups/arcticnews/posts/10161741588279679
• Global warming in the pipeline - by James Hansen et al.
https://academic.oup.com/oocc/article/3/1/kgad008/7335889
discussed on Facebook at:
https://www.facebook.com/groups/arcticnews/posts/10161110558744679
• Pre-industrial
https://arctic-news.blogspot.com/p/pre-industrial.html
• NOAA - Climate Prediction Center - ENSO: Recent Evolution, Current Status and Predictions
https://www.cpc.ncep.noaa.gov/products/analysis_monitoring/lanina/enso_evolution-status-fcsts-web.pdf
• Coupled, decoupled, and abrupt responses of vegetation to climate across timescales - by David Fastovich et al. (2025)
• Danish Meteorological Institute - sea ice thickness and volume
• University of Bremen
https://seaice.uni-bremen.de/start
• Kevin Pluck - sea ice visuals
https://seaice.visuals.earth
• NOAA - satellite methane measurements
https://www.ospo.noaa.gov/products/atmosphere/soundings/heap/nucaps/new/nucaps_products.html
• NOAA - flask and station methane measurements
https://gml.noaa.gov/dv/iadv/index.php
• Transforming Society
https://arctic-news.blogspot.com/2022/10/transforming-society.html
• Climate Plan
https://arctic-news.blogspot.com/p/climateplan.html
• Climate Emergency Declaration
https://arctic-news.blogspot.com/p/climate-emergency-declaration.html
https://www.facebook.com/groups/arcticnews/posts/10161110558744679
• Pre-industrial
https://arctic-news.blogspot.com/p/pre-industrial.html
• NOAA - Climate Prediction Center - ENSO: Recent Evolution, Current Status and Predictions
https://www.cpc.ncep.noaa.gov/products/analysis_monitoring/lanina/enso_evolution-status-fcsts-web.pdf
• When will humans go extinct?
discussed on Facebook at:
• Danish Meteorological Institute - sea ice thickness and volume
• University of Bremen
https://seaice.uni-bremen.de/start
• Kevin Pluck - sea ice visuals
https://seaice.visuals.earth
• NOAA - satellite methane measurements
https://www.ospo.noaa.gov/products/atmosphere/soundings/heap/nucaps/new/nucaps_products.html
• NOAA - flask and station methane measurements
https://gml.noaa.gov/dv/iadv/index.php
• When Will We Die?
https://arctic-news.blogspot.com/2022/10/transforming-society.html
• Climate Plan
https://arctic-news.blogspot.com/p/climateplan.html
• Climate Emergency Declaration
https://arctic-news.blogspot.com/p/climate-emergency-declaration.html


