Showing posts with label Laptev Sea. Show all posts

Monday, June 24, 2024

How hot will it get?

Temperatures as high as 125°F or 51.67°C are forecast to hit California on July 6, 2024, as illustrated by the image below, adapted from Climate Reanalyzer by the University of Maine.


On June 23, 2024, the temperature in the Northern Hemisphere was higher than it was last year at this time of year, as illustrated by the image below, created with University of Maine content. The image shows that a temperature of 21.5°C was reached in the Northern Hemisphere on June 23, 2024. The question is: Will temperatures over the next few months exceed the high temperatures reached last year? 


El Niño is no longer prevalent and La Niña conditions are expected to be dominant soon, as illustrated by the NOAA ENSO update on the right, from an earlier post.

Nonetheless, there are fears that temperatures will remain high and continue to rise, as self-amplifying feedbacks have taken over as the dominant drivers of the temperature rise. This was discussed earlier, in recent posts such as this one and this one.

There are numerous feedbacks that can further accelerate the temperature rise. Higher temperatures come with more water vapor in the atmosphere, an important feedback since water vapor is also a potent greenhouse gas.

Surface precipitable water reached a record high of 27.139 kg/m² in July 2023, as illustrated by the image below, adapted from NOAA, from an earlier post. Worryingly, a value of 26.138 kg/m² was reached in May 2024, much higher than the 25.378 kg/m² in May 2023, which raises fears that surface precipitable water will reach an even higher peak in 2024 than was reached in 2023.


Rising temperatures speed up the decline of sea ice and permafrost, which can in turn result in huge emissions of carbon dioxide, methane and nitrous oxide.

The decline of permafrost results in more meltwater that speeds up the flow of rivers. The image on the right shows sea surface temperatures as high as 18.3°C in the Bering Strait on June 29, 2024.

Deformation of the Jet Stream is another important feedback and it particularly affects the Northern Hemisphere where the Arctic heats up more rapidly than the rest of the world, thus narrowing the temperature difference between the Tropics and the Arctic, which changes the shape of the Jet Stream.

The Jet Stream will meander more and can at times even form circular wind patterns in some areas, which can strongly amplify extreme weather events such as storms that come with flooding and heatwaves that come with forest fires on land.

On land, more extreme weather can cause strong rainfall, resulting in more water running off into the Arctic Ocean. As heatwaves cause the water of rivers to heat up, a lot more heat can enter the Arctic Ocean.

Heatwaves and increased lightning can also cause fires that result in emissions and cause black carbon to settle on ice, causing temperature rise due to albedo loss and speeding up the thawing of permafrost and melting of sea ice. The image below, adapted from Copernicus, shows biomass burning aerosols, i.e. a forecast for June 29, 2024. 


Over oceans, the impact of deformation of the Jet Stream can be even larger, since wind tends to be stronger over oceans than over land. Near the ocean, the greater temperature difference between land and sea will result in stronger winds.

The image below shows sea surface temperatures in the Northern Hemisphere. Heavy melting occurs in the blue-colored areas. Where the sea ice has disappeared, red and yellow colors show up, indicating temperatures higher than they used to be at this time of year in the respective area. High anomalies result from the loss of the latent heat buffer that previously absorbed heat and from the albedo changes that result in more sunlight getting absorbed by the surface.


Furthermore, the image shows a deformed Jet Stream with many circular wind patterns (at 250 hPa) over the Arctic. Deformation of the Jet Stream contributes to these high temperatures, by enabling heatwaves to extend over the Arctic Ocean, increasing not only the intensity, but also the frequency, duration and areas covered by such events.

The above image shows sea surface temperatures as high as 8.2°C or 46.7°F (i.e. 4.5°C or 8.1°F higher than 1981-2011) in the Laptev Sea (at the green circle), illustrating how a deformed Jet Stream is moving hot air over the Arctic Ocean and is also heating up the water of the Lena River and accelerating the speed at which the water is flowing into the Arctic Ocean.

The image below shows sea surface temperatures as high as 15.4°C or 59.7°F (i.e. 14.9°C or 26.8°F higher than 1981-2011) in Hudson Bay (at the green circle), while a deformed Jet Stream is moving hot air from Siberia far over the Arctic Ocean.


[ click on images to enlarge ]
Deformation of the Jet Stream enables strong winds to develop over the North Atlantic, which can at times strongly accelerate the speed at which hot water is flowing toward the Arctic Ocean along path of the Gulf Stream.

A deformed Jet Stream can temporarily speed up this flow, causing huge amounts of ocean heat to get abruptly pushed into the Arctic Ocean in the path of the Gulf Stream.

The image on the right shows hot water getting pushed along the path of the Gulf Stream from the Gulf of Mexico toward the Arctic Ocean. The image shows sea surface temperatures as high as 32.3°C on June 22, 2024.

As Arctic temperatures keep rising, two tipping points threaten to get crossed as temperatures rise and Arctic sea ice disappears, i.e. the latent heat tipping point and the seafloor methane tipping point, as discussed in an earlier post

The combination image below, adapted from the University of Bremen, indicates that most of the thicker sea ice has melted in the course of June 2024, and that the latent heat buffer may be gone soon. 


As illustrated by the image below, adapted from IRI, La Niña may develop during July-September 2024. A combination of feedbacks and their interaction, including the water vapor feedback, deformation of the Jet Stream and loss of albedo and loss of the latent heat buffer, may cause a continuation of high temperatures even during this La Niña. A new El Niño may develop in 2025 and be prevalent in 2026. 

In other words, we may move into the next El Niño while the temperature rise keeps accelerating, while the masking effect of aerosols gets further reduced and while sunspots are moving toward a peak (in July 2025). 

Climate Emergency Declaration

The situation is dire and the precautionary principle calls for rapid, comprehensive and effective action to reduce the damage and to improve the situation, as described in this 2022 post, where needed in combination with a Climate Emergency Declaration, as discussed at this group.


Links

• Climate Reanalyzer
https://climatereanalyzer.org

• Arctic Sea Ice Alert

• Have feedbacks taken over?
https://arctic-news.blogspot.com/2024/06/have-feedbacks-taken-over.html

• Copernicus
https://atmosphere.copernicus.eu

• nullschool
https://earth.nullschool.net

• Feebacks in the Arctic
https://arctic-news.blogspot.com/p/feedbacks.html

• Jet Stream
https://arctic-news.blogspot.com/p/jet-stream.html
• University of Bremen - Arctic sea ice
https://seaice.uni-bremen.de/start

• Latent heat
https://arctic-news.blogspot.com/p/latent-heat.html

• Albedo
https://arctic-news.blogspot.com/p/albedo.html

• Two Tipping Points
https://arctic-news.blogspot.com/2023/08/two-tipping-points.html

• The International Research Institute for Climate and Society, Columbia University Climate School
https://iri.columbia.edu/our-expertise/climate/forecasts/enso/current/?enso_tab=enso-sst_table

• Sunspots
https://arctic-news.blogspot.com/p/sunspots.html

• Aerosols


Sunday, June 16, 2019

High Temperatures over the Arctic


Melt extent over Greenland was well over 40% on June 12, 2019.

The surface melt map that day (on the right) shows many coastal areas for which data are missing, as indicated by the grey color.

As the June 13, 2019, NASA Worldview satellite image (underneath, right) shows, snow and ice in many coastal areas has melted away.

Four nullschool images are added below. The first one shows air temperatures over Greenland as high as 22.7°C or 72.9°F on June 13, 2019, at 1000 mb. Also note the high temperatures visible over East Siberia and the East Siberian Arctic Shelf (ESAS).

A second nullschool image shows that a temperature of 0.9°C or 33.5°F was recorded at the North Pole on June 15, 2019. Temperatures above the melting point of ice have been recorded at the North Pole for some time now.

The third nullschool image shows that temperatures as high as 30.5°C or 86.8°F are forecast for June 19, 2019, near Tiksi, which is on the coast of Siberia where the Lena River flows into the Laptev Sea and the Arctic Ocean.

What causes this? As the Arctic is heating up faster than the rest of the world, the path of the jet stream is changing. On June 19, 2019, the jet stream is forecast to move from Siberia to the Laptev Sea at speeds as high as 192 km/h or 119 mph.

The satellite image shows smoke from fires getting pushed by strong winds over the Laptev Sea on June 16, 2019. Smoke settling on ice makes it darker, further speeding up the melting.
[ Temperatures over Greenland as high as 22.7°C or 72.9°F on June 13, 2019, at 1000 mb ]
[ Temperature of 0.9°C or 33.5°F at the North Pole on June 15, 2019 ]
[ temperatures as high as 30.5°C or 86.8°F are forecast for June 19, 2019, near Tiksi, Siberia ]
[ jet stream is forecast to move from Siberia to the Laptev Sea as fast as at 192 km/h or 119 mph June 19, 2019 ]
[ fires getting pushed by strong winds on June 16, 2019, over the Laptev Sea (at bottom of image)  ]
In conclusion, temperatures over the Arctic are high. Changes to the jet stream due to the rapid heating of the Arctic are causing hot air to move deep into the Arctic, including over the Laptev Sea all the way to the North Pole, while high temperatures in Siberia are warming up the water of rivers, causing warm water to flow into the Arctic Ocean.  

The situation is dire and calls for comprehensive and effective action, as described in the Climate Plan.


Sunday, November 2, 2014

Methane Erupting From East Siberian Arctic Shelf

Methane is erupting in huge amounts from the seafloor of the Arctic Ocean, as illustrated by the images below, showing methane over the East Siberian Arctic Shelf on October 31, 2014.

The top image on the right shows methane at an altitude of 19,820 feet (6,041 m), on October 31, 2014, pm, as captured by the MetOp1 satellite.

The middle image shows the location of the seas north of Siberia, and shows methane over the Arctic Ocean close to sea level, for reference.

The bottom image is an animation, starting at an altitude close to sea level and rising over 25 frames to an altitude of 19,820 feet (6,041 m).

As altitude increases, the methane can be seen emerging from the Laptev Sea at first, then spreading over further parts of the Arctic Ocean.

The yellow color indicates that methane is present at levels of 1950 ppb or higher.

High CO2 levels over Arctic Ocean

As in the previous post, an image has been added (below) showing recent carbon dioxide levels. Close to ground level (or rather sea level), mean CO2 level increased to 402 ppm on November 1, 2014 am, as measured by the MetOp-1 satellite.


The image below shows a comparison between CO2 (left) and methane (right).

[ Image added later, Ed. Click on image to enlarge ]
Above images indicate that large amounts of methane are broken down at higher latitudes on the Northern Hemisphere, especially over the Arctic Ocean.

Large methane eruptions from the seafloor of Arctic Ocean continue

The two images below [added later, ed.] further confirm the huge size of the methane erupting from the seafloor of the Arctic Ocean. The image directly below shows that levels as high as 2362 ppb were recorded on November 5, 2014 p.m.by the MetOp-1 satellite at an altitude of 14,385 ft (4,384 m) altitude. The image also shows that the methane is predominantly visible over the Arctic Ocean, further confirming that this is indeed the cause of the continued high methane levels.


The recent methane eruptions from the seafloor of the Arctic Ocean also appear to be pushing up methane levels at Mauna Loa, Hawaii, as measured by NOAA on November 6, 2014, as illustrated by the combination image below showing daily averages (left) and hourly averages (right).


Methane eruptions from Arctic Ocean seafloor look set to continue for months to come

As oceans keep warming, the Gulf Stream
will keep moving ocean heat into the Arctic Ocean, and ever more methane threatens to erupt from the seafloor of the Arctic Ocean.

The image on the right shows the huge sea surface temperature anomalies off the coast of North America and in the Arctic. Heat in the North Atlantic will take some time to travel to the Arctic Ocean, so this heat has yet to arrive there and contribute to cause further methane eruptions.

Nations are ignoring the growing dangers and keep each seeking a bigger share of a 'carbon budget', but in reality there is no carbon budget to divide. Instead, there is a huge debt built up by a joint failure of nations to act on pollution.

Increased methane eruptions from the seafloor of the Arctic Ocean threaten to further accelerate warming in the Arctic, in turn resulting in ever more methane being released, as illustrated in the image below, from an earlier post.

Methane in historic perspective

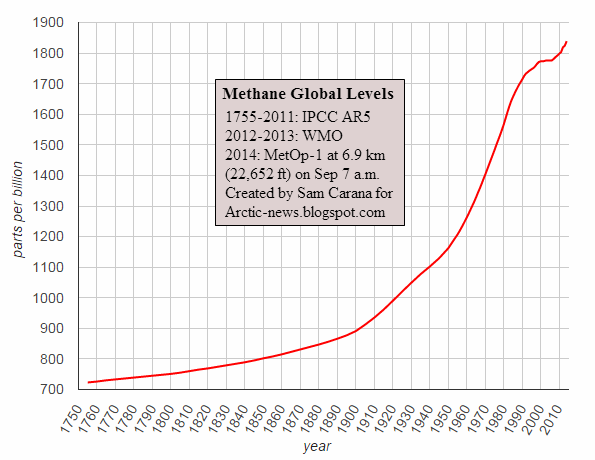
The image below shows that global methane levels have risen from 723 ppb in 1755 to 1839 ppb in 2014, a rise of more than 254%. Growth did flatten down for a few years in the early 2000s, but the overall rise does not appear to slow down.

The right-end of this graph is shown in greater detail on the image below, which also has a trendline extended to the year 2021, against a background of methane levels measured by the MetOp-1 satellite on November 2, 2014, p.m.

Note that the image used as background in the plot area has different axis labels, i.e. latitude for the vertical axis and longitude for the horizontal axis. The image below gives the levels associated with the colors on the background image, with yellow indicating levels of 1950 parts per billion (ppb) and higher.


Remember that the level of 723 ppb in 1755 was not a paleo-historic low, but instead was the high peak of a Milankovitch Cycle. The image below further illustrates this point.


And so does the image below, by Reg Morrison.


Comprehensive and effective action needed

The situation is dire and calls for comprehensive and effective action. The Climate Plan seeks emission cuts, removal of pollution from soils, oceans and atmosphere, and further action, as illustrated by the image below, from an earlier post.


Tuesday, September 30, 2014

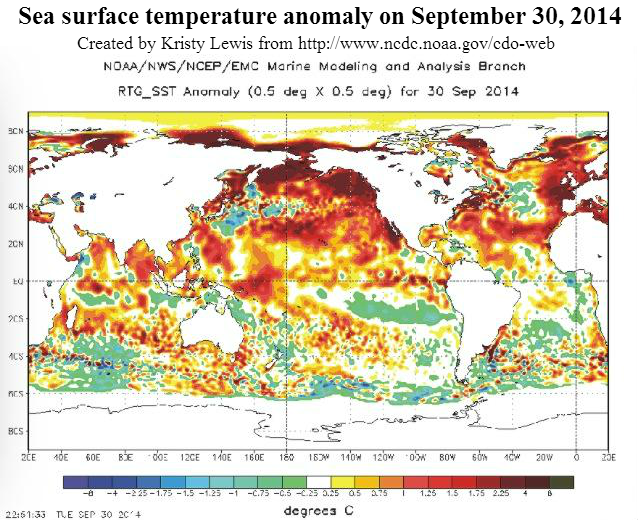
Warm water extends from Laptev Sea to North Pole

The NOAA NESDIS image below shows sea surface temperature anomalies of well over 1ºC extending to the North Pole.


The image below gives a world view, showing SST anomalies at the top end of the scale in the Laptev Sea.


The top end of the scale on the above image is 5ºC (or 9ºF).


The visualizations above and below uses a much higher scale. Even this higher-end scale doesn't appear to fully capture the dire situation we are in.


Above image shows warm water entering the Arctic Ocean through the Bering Strait and from the North Atlantic. For months to come, the Gulf Stream will keep pushing warm water into the Arctic Ocean (i.e. water that is warmer than the water in the Arctic Ocean). It takes some time (i.e. months) for the warm water from the north Atlantic to arrive in the Arctic Ocean.

Last year, methane emissions started to become huge in October and this lasted for some six months. The image below, from an earlier post, shows methane eruptions from the seafloor of the Arctic Ocean on October 16/17, 2013.


The image below, from another earlier post, shows methane eruptions from the seafloor of the Arctic Ocean on October 31, 2013.


The image below, from yet another earlier post, shows methane levels as high as 2662 parts per billion on November 9, 2013.


This year, there is even more ocean heat present, especially in the north Atlantic and the north Pacific. On September 29, 2014, methane levels as high as 2641 parts per billion were recorded and it looks like worse is yet to come.


The video below, Sea floor methane hydrate climate hazard, is an extract produced by Peter Carter from a presentation by Miriam Kastner, uploaded 7 August 2008 at Youtube.


The situation is dire and calls for comprehensive and effective action, as discussed at the Climate Plan blog.


Saturday, February 22, 2014

Massive Methane Concentrations over the Laptev Sea

High methane concentrations (2351 ppb at 19,819 ft altitude) are recorded on February 21, 2014. Analysis shows that these concentrations are the result of massive methane eruptions from the seafloor of the Arctic Ocean.

[ click on image to enlarge ]
The bottom-left inset on above image shows methane readings on February 21st, 2014, p.m. only and only for 7 layers with altitudes from 469 mb to 586 mb. At 469 mb (19,819 ft), a reading of 2351 ppb was recorded, i.e. 31% higher than the highest mean that day (which was 1796 ppb at 586 mb).

Much of the methane showing up over Asia on the main image does not show up at altitudes where 2300+ ppb levels were recorded that day, indicating that these high readings were indeed caused by releases from the seafloor of the Arctic Ocean.

The methane may have been released from areas closer to the North Pole. The methane may have traveled underneath the sea ice and entered the atmosphere over the Laptev Sea where the sea ice is thin or fractured enough to allow the methane to pass through the ice.

The Naval Research Laboratory image below shows the sea ice thickness as at February 21st, 2014.


On the other hand, the sea ice is not much thinner at the Laptev Sea, compared to areas closer to the North Pole, so the methane may well have originated from the Laptev Sea, which could indicate further destabilization of methane hydrates in the area, which is very worrying given the large quantities of methane estimated to be contained in sediments there in the form of free gas and hydrates. In addition, the Laptev Sea is very shallow, resulting in much of the releases from the seafloor there entering the atmosphere without getting decomposed by microbes in the water.

The situation may be even worse than this, as no methane data have shown up for the past few days at the NOAA website. We'll keep monitoring the situation and add updates later.

Update 1.: The image below shows the situation on February 22nd, 2014, when a peak reading of 2383 ppb was recorded (at 469 mb, or 19,819 ft altitude). This peak reading is about ⅓ higher than the highest mean that day (which was 1795 ppb at 586 mb).


Above image shows that the highest concentrations have moved somewhat closer to the North Pole along the faultline crossing the Arctic Ocean. Also, very high methane concentrations are showing up again over Baffin Bay.

This supports this post's earlier conclusion, i.e. that methane hydrate destabilization is taking place closer to the North Pole and that the methane enters the atmosphere where the sea ice is sufficiently thin or fractured to allow the methane to pass through.

The image below shows what appears to have set off this destablization, i.e. an earthquake with a magnitude of 5 on the Richter Scale in the Greenland Sea on February 20th, 2014.

[ click on image to enlarge ]
The image below shows the massive methane eruptions from the seafloor of the Arctic Ocean over February 21st and 22nd.


Update 2.: The image below shows methane readings as at February 23rd, 2014.


The image indicates that methane is being released over a large distance along the faultline crossing the Arctic Ocean. Note that the image only shows the methane that has entered the atmosphere, not the methane underneath the sea ice. Much methane may also have been released closer to Greenland along the faultline, but couldn't penetrate the sea ice at the location where it was released and therefore moved inderneath the sea ice with currents along the edges of Greenland, to enter the atmosphere where the sea ice was sufficiently thin or fractured in Baffin Bay, as well as in Hudson Bay and also along the east coast of Greenland (opposite Iceland).

The image below shows the combined methane concentrations for February 21-23, 2014, with peak readings added for each day.

[ click on image to enlarge ]
Note that, compared to the above image, the top image at "The Biggest Story of 2013" shows more methane and also shows a higher peak (2399 ppb on December 29th, 2013). So, the situation may look less threatening now, but the story remains the same, with further indications that much of the methane showing up over Baffin Bay, over Hudson Bay, and over Fram Strait (all the way down to the southern tip of Greenland) may actually originate from areas along the Gakkel Ridge fault line. The releases that started in full back in early October 2013 are still continuing, and the situation again indicates that large releases can be triggered by earthquakes.

What may have saved the day is a sudden drop in sea surface temperature anomalies along the faultline that crosses the Arctic Ocean, as illustrated by the Climate Reanalyzer image below that compares the situation on February 18 (left) with the situation on February 24 (right). The image also shows the huge sea surface temperature anomalies off the east coast of North America. Much of this warm water will be carried along with the Gulf Stream and reach the Arctic Ocean later this year.


The drop in sea surface temperature along the faultline looks to have been caused by a drop in surface temperature anomalies, as illustrated by the map of February 25th, 2014 (left on the image below). The situation may not last long, though, as illustrated by the forecast for February 27th, 2014 (on the right).


Also note that very low temperature are forecast for February 27th all along the east coast of North America. As the image below shows, people in some parts of Greenland may enjoy the same temperatures as people in the deep south of the United States on Febuary 27th, 2014.


As illustrated by above image, the weather is getting more extreme and there is a clear pattern, i.e. the Arctic has been warmer than it used to be and temperatures in the Arctic are rising several times faster than global temperatures. This decreases the temperature difference beteen the areas to the north and to the south of the Jet Stream, which in turn decreases the speed at which the Jet Stream circumnavigates the globe, resulting in the Jet Stream becoming more wavier and increasing opportunities for cold air to descend from the Arctic and for warm air to enter the Arctic. In short, the situation in the Arctic is getting worse, increasing the danger of large methane releases from the Arctic seafloor. This spells bad news for the future and calls for comprehensive and effective action as discussed at the Climate Plan blog.