Showing posts with label extreme weather. Show all posts

Sunday, August 6, 2023

Betrayal: The threat to life on Earth

by Andrew Glikson

It has been overlooked during Garma festival that, under current policies, global warming would render aboriginal lands in central and northern Australia unliveable and the top-end a nuclear target…

In his classic book The Fate of the Earth speaking for humanity Jonathan Schell describes the horror of a full-scale nuclear holocaust where human beings and animals would die if twenty thousand megatons of bombs, more than a million times the Hiroshima bomb, explode.

The consequences of a global nuclear exchange belong to the unthinkable. Nuclear weapons are the most destructive, inhumane and indiscriminate weapons ever created. Both on the scale of the devastation they cause and uniquely persistent genetically damaging radioactive fallout, they are unlike any other weapons. A single nuclear bomb detonated over a large city could kill millions of people. The use of tens or hundreds of nuclear bombs would disrupt the atmosphere world-wide, causing widespread famine.

[ Figure 1. Extreme geophysical, meteorological, hydrological and climatological events during 1980 -2012 ]

From the 1970s the full implications of climate change were only beginning to be realized, through a growing string of cyclones, fires, droughts and floods increasing in frequency and intensity above the recent historical record (Figure 1). At that time few could forecast the climate trajectory like NASA’s chief climate scientist (Hansen et al., 2012), who stated:

“Burning all the fossil fuels would create a different planet than the one that humanity knows. The paleoclimate record and ongoing climate change make it clear that the climate system would be pushed beyond tipping points, setting in motion irreversible changes, including ice sheet disintegration with a continually adjusting shoreline, extermination of a substantial fraction of species on the planet, and increasingly devastating regional climate extremes” and “warming according to the IPCC Business As Usual’ (BAU) scenario would lead to a disastrous multi-meter sea level rise on the century timescale” and “We’ve reached a point where we have a crisis, an emergency, but people don’t know that” ...

[ Figure 2. credit: NOAA, click on images to enlarge ]

According to Hans Joachim Schellnhuber, Germany’s chief climate scientist “Climate change is now reaching the end-game, where very soon humanity must choose between taking unprecedented action or accepting that it has been left too late and bear the consequences” …


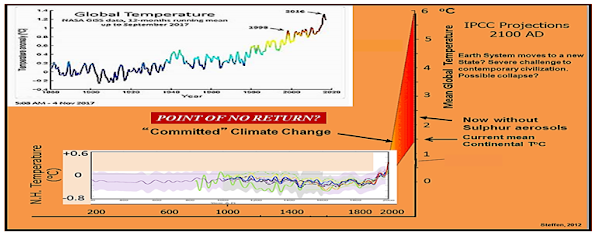
Within a century or less the Earth’s mean temperature has risen from the mean levels of the Holocene (the last 11,700 years) and the Pleistocene (11,700 years ago to 2.58 million years ago), to levels of the Pliocene (2.58 million years ago to 5.333 million years ago) to the Miocene (5.33 to 23.03 million years ago), 3 - 4°C warmer than the Holocene, at warming rates. This is faster than any identified in the Cenozoic (66 million years until the present) geological record (Glikson, 2022-23). It is difficult to find in the geological record an event increasing the global greenhouse level at a rate as extreme as the current global heating (Figure 4).

[ Figure 4. Past mean temperatures (200 AD to 2000 AD), current warming and future temperature projections (Steffen, 2012) ]

A nuclear war would represent the ultimate outcome of tribalism, nationalism, racism and war, the human propensity for mutual and self-destruction. There was a time when kings and generals would fall on their sword when they were defeated, or when their faith in their gods collapsed. Nowadays oblivious or non-caring world powers continue to proliferate nuclear weapons on hair trigger alert, mine coal and pump oil and gas, starting a greenhouse chain reaction. Leaders, so-called, opportunistically betray the defence of their own people and the future of their children. The voices of anti-nuclear and climate scientists have become subdued, ignored or betrayed. There may not be too many historians to document the 20-21ˢᵗ centuries crimes against humanity and against nature.

An explanation of the collapse of human society, dragging multiple species down with it, arises from Fermi’s Paradox, where the combination of technological achievements and an inherent killer instinct of some leads to collapse.


Andrew Glikson
A/Prof. Andrew Y Glikson
Earth and Paleo-climate scientist

Books:
The Asteroid Impact Connection of Planetary Evolution
https://www.springer.com/gp/book/9789400763272
The Archaean: Geological and Geochemical Windows into the Early Earth
https://www.springer.com/gp/book/9783319079073
The Plutocene: Blueprints for a Post-Anthropocene Greenhouse Earth
https://www.springer.com/gp/book/9783319572369
The Event Horizon: Homo Prometheus and the Climate Catastrophe
https://www.springer.com/gp/book/9783030547332
Climate, Fire and Human Evolution: The Deep Time Dimensions of the Anthropocene
https://www.springer.com/gp/book/9783319225111
Evolution of the Atmosphere, Fire and the Anthropocene Climate Event Horizon
https://www.springer.com/gp/book/9789400773318
From Stars to Brains: Milestones in the Planetary Evolution of Life and Intelligence
https://www.springer.com/us/book/9783030106027
Asteroids Impacts, Crustal Evolution and Related Mineral Systems with Special Reference to Australia
https://www.springer.com/us/book/9783319745442
The Fatal Species: From Warlike Primates to Planetary Mass Extinction
https://www.springer.com/gp/book/9783030754679
The Trials of Gaia. Milestones in the evolution of Earth with reference to the Antropocene
https://www.amazon.com.au/Trials-Gaia-Milestones-Evolution-Anthropocene/dp/3031237080


Tuesday, August 3, 2021

Climate Change Henchmen: Storm, Flood, Heat, Smoke and Fire

As climate change strikes with ever greater ferocity, five henchmen dominate the news: Storm, Flood, Heat, Smoke and Fire.


During the first 6 months of 2021, there have been 8 separate billion-dollar weather and climate disaster events across the United States. The U.S. has sustained 298 weather and climate disasters since 1980 where overall damages/costs reached or exceeded $1 billion (including CPI adjustment to 2020). The total cost of these 298 events exceeds $1.975 trillion. The total cost over the last 5 complete years (2016-2020) exceeds $630.0 billion — averaging more than $125.0 billion/year — both new records.

The image on the right shows very high temperatures over North America end July 2021, with fire radiative power as high as 247.3 MW.

The NASA Worldview satellite image below shows large smoke plumes on July 7, 2021, reaching Hudson Bay. Furthermore, large smoke plumes are also visible over British Columbia.


The NASA Worldview satellite image below shows smoke traveling from the West Coast to the East Coast of the U.S. on July 26, 2021.


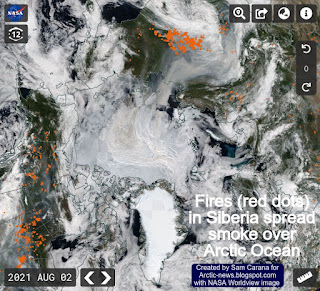
The Copernicus image on the right shows Siberian fires spreading aerosols over the Arctic Ocean on August 2, 2021 

The NASA Worldview satellite image underneath on the right shows fires (red dots) in Siberia spreading smoke over the Arctic Ocean on August 2, 2021. 

Mainstream media do cover such disasters, often with sensational footage and while pointing at the extensive damage and loss of life caused by such events. 

However, mainstream media rarely point out that climate change is getting worse and and even more so due to feedbacks that can amplify extreme weather events and can further speed up how climate change unfolds.

One of these feedbacks is albedo loss, i.e. decline of the snow and ice cover resulting in less sunlight getting reflected back into space. Fires also come with soot that can settle on snow and ice, resulting in surface darkening that will speed up melting and albedo loss. 

The rapid thinning of Arctic sea ice was discussed in an earlier post and is again illustrated by the image on the right.

The image shows the sea ice (or rather the lack of it) north of Greenland on August 15, 2021. This is where years ago the thickest sea ice was located.

The melt season will continue for at least another month time, so the situation is very worrying, since the disappearance of the thicker sea ice means that the buffer is gone, i.e. that the latent heat tipping point of Arctic sea ice has been crossed.

Here's a link to compare the sea ice north of Greenland between July 29, 2021, and August 15, 2021.

The NSIDC image on the right shows that the proportion of multiyear ice in the Arctic during the first week of August was at 1.6 million km² (618,000 million miles²).

NSIDC adds: The loss of the multiyear ice since the early 1980s started in earnest after the 2007 record low minimum sea ice cover that summer, and while there have been slight recoveries since then, it has not recovered to values seen in the 1980s, 1990s, or early 2000s. This loss of the oldest and thickest ice in the Arctic Ocean is one of the reasons why the summer sea ice extent has not recovered, even when weather conditions are favorable for ice retention.

The Naval Research Lab animation on the right shows Arctic sea ice thickness (in m) for the 30 days up to August 27, 2021, with eight days of forecasts included. 

As the temperature difference between the North Pole and the Equator narrows, the wind flowing north on the Northern Hemisphere slows down, which changes the Jet Stream, resulting in more extreme weather events, including heatwaves and fires. 

One of the most dangerous feedbacks is that, as temperatures of the water of the Arctic Ocean keeps rising, more heat will reach sediments under the Arctic Ocean where huge amounts of methane are stored, causing destabilization. 

[ from the feedbacks page ]
This destabilization threatens to cause huge quantities of methane to erupt and enter the atmosphere, as has been discussed in many earlier posts such as this one and this one

This threat becomes dramatically larger as the latent heat threshold gets crossed and the buffer constituted by Arctic sea ice disappears, so further heat entering the Arctic Ocean from the Atlantic Ocean and the Pacific Ocean can no longer be consumed in the process of melting the subsurface sea ice. 

Ominously, the MetOp-2 satellite recorded a methane level of 2839 ppb at 469 mb on July 30, 2021 pm, as the image on the right shows.

[ peak methane level of 2839 ppb ]
The image underneath shows large quantities of methane over the East Siberian Arctic Shelf (ESAS) at 469 mb on August 4, 2021 pm. 

On August 4, 2021, there still was some sea ice present in the ESAS. While this remaining sea ice does prevent a lot of sunlight from reaching the water and heating it up, the sea ice also acts as a seal, preventing ocean heat from getting transferred to the atmosphere. The water in the ESAS is very shallow, less than 50 meter in most places, which makes it easier for heat to reach sediments, while it also makes it harder for methane that is rising through the water column to get decomposed by microbes in the water.

[ large quantities of methane over ESAS ]
The image underneath shows that on August 4, 2021 am, at 293 mb, the MetOp-1 satellite recorded a mean global methane level of 1942 ppb. 

At a 1-year Global Warming Potential (GWP) of 200, this translates into 388.2 ppm CO₂e. By comparison, the CO₂ level on August 4, 2021, was 414.89 ppm according to the Keeling Curve measurements at Mauna Loa, Hawaii. A GWP of 200 for methane is appropriate in the light of the danger of a huge burst of methane erupting from the seafloor of the Arctic Ocean, which would, due to the abrupt nature of such an eruption, make its impact felt instantaneously. 

[ mean global methane level of 1941 ppb ]
Methane levels are already very high over the Arctic, so additional methane erupting there will be felt most strongly in the Arctic itself, thus threatening to trigger even further methane releases.

The situation is dire and calls for immediate, comprehensive and effective action as described in the Climate Plan.


Links


• NOAA Billion-Dollar Weather and Climate Disasters: Time Series

• Copernicus - aerosols

• MetOp methane levels

• NSIDC: Arctic Sea Ice News & Analysis - August 18, 2021

• Heatwaves and the danger of the Arctic Ocean heating up 
https://arctic-news.blogspot.com/2021/06/heatwaves-and-the-danger-of-the-arctic-ocean-heating-up.html

• Arctic sea ice disappearing fast

• When will we die?

• Most Important Message Ever


Wednesday, February 3, 2021

More Extreme Weather

As temperatures rise, the weather is getting more extreme. Around the globe, extreme weather events are striking with ever greater frequency and intensity. 

In 2020, in the U.S. alone, a record number of 22 climate and weather disasters took place that each caused damage of more than 1 billion dollar, while jointly causing the deaths of 262 people. 

Rising temperatures cause stronger storms, droughts, heatwaves and forest fires. Rising temperatures are also behind the cold weather that is currently hitting large parts of North America. Two mechanisms that, by distorting the Jet Stream, are contributing to more extreme weather are described below. 

Distortion of the Jet Streams - two mechanisms

The Jet Streams used to circumnavigate the globe in narrow bands. World climate zones used to be kept well apart by stable Jet Streams. 

On the Northern Hemisphere, the coldest point used to be the North Pole, so wind used to flow from the tropics to the North Pole, while the wind was moved to the side due to Earth's turning. 

Polar Jet Stream and Subtropical Jet Stream - NOAA image
This resulted in two Jet Streams forming, circum-navigating the globe in relatively narrow and straight bands, i.e. the Polar Jet Stream at 60°N and the Subtropical Jet Stream at about 30°N. 
 
Polar Jet Stream (blue) and Subtropical
Jet Stream (red) - NOAA image
First mechanism distorting the Jet Stream

The first mechanism distorting the Jet Stream is that, as the Arctic gets hit much harder by temperature rises, the difference in temperature decreases between the North Pole and the Equator.

This slows down the speed at which wind travels from the Tropics to the North Pole, in turn making the Jet Stream more wavy, just like a slow-moving river over flat land will take a winding route and meander.

For years, Jennifer Francis et al. warned that this will cause more extreme weather in mid latitudes. Arctic-News described Deformation of the Jet Stream as Opening the Doorways to Doom, i.e. one of the feedbacks (#10) of accelerated Arctic warming.

Second mechanism distorting the Jet Stream

Due to the rapid temperature rise of the Arctic Ocean, the North Pole is increasingly not the coldest place on the Northern Hemisphere.

Instead, the air over Greenland, North Canada and Siberia is increasingly more cold than before, and can be much colder than the North Pole, as illustrated by the ClimateReanalyzer image on the right.

This creates temperature and pressure conditions over the East Pacific and over North America that make the Jet Stream branch out.

On the next image on the right, the Jet Stream can be seen running over the West Pacific at speeds as high as 387 km/h or 241 mph (green circle) and moving within a narrow and straight band.

The Jet Stream is then confronted with much different conditions over North America that make the Jet Stream branch out widely (white arrows), with one branch moving north and going circular over the Arctic Ocean, while at the other end a branch can be seen dipping below the Equator.

As a result of these two distortion mechanisms, cold air that used to stay contained over the North Pole, can descend more easily over Siberia and North America, causing more extreme weather, while also taking away opportunities for the sea ice to build up to the strength and depth than it used to have. 

The combination image below shows forecasts for February 6, 2021.


On the above combination image, the left panel shows that, not far apart from each other and at the same time, temperature anomalies over North America are forecast to approach the top end and the bottom end of the scale. The right panel shows that temperatures over North America and Siberia are forecast to be much lower than over the Arctic Ocean.

As the temperature difference between land and ocean gets stronger on the Northern Hemisphere in Winter, the transfer of water vapor and heat to the atmosphere increases (#25 on the feedbacks page, image right). Storms and clouds forming over the North Atlantic trap heat and move much heat toward the North Pole.
 
Formation of clouds can be further facilitated by aerosols (feedback #9). A recent study looks at how melting sea ice can cause more release of iodine into the atmosphere, seeding the growth of new clouds that trap longwave radiation that would otherwise go into space.

The combination image below shows in the left panel how a branch of the Jet Stream is forecast to be moving over the North Pole at speeds as high as 107 km/h or 67 mph on February 16, 2021. Hours later that day, as the globe in the right panel shows, the surface temperature on the North Pole is forecast to be -18°C, i.e. warmer than the white-blue color (about -20°C) that covers most of North America.


As the globe in the left panel of the combination image below shows, temperature anomalies in Texas were approaching the bottom end of the scale on February 15, 2021, i.e. -32°C or -57.6°F (below 1979-2000), while the globe in the right panel shows that on February 16, 2021, temperature anomalies in between Greenland and the North Pole were forecast to approach the top end of the scale, i.e. 32°C or 57.6°F (above 1979-2000). 


Above freezing at North Pole?

As the combination image below shows, the temperature at the North Pole is forecast to be 0°C or 32°F, panel right, on February 22, 2021, 18:00 UTC, while temperature anomalies at the North Pole are forecast to be at the top end of the scale, i.e. 32°C or 57.6°F above 1979-2000. 


The light-blue color over the North Atlantic on the globe on the left is a cold anomaly resulting from cold air moving from North America over the Atlantic Ocean (forecast initiated Feb.15, 2021, 18:00 UTC).

Ominously, sea ice is breaking up north of Greenland. 


And ominously, the N20 satellite recorded methane levels as high as 2835 ppb at 399.1 mb on the afternoon of February 17, 2021.


Conclusion

The situation is dire and calls for immediate, comprehensive and effective action as described in the Climate Plan.


Links

• 2020: Hottest Year On Record
https://arctic-news.blogspot.com/2021/01/2020-hottest-year-on-record.html

• NOAA - U.S. Billion-Dollar Weather and Climate Disasters: Overview
https://www.ncdc.noaa.gov/billions/overview

• Climate Reanalyzer
https://climatereanalyzer.org

• Nullschool

• Feedbacks in the Arctic

• Evidence linking Arctic amplification to extreme weather in mid‐latitudes - by Jennifer Francis et al. 

• Opening the Doorways to Doom (feedback #14)


Wednesday, September 2, 2020

The unthinkable consequences of global warming

The unthinkable consequences of global warming
by Andrew Glikson

“We’re simply talking about the very life support system of this planet”. Hans Joachim Schellnhuber 2009.

“Burning all fossil fuels would create a different planet than the one that humanity knows. The paleoclimate record and ongoing climate change make it clear that the climate system would be pushed beyond tipping points, setting in motion irreversible changes, including ice sheet disintegration with a continually adjusting shoreline, extermination of a substantial fraction of species on the planet, and increasingly devastating regional climate extremes” and “this equates to 400,000 Hiroshima atomic bombs per day 365 days per yearJames Hansen et al. 2012.

Humanity is fast reaching our moment of truth. What Hansen, Schellnhuber and others have warned us is based on evidence consistent with the basic laws of science, the discipline which, contrary to medieval superstition, is founded on direct observations, calculations and on reason.

Figure 1. The change in state of the planetary climate since the onset of the industrial age in the 17ᵗʰ century.
To elaborate on the nature of the threat humanity and nature are now facing:
A. The rise in greenhouse gas levels (Figure 1) and temperatures at the Earth surface, rising by more than 1°Celsius since 1880, has been underestimated. This is because the temperature values take little account of the masking effects of sulphur dioxide and other aerosols, which transiently mitigates global temperatures by at least ~ -0.5°C. The actual rise could already be as much as 1.5 degrees Celsius, the upper level recommended by the Madrid climate conference. On present trends temperatures will rise to above 2 degrees relative to pre-industrial levels Celsius by 2030. Further temperature rises are likely to be irregular and affected by the flow of ice melt water from melting ice sheets into the oceans by mid-century.

B. The rise in temperature of large ocean regions, with much of the warming occurring to ~800 meter deep levels, reduces the ocean’s ability to absorb CO₂. This means that more CO₂ is trapped in the atmosphere, causing further warming. Also, as ocean temperatures rise, the oceans are depleted in oxygen, which leads to increased production of methane and hydrogen sulphide, which are poisonous to marine life.

C. Models projecting global warming as a linear trajectory, as outlined by the International panel of Climate Change (IPCC), take only limited account of the weakening of climate zone boundaries, as temperatures rise in the polar regions, notably the circum-Arctic jet stream. The weakening of the boundaries allows penetration of warm air masses from the south, as expressed by fires in the Tundra and the Arctic. Conversely, the injection of freezing air masses from the Arctic into North America and Europe (The so-called Beast from the East) provides further evidence for the weakening of the Arctic boundary. These are likely to produce more violent winter storms and heavier snowfalls, forming direct results of global warming. Cooling of large surface areas of the ocean by ice melt water flowing from Greenland and the Antarctica, and accumulation of warmer water in depth, lead to irregular warming trends, with a consequent three-fold rise in extreme weather events (Figure 2), especially where high temperature and cold air masses collide.
Figure 2. The number (bars, left axis), type (colors), and annual cost (right vertical axis) of U.S. billion-dollar disasters from 1980-2018. Running annual cost (grey line), along with the 95% confidence interval, and 5-year average costs (black line).The number and costs of disasters are increasing. Inland flooding (blue bars) and severe storms (green bars) are making in increasingly large contribution to the number of U.S. billion-dollar disasters.  
D. An estimated 1,400 billion tons (400 GTC) of carbon is embedded in the world’s permafrost, mostly in the Arctic and sub-Arctic, from where large amounts of carbon are released under the fast warming conditions. By comparison, the atmosphere presently contains 750 billion tons of carbon. Should a large part of the existing permafrost thaw, Earth could experience dramatic, fast and very dangerous warming. Huge amounts of methane (CH₄), the gas considered responsible for mass extinctions in the history of Earth about 251 million years ago (Permian -Triassic boundary) and 56 million years ago (Paleocene-Eocene boundary), are being released from melting permafrost and Arctic sediments, raising the atmospheric concentration of the gas by more than three-fold (from <600 to 1800 parts per billion) (Figure 3). Temperature rises during the PETM event are estimated as 5 to 8 degrees Celsius. When emitted the warming induced by methane is more than 84 times that of CO₂, declining to 25 times over some 20 years. The release to the atmosphere of a significant part of the stored carbon (permafrost ~900 billion ton carbon [GtC]), peatland 500 GtC and vegetation prone to fires (650 GtC), is sufficient to shift most of the Earth’s climate into a tropical to hyper-tropical state.
Figure 3. Global reserves and growth in the release of methane 1988-2019
E. The 2019-2010 wildfires in Australia have unleashed about 900 million tons of carbon dioxide into the atmosphere, which is equivalent to nearly double the country's total yearly fossil fuel emissions. As the planet warms, wildfires become more frequent and accelerate the warming process.

F. Sea level rise will flood the very regions where civilization has emerged, low river valleys, delta and coastal planes, which are also vital to food production. This is estimated to displace 100 million people initially, and more over time as major coastal cities are flooded.

G. The rising energy levels in warming regions of the Earth, notably tropical island chains such as the Caribbean and the Philippines, generate devastating tropical storms known as cyclones and typhoons. These wreak havoc on coastal regions of southeast North America, India, southern Africa, the Pacific and Australia.

H. Rising heat levels in tropical, subtropical and intermediate Mediterranean climate zones may render large areas unsuitable for agriculture and are physiologically difficult for humans to live in as “heat bulb” conditions set in.
An outline of the migration of climate zones in Australia and the southwestern Pacific is given in Figure 4. Further to NASA’s reported mean land-ocean temperature rise to +1.18°C for March 2020 relative to 1951-1980, large parts of the continents, including Siberia, central Asia, Canada, parts of west Africa, eastern South America and Australia, are warming toward mean temperatures of +2°C and higher. The rate exceeds that of the Last Glacial Termination (LGT) during 21–8 thousand years ago and earlier warming events. These includes the Paleocene-Eocene hyperthermal event (PETM) (about 55.9 million years ago [Ma]) and the Cretaceous-Tertiary boundary (K-T) (64.98 Ma) impact event. The relationships between the global warming rate and the migration of climate zones toward the poles are portrayed in detail on global climate maps (Figure 4).
Figure 4. The migration of the northward into southern Europe. Note the drying up of Spain,
Italy, Greece and Turkey and the increased in precipitation in Northern Europe.
In the 20th century the Earth climate has reached a tipping point, namely a point of no return. Global CO₂ and other greenhouse gases rise have reached a large factor to an order of magnitude higher than those of the past geological and mass extinction events, as have the rate of warming, the shift of climate zones and the rate of extreme weather events (Figure 2). Given the abrupt change in state of the atmosphere-ocean-cryosphere-land system, accelerating since the mid-20ᵗʰ century, the terms “climate change” and “global warming” no longer reflect the extreme scale and rate of these shifts.

Time is running out.


Andrew Glikson
Dr Andrew Glikson
Earth and Paleo-climate scientist
ANU Climate Science Institute
ANU Planetary Science Institute
Canberra, Australia


Books:
The Asteroid Impact Connection of Planetary Evolution
http://www.springer.com/gp/book/9789400763272
The Archaean: Geological and Geochemical Windows into the Early Earth
http://www.springer.com/gp/book/9783319079073
Climate, Fire and Human Evolution: The Deep Time Dimensions of the Anthropocene
http://www.springer.com/gp/book/9783319225111
The Plutocene: Blueprints for a Post-Anthropocene Greenhouse Earth
http://www.springer.com/gp/book/9783319572369
Evolution of the Atmosphere, Fire and the Anthropocene Climate Event Horizon
http://www.springer.com/gp/book/9789400773318
From Stars to Brains: Milestones in the Planetary Evolution of Life and Intelligence
https://www.springer.com/us/book/9783030106027
Asteroids Impacts, Crustal Evolution and Related Mineral Systems with Special Reference to Australia

http://www.springer.com/us/book/9783319745442


Thursday, July 9, 2020

Global warming and ice sheet melting: Portents of a Younger dryas-like stadial event

Global warming and ice sheet melting:
Portents of a Younger dryas-like stadial event
by Andrew Glikson


Linear climate projections by the IPCC are difficult to reconcile with the paleoclimate evidence of stadial cooling events which closely succeeded warming peaks, including the Younger dryas (12.9–11.6 kyr ago), Laurentian melt (~8.3 kyr) and earlier interglacial stadials. Each of these events followed peak interglacial temperatures, leading to extensive melting of the ice sheets and transient stadial cooling events. Current global temperature rises in the range of ~ +1.19 ± 0.13 °C (Northern Hemisphere) and higher in the Arctic are consistent with this pattern, leading to the build-up of ice melt pools south of Greenland and around Antarctica. The growth of these pools is likely to progress toward large-scale to a global stadial, inducing differential warming and cooling effects leading to major weather disruptions and storminess, possibly analogous to the Younger dryas and Laurentian melt events.

Linear temperature rise projections by the IPCC are unlikely in view of (1) amplifying feedbacks of greenhouse gases and global warming on land and ocean, and (2) stadial cooling effects due to the flow of ice melt water from the large ice sheets into the North Atlantic Ocean and the circum-Antarctic ocean (Figure 1). Apart from the absolute GHG level (~500 ppm CO₂-equivalent), the high rise rate of ~2-3 ppm CO₂/year and thereby temperature is driving dangerous weather events. The extreme rise in greenhouse gases in the atmosphere is evident from a comparison with past climate events (Figure 6). Linear temperature projections and thereby environment change are complicated by storminess due to collisions between air masses of contrasted temperatures. As the Arctic jet stream weakens, warm air currents from the south and freezing air masses from the north cross the boundary, a pattern already manifested by Arctic heat waves and fires and by penetration of freezing air masses into mid-latitudes, i.e. the “Beast from the East” snow storms. The increasing extent of cold ice melt pools around Greenland and Antarctica (Figure 1) suggest such a process is already in progress, signifying an onset of an interglacial stadial, as modelled by Hansen et al. 2016 and Bronselaer et al. (2016).

Figure 1 A. The cold ocean region south of Greenland visible on the NASA's 2015 global mean
temperatures (NASA/NOAA; 20 January 2016), the warmest year on record since 1880;
B. Circum-Antarctic summer surface temperatures, showing the large Weddell Sea and other
cold Sub-Antarctic ocean anomalies related to the flow of ice melt water into the ocean, and a seasonal
warming anomaly in the Ross Sea due to upwelling of warm salty water from the circum-Antarctic current.

Stadial events

Late Pleistocene climate cycles were controlled by orbital parameters of the Milankovitch cycles including eccentricity (~100,000 years), obliquity to the ecliptic plane (~41,000 years) and precession/wobble of the Earth’s axis (~19,000 and ~23,000 years). The Younger dryas of 12,900 to 11,600 years ago following the Allerod BÖlling warm peak and marked by cooling of near -20°C in Greenland and (Figure 2A, B), has major implications for climate change projections for the 21-23rd centuries.

The Younger dryas is the longest of three late Pleistocene stadials (Figure 2A) associated with abrupt climatic changes that took place over the last 16,000 years. According to Steffensen et al. 2008 based on deuterium isotopes in ice cores the abrupt onset of the Younger dryas in Greenland occurred over less than 1 year and ended over less than 3 years (Figure 2B), or about 50 years based on stable water isotopes representing the air temperature record. Evidence for the effects of the Younger dryas stadial has also been identified in tropical and subtropical regions (Shakun and Carlson, 2010) (Figure 3). The underlying factors for the Younger dryas and Laurentian (Figure 4) stadial events are the deglaciation of Northernmost America, flow of cold ice melt water into the North Atlantic Ocean and into North American lakes (Lake Agassiz), and the retreat southward of the North Atlantic Thermohaline Current.

Suggestions of a comet impact origin of the Younger dryas are inconsistent with (1) the recurrence of stadial events following peak interglacial temperatures over the last 420,000 years (Figure 5) and (2) the paucity of clear evidence for a large extraterrestrial impact contemporaneous with the Younger dryas, including the little known age of the radar-detected crater below the Hiawatha Glacier In northwest Greenland.

Figure 2A Air temperatures at the Last glacial maximum (20-16 kyr), BÖlling-Allerod warm peak,
Younger dryas (12,900 to 11,600 years ago) and 8.2 kyr Laurentian stadial event. This image
shows temperature changes, determined as proxy temperatures, taken from the central region

of Greenland's ice sheet during the Late Pleistocene and beginning of the Holocene.

Figure 2B. deuterium evidence for onset cooling temperature and terminal
warming of the Younger dryas stadial event (14,740-11,660) (Steffensen et al. 2008).

Figure 3. Magnitude of late Holocene glacial-interglacial temperature changes
in relation to latitude. Black squares are the Northern Hemisphere (NH),
gray circles the Southern Hemisphere (SH) (Shakun and Carlson, 2010).

The youngest recorded stadial, the Laurentian melt, between ~8,500 and ~8.000 years ago (Figure 4), is indicated by distinctive temperature–CO₂ correlation with global CO₂ decline of ≈25 ppm by volume over ≈300 years, consistent with the lowering of North Atlantic sea-surface temperatures and weakening of the AMOC (Atlantic Meridional Ocean Circulation).

Figure 4 A. The ~8.2 kyr Laurentian stadial event in a coupled climate model (Wiersma et al. 2011);
B. Reconstructed CO₂ concentrations for the interval between ~8,700 and ~6,800 BP, based on
CO 2 extracted from air in Antarctic ice of Taylor Dome (Wagner et al. 2002).
The Younger dryas and the Laurentian stadials are not unique, as peak temperatures in every interglacial event over the last 420,000 years were followed by sharp cooling events (Figure 5). Apart from the absolute level of greenhouse gases (GHG) in the atmosphere the high rate at which GHG concentrations are rising, as shown by comparisons with previous extreme warming events (Figure 6), enhances extreme weather events, as well as retards the ability of fauna and flora to adapt to the new conditions.

Figure 5 (a) Evolution of sea surface temperatures in five glacial-interglacial transitions recorded in
ODP 
1089 at the sub-Antarctic Atlantic Ocean (Cortese et al. 2007). Grey lines – δ 18 O measured on
Cibicidoides plankton; Black lines – sea surface temperature. Marine isotope stage numbers are 
indicated on top of diagrams. Note the stadial following interglacial peak temperatures; (b) the last 
glacial maximum and the last glacial termination. Olds- Oldest dryas; Old – Older dryas; Yd – Younger dryas.

Figure 6 (A) Reconstructed atmospheric CO₂ variations during the Late Cretaceous–early Tertiary
derived from the Stomata indices of fossil leaf cuticles calibrated by using inverse regression
and stomatal ratios (Beerling et al. 2002);
(B) Simulated atmospheric CO₂ at and after the Palaeocene-Eocene boundary (after Zeebe et al. (2009).
Compare the CO₂ ppm/year values with the current rise of 2 to 3 ppm/year;
(C) Global CO₂ and temperature during the last glacial termination (After Shakun et al., 2012)
(LGM - Last Glacial Maximum; OD – Older dryas; BA - Bølling–Allerød; YD - Younger dryas);

The average global land and ocean surface temperature for March 2020 was 1.16°C above the 20th century average global level of 12.7°C. Current CO₂ rise and warming rates exceed that of the Last Glacial Termination (LGT) (21–8 kyr) (Figure 6C), the Paleocene-Eocene Thermal Maximum (PETM) (55.9 Ma) (Figure 6B) and the Cretaceous-Tertiary boundary (K-T) (64.98 Ma) impact event (Figure 6A). The relations between warming rates and the migration of climate zones toward the poles (Figure 7), including changes in the atmosphere and ocean current systems, are in the root of the major environmental changes in these zones.
Figure 7. Expansion of the tropical African climate zone (vertical red lines) into subtropical and Mediterranean
climate zones to the north and south (Migration, Environment and Climate Change, International Organization
for Migration, Geneva, Switzerland (Regional Maps on Migration, Environment and Climate Change.

Future Stadial events

IPCC climate change projections for 2100-2300 portray linear to curved temperature progressions (SPM-5). However, amplifying feedbacks and transient cooling events (Stadials) ensuing from the flow of ice melt water into the oceans during peak interglacial warming events, impose abrupt temperature variations (Figure 5). The current flow of ice melt water from Greenland and Antarctica (Figures 8, 9) is leading to regional ocean cooling in the North Atlantic and around Antarctica (Rahmstorf et al, 2015; Hansen et al. (2016); Bronselaer et al. 2018; Purkey et al. 2018; Vernet et al. 2019) (Figures 1, 8). Under high greenhouse gas and temperature rise trajectories (RCP8.5) this implies future stadial events as modelled by Hansen et al. (2016) (Figure 10) and Bronselaer et al. (2018) (Figure 11).

Depending on different greenhouse emission scenarios (IPCC 2019; van Vuren et. al. (2011), including the CO₂ forcing-equivalents of methane (CH4) and nitrous oxide (N2O), the total CO₂–equivalent rise has reached 496 ppm (NOAA, 2019). As the oceans heat contents is rising, upwelling of warm sublayers is melting the leading edges of continental glaciers (Figure 8). This factor and the flow of ice meltwater from leading glacier fronts and grounding lines lead to stratification of the sub-Antarctic ocean and an incipient onset of a southern ocean stadial (Figure 8).

Figure 8. The transition from grounded ice sheet to floating ice shelf and icebergs

Figure 9. Greenland and Antarctic ice mass change. GRACE data are extension of Velicogna et al. (2014)
gravity data. MBM (mass budget method) data are from Rignot et al. (2011). Red curves are gravity data
for Greenland and Antarctica only; small Arctic ice caps and ice shelf melt add to freshwater input.
Satellite and mass balance measurements of the large ice sheets indicate their rapid reduction (Figure 9). Variations in ice thickness, ice drainage and ice velocity data in 176 Antarctic basins between 1979 and 2017 indicate a total mass loss rise from 40 ± 9 Gt/year in 1979–1990 to 50 ± 14 Gt/year in 1989–2000, 166 ± 18 Gt/year in 1999–2009, and 252 ± 26 Gt/year in 2009–2017 (Figure 9). This amounts to an increased melting by more than 6-fold in about 40 years, contributing an average sea level rise of 3.6 ± 0.5 mm per decade, with a cumulative 14.0 ± 2.0 mm since 1979 (Rignot et al. 2019). The mass loss concentrated in areas closest to warm, salty, subsurface, circumpolar deep water (CDW), consistent with enhanced polar westerlies pushing CDW toward Antarctica.

The Greenland ice sheet contains approximately 2,900,000 GtI of ice. During the exceptionally warm Arctic summer of 2019, Greenland lost 600 GtI of ice. Under global GHG and temperature rise this rate is likely to be exceeded. The Greenland ice sheet may not last much longer than a Century. The Antarctic ice sheet weighs approximately 26,500 Gigaton. For a loss greater than ~250 GtI/year it could last for 105 years or less. For accelerated ice melt rates under rising GHG concentrations it could last for significantly shorter time, except for possible negative feedbacks associated with stadial cooling?

Hansen et al. (2016) suggest that, depending on ice melt rates of the polar ice sheets, transient cooling events (stadials) can be expected to develop over periods dependent on the rates of ice melt (Fig. 10). Stadial cooling of about -2°C lasting for several decades (Figure 10) may affect temperatures in Europe and North America. The model is consistent with a slowdown of the Atlantic Meridional Ocean Circulation (AMOC) (Weaver et al. 2012) and the exceptional growth of a cold water region southeast of Greenland, (Rahmstorf et al, 2015).
Figure 10. A. Model surface air temperature (◦C) change in 2096;
B. Surface air temperature (◦C) relative to 1880–1920 for several ice melt scenarios.

According to Bronselaer et al. (2018) temporal evolution of the global-mean surface-air temperature (SAT) shows meltwater-induced cooling translates to a reduced rate of global warming (Fig. 11), with a maximum divergence between standard models and models which include the effects of meltwater-induced cooling of 0.38 ± 0.02°C in 2055. As stated by the authors “We demonstrate that the inclusion in the model of ice-sheet meltwater reduces global atmospheric warming, shifts rainfall northwards, and increases sea-ice area”, and “Antarctic meltwater is therefore an important agent of climate change with global impact, and should be taken into account in future climate simulations and climate policy.”
Figure 11. The 2080–2100 meltwater-induced sea-air temperature anomaly relative to the standard
RCP8.5 ensemble. Hatching indicates where the anomalies are not significant at the 95% level.

Conclusions


Based on the paleoclimate record, global warming, penetration of cold and warm air masses across weakened polar boundaries, increased ice melting rates, sea level rise and near-surface cooling of large ocean tracts (Figures 10, 11), collisions between warm and cold air and water masses and thereby storminess are likely to determine the future climate of large parts of Earth. With rising greenhouse gas levels and their amplifying feedbacks from land and oceans these developments are likely to persist in the long term. The continuing migration of climate zones toward the poles is likely to be disrupted by developing stadial effects and differential warming and cooling effects, leading to major weather disruptions and storminess. Continuing release of greenhouse gases and their amplifying feedbacks could lead to tropical Miocene-like conditions about 4 to 5 degrees Celsius warmer than late Holocene climate conditions which allowed agriculture and thereby civilization to emerge.


Andrew Glikson
Dr Andrew Glikson
Earth and Paleo-climate scientist
ANU Climate Science Institute
ANU Planetary Science Institute
Canberra, Australia


Books:
The Asteroid Impact Connection of Planetary Evolution
http://www.springer.com/gp/book/9789400763272
The Archaean: Geological and Geochemical Windows into the Early Earth
http://www.springer.com/gp/book/9783319079073
Climate, Fire and Human Evolution: The Deep Time Dimensions of the Anthropocene
http://www.springer.com/gp/book/9783319225111
The Plutocene: Blueprints for a Post-Anthropocene Greenhouse Earth
http://www.springer.com/gp/book/9783319572369
Evolution of the Atmosphere, Fire and the Anthropocene Climate Event Horizon
http://www.springer.com/gp/book/9789400773318
From Stars to Brains: Milestones in the Planetary Evolution of Life and Intelligence
https://www.springer.com/us/book/9783030106027
Asteroids Impacts, Crustal Evolution and Related Mineral Systems with Special Reference to Australia
http://www.springer.com/us/book/9783319745442