Tuesday, December 22, 2020

An Orwellian climate while Rome burns

 by Andrew Glikson

The definition of insanity is doing the same thing over and over and expecting different results. - Albert Einstein.


As the world is trying to hopefully recover from the tragic effects of COVID-19, it is reminded there is no vaccine for the existential threat for its life support systems posed by global warming, nor for the looming threats of future wars and nuclear wars fueled by warmongers and $trillion preparations by military-industrial complexes.

Between 1740 and 1897 some 230 wars and revolutions in Europe suggested war remained deeply ingrained in the human psyche and civilization. The question is whether the currently approaching catastrophes can be averted.

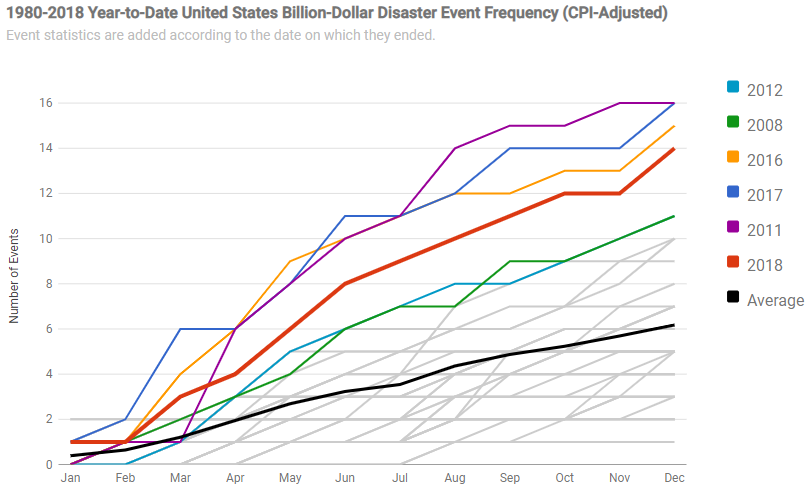
No one wishes to believe in the projections made in the recent book ‘The Uninhabitable Earth’, except that these projections, made by David Wallace-Wells, are disturbingly consistent with the current shift in state of the climate toward +4 degrees and even +6 degrees Celsius above pre-industrial levels, as indicated by the current trends (Figure 1) and conveyed by leading climate scientists and the International Panel for Climate Change (IPCC). 

Figure 1.Global mean temperature estimates for land areas (NASA).

Facing the unthinkable consequences of global warming is pushing climate scientists into a quandary. In private conversations, many scientists express far greater concern at the trend of global warming than they do in public. However, faced with social and psychological barriers, as well as threats of losing positions and jobs, in business, public service and academia, a majority keeps silent, displaying lesser courage than school children.

According to James Hansen (2012), NASA’s former chief climate scientist: “You can’t burn all of these fossil fuels without creating a different planet”. According to Joachim Schellnhuber (2015), Germany’s chief climate scientist: ‘We’re simply talking about the very life support system of this planet’, and ‘If we don’t solve the climate crisis, we can forget about the rest’.

Referring to a phenomenon he termed “scientific reticence”, James Hansen (2007) states: “I suggest that a “scientific reticence” (namely a reluctance to convey worrying news) is inhibiting the communication of a threat of a potentially large sea level rise”.

According to Bajaj (2019): “when it comes to climate change, the need for excessive caution and absolute certainty of the results is manifesting as silence from the mainstream science on the worst yet probable consequences and the worst-case scenarios that are looking increasingly likely”. A paradox emerges where scientists who experience scientific reticence are still accused of being alarmists.

This is because an evaluation of the probability of a risk needs to be related to the magnitude of the risk. For example, the inspection of the engines of a Jumbo Jet carrying 300 passengers need to be even more rigorous than that of a commuter van, or evaluation of the risk posed by a potential failure of a nuclear reactor even more critical than that of a conventional power plant, as is the absolute safety of a particle accelerator.

By analogy with the dictum Those who do not learn from history are doomed to repeat it projections of future climate trajectories need to take account of studies of the past behaviour of the atmosphere-ocean system. The pace of current global warming exceeds those of the last 2.6 million years by an order of magnitude, with calamitous consequences for biological systems.

As indicated by the basic laws of physics, the principles of climate science and empirical observations in nature, under an increase of greenhouse gas concentrations by about 50 percent , global warming is inevitable. While modeled future climate change trajectories may vary, depending whether observations are based on recent measurements, paleoclimate data or models, the consequences of such an increase are inevitably catastrophic. Whereas IPCC models portray linear warming trends to 2300, other models take account of the flow of ice melt water from Greenland and Antarctica into the oceans and thereby irregular warming (Glikson, 2019).

Given the warnings issued by leading climate scientists and the IPCC, while nations keep investing their dwindling $trillions in its military-industrial complexes in preparations for future war/s, our world is losing its last chance to save its planetary life support systems


Andrew Glikson

Dr Andrew Glikson
Earth and Paleo-climate scientist
ANU Climate Science Institute
ANU Planetary Science Institute
Canberra, Australia


Books:
The Asteroid Impact Connection of Planetary Evolution
http://www.springer.com/gp/book/9789400763272
The Archaean: Geological and Geochemical Windows into the Early Earth
http://www.springer.com/gp/book/9783319079073
Climate, Fire and Human Evolution: The Deep Time Dimensions of the Anthropocene
http://www.springer.com/gp/book/9783319225111
The Plutocene: Blueprints for a Post-Anthropocene Greenhouse Earth
http://www.springer.com/gp/book/9783319572369
Evolution of the Atmosphere, Fire and the Anthropocene Climate Event Horizon
http://www.springer.com/gp/book/9789400773318
From Stars to Brains: Milestones in the Planetary Evolution of Life and Intelligence
https://www.springer.com/us/book/9783030106027
Asteroids Impacts, Crustal Evolution and Related Mineral Systems with Special Reference to Australia
http://www.springer.com/us/book/9783319745442


Tuesday, December 15, 2020

Temperatures keep rising


Temperatures keep rising. Above image uses NASA data that are adjusted to reflect a 1750 baseline, ocean air temperatures and higher polar anomalies, while showing anomalies going back to September 2011, adding a blue trend going back to 1880 and a red trend going back to September 2011. 

The map below also shows that in November 2020, especially the Arctic Ocean, again was very hot.


Anomalies in the above NASA image are compared to 1951-1980, while NOAA's default baseline for temperature anomalies is the 20th century average. In the Copernicus image below anomalies are compared to the 1981-2010 average. 

Using a different baseline can make a lot of difference. An earlier analysis pointed out that, when using a 1750 baseline and when using ocean air temperatures and higher Arctic anomalies, we did already cross  2°C above pre-industrial in February 2020.  

Above Copernicus image shows temperatures averaged over the twelve-month period from December 2019 to November 2020. The image shows that the shape of the global anomaly over the past twelve months is very similar to the peak reached around 2016. This confirms that global heating is accelerating, because the peak around 2016 was reached under strong El Niño conditions, whereas current temperatures are reached under La Niña conditions. Furthermore, sunspots are currently low. The La Niña and the low sunspots are both suppressing temperatures, as discussed in a recent post.

Future rise?

By how much will temperatures rise over the next few years?


Above image, from the U.N. Emissions Gap Report 2020, shows that growth in greenhouse gas emissions continued in 2019, with emissions reaching a total of 59.1 GtCO₂e. The commitments promised at the Paris Agreement in 2015 were not enough to limit the temperature rise to 1.5°C and those commentments were not even met, said António Guterres, United Nations Secretary-General, calling on all nations to declare a state of Climate Emergency until carbon neutrality is reached. Earlier, António Guterres had said: "We are headed for a thundering temperature rise of 3 to 5 degrees Celsius this century." 

What could cause a steep temperature rise over the next few years? 

A temperature rise of more than 3°C above pre-industrial could occur, and this could actually happen within a few years time. There are a number of reasons why the temperature rise could take place so fast, as described below.

As said, the temperature is currently suppressed by the current La Niña and the currently low sunspots (Hansen et al. give the sunpot cycle an amplitude of some 0.25 W/m²). Such short-term differences show up more in the red trend of the image at the top, which uses a polynomial trend over a short period. 

Compensating for the fact that sunspots are currently low and the fact that we're currently a La Niña period can already push the temperature anomaly well over the 2°C threshold that politicians at the Paris Agreement pledged would not be crossed.  


The above NOAA image and the NOAA image below illustrate that we are currently experiencing La Niña conditions
 

How long will it take before we'll reach the peak of the next El Niño? NOAA says:
El Niño and La Niña episodes typically last nine to 12 months, but some prolonged events may last for years. While their frequency can be quite irregular, El Niño and La Niña events occur on average every two to seven years. Typically, El Niño occurs more frequently than La Niña.
There are further reasons why the temperature rise could strongly accelerate over the next few years. Loss of cooling aerosols is one such reason. Another reason is the growing frequency and intensity of forest fires, which come with high emissions of methane, of heating aerosols such as black carbon and brown carbon, and of carbon monoxide that causes hydroxyl depletion, thus extending the lifetime of methane and heating aeosols. 

Map from earlier postThe vertical axis depicts
latitude, t
he North Pole is at the top (90° North),
the Equator in the 
middle (0°) and the South Pole 
at the bottom (-90° South). GHCN v4 land-surface
air + ERSST v5 sea-surface water temperature 
anomaly. The Arctic anomaly reaches 4.83°C or 
8.69°F 
vs 1951-1980, and 5.57°C vs 1885-1914.
A hotter world will will also hold more water vapor, a potent greenhouse gas. 
 
Furthermore, many tipping points affect the Arctic, e.g. more methane and nitrous oxide emissions can be expected to result from continued decline of what once was permafrost. 

The temperature rise is felt the strongest in the Arctic, as illustrated by the zonal mean temperature anomaly map on the right, from an earlier post.

As one of the tipping points gets crossed in the Arctic, multiple feedbacks can start kicking in more strongly, resulting in multiple additional tipping points to subsequently get crossed. 
 
At least ten tipping points affect the Arctic, as described in an earlier post, and it looks like the latent heat tipping point has already been crossed, as illustrated by the image below, from an earlier post, which shows two such tipping points. 
 
[ from an earlier post ]

Huge temperature rise

When extending the vertical axis of the image at the top, a picture emerges that shows that a temperature rise of more than 13°C above 1750 could happen by 2026. The trend shows that 10°C is crossed in February 2026, while an additional rise of 3°C takes place in the course of 2026. The temperature could rise this much, in part because at 1200 ppm CO₂e the cloud feedback will start to kick in, which in itself can raise temperatures by an additional 8°C.


And the rise wouldn't stop there! Even when adding up the impact of only the existing carbon dioxide and methane levels, and then adding large releases of seafloor methane, this alone could suffice to trigger the cloud feedback, as described in an earlier post

Of course, there are further warming elements, in addition to carbon dioxide and methane, and they could jointly cause a rise of 10°C by 2026 even in case of smaller releases of seafloor methane, as illustrated by the image below. 
 
[ from an earlier post ]

[ from an earlier post ]
Above image illustrates how a temperature rise of more than as 10°C could eventuate as early as February 2026 when taking into account aerosol changes, albedo changes, water vapor, nitrous oxide, etc., as discussed in an earlier analysis

The joint impact of all warming elements, including the cloud feedback, threatens to cause a total rise of 18°C, as an earlier post warned, adding the image on the right. 

How high could the temperature rise? At a 3°C rise, humans will likely go extinct, while most life on Earth will disappear with a 5°C rise, and as the temperature keeps rising, oceans will evaporate and Earth will go the same way as Venus, a 2019 analysis warned. 

The situation is dire and calls for immediate, comprehensive and effective action, as described in the Climate Plan.


Links

• Climate Plan
https://arctic-news.blogspot.com/p/climateplan.html

• NOAA Global Climate Report - November 2020
https://www.ncdc.noaa.gov/sotc/global/202011

• NASA GISS Surface Temperature Analysis - maps
https://data.giss.nasa.gov/gistemp/maps/index.html

• What are El Niño and La Niña?
https://oceanservice.noaa.gov/facts/ninonina.html

• Multivariate El Niño/Southern Oscillation (ENSO) Index Version 2 (MEI.v2)
https://psl.noaa.gov/enso/mei

• Copernicus - surface air temperature for Novmber 2020
https://climate.copernicus.eu/surface-air-temperature-october-2020

• NOAA ISIS Solar Cycle Sunspot Number Progression
https://www.swpc.noaa.gov/products/solar-cycle-progression

• Secretary-General's address at Columbia University: "The State of the Planet"
https://www.un.org/sg/en/content/sg/speeches/2020-12-02/address-columbia-university-the-state-of-the-planet

• U.N. Emissions Gap Report 2020 
https://www.unenvironment.org/emissions-gap-report-2020

• U.N. Climate Ambitions Summit, December 12, 2020
https://www.climateambitionsummit2020.org/ondemand.php

• U.N. Paris Agreement (2015)
https://unfccc.int/process-and-meetings/the-paris-agreement/the-paris-agreement

• Why stronger winds over the North Atlantic are so dangerous
https://arctic-news.blogspot.com/2020/02/why-stronger-winds-over-north-atlantic-are-so-dangerous.html

• Feedbacks in the Arctic
https://arctic-news.blogspot.com/p/feedbacks.html

• September 2015 Sea Surface Warmest On Record
https://arctic-news.blogspot.com/2015/10/september-2015-sea-surface-warmest-on-record.html

• When will we die?
https://arctic-news.blogspot.com/2019/06/when-will-we-die.html

• A rise of 18°C or 32.4°F by 2026?
https://arctic-news.blogspot.com/2019/02/a-rise-of-18c-or-324f-by-2026.html

• Methane Hydrates Tipping Point threatens to get crossed
https://arctic-news.blogspot.com/2020/08/methane-hydrates-tipping-point-threatens-to-get-crossed.html

• Arctic Hit By Ten Tipping Points
https://arctic-news.blogspot.com/2020/04/arctic-hit-by-ten-tipping-points.html

• Crossing the Paris Agreement thresholds
https://arctic-news.blogspot.com/p/crossing.html

• 2°C crossed
https://arctic-news.blogspot.com/2020/03/2c-crossed.html

• Most Important Message Ever
https://arctic-news.blogspot.com/2019/07/most-important-message-ever.html

• Blue Ocean Event
https://arctic-news.blogspot.com/2018/09/blue-ocean-event.html

• Record Arctic Warming
https://arctic-news.blogspot.com/2016/04/record-arctic-warming.html

• There is no time to lose
https://arctic-news.blogspot.com/2020/11/there-is-no-time-to-lose.html

• Temperatures threaten to become unbearable
https://arctic-news.blogspot.com/2020/09/temperatures-threaten-to-become-unbearable.html

• Warning of mass extinction of species, including humans, within one decade
https://arctic-news.blogspot.com/2017/02/warning-of-mass-extinction-of-species-including-humans-within-one-decade.html

• Extinction
https://arctic-news.blogspot.com/p/extinction.html


Sunday, December 13, 2020

The myth of “net zero emissions by 2050”

by Andrew Glikson

[ Oil and gas fracking pads in Texas. Photo: Dennis Dimick ]

It should raise people’s hopes to believe “net zero emissions by 2050” will arrest or at least slow-down global warming, had it not been yet another cruel hoax perpetrated in the wake of more than 50 years of obfuscation and denial of environment and climate science.

This is because:

For this reason, the essential reductions in emission must be accompanied with sequestration of atmospheric greenhouse gases by at least the amount of annual emissions.

The authorities are not listening to what climate science is indicating. Instead they are consulting with economists ignorant of the physics and chemistry of the atmosphere and of the consequences of global heating. An example is the absurd idea as if “a rise of 4°C in global average temperature would be “optimal” when the costs and benefits of mitigating climate change are balanced”.

Currently, CO2 concentrations in the atmosphere are increasing at the approximate rate of 2 to 3 parts per million per year. This leaves the fundamental question unanswered: What, if anything, would halt the fatal progression toward +4 degrees Celsius above pre-industrial temperatures, given that according to the IPCC (cited by the World Bank) a “four degree world would be one of unprecedented heatwaves, severe drought and major floods in many regions”. In perspective, global warming of the 20-21st centuries is at least 70 times faster than the rise of about 5 degrees Celsius over a period of about 7000 years since the last interglacial period. At this rate of environmental change mass extinctions are inevitable. When Professor Hans Joachim Schellnhuber (former climate adviser to the German Chancellor and the EU) was asked about the difference between a +2°C and a +4°C world, he replied: “Human civilization”.


Andrew Glikson

Dr Andrew Glikson
Earth and Paleo-climate scientist
ANU Climate Science Institute
ANU Planetary Science Institute
Canberra, Australia


Books:
The Asteroid Impact Connection of Planetary Evolution
http://www.springer.com/gp/book/9789400763272
The Archaean: Geological and Geochemical Windows into the Early Earth
http://www.springer.com/gp/book/9783319079073
Climate, Fire and Human Evolution: The Deep Time Dimensions of the Anthropocene
http://www.springer.com/gp/book/9783319225111
The Plutocene: Blueprints for a Post-Anthropocene Greenhouse Earth
http://www.springer.com/gp/book/9783319572369
Evolution of the Atmosphere, Fire and the Anthropocene Climate Event Horizon
http://www.springer.com/gp/book/9789400773318
From Stars to Brains: Milestones in the Planetary Evolution of Life and Intelligence
https://www.springer.com/us/book/9783030106027
Asteroids Impacts, Crustal Evolution and Related Mineral Systems with Special Reference to Australia
http://www.springer.com/us/book/9783319745442


Friday, December 4, 2020

Polar-ward climate zones shift and consequent tipping points

by Andrew Glikson

The concept of a global climate tipping point/s implies a confluence of climate change processes in several parts of the world where regional climate changes can combine as a runaway shifts to a new climate state. Conversely the shift of climate zones can constitute the underlying factor that triggers extreme weather events which culminate in tipping points. These shifts include the expansion of the tropics, tropical cyclones, mid-latitude storms and weakening of boundaries of the polar vortex, allowing breach of air masses of contrasting temperatures through the jet stream polar boundary, with ensuing snow storms and heatwaves.

Figure 1. Climate tipping points (McSweeney 2020)

The migration of climate zones toward the poles appears to constitute a major factor in triggering tipping points in the Earth system (Figures 1 and 2), including (from north to south):
  1. permafrost loss 
  2. expansion of the Boreal forest at the expense of the tundra
  3. disintegration of the Greenland ice sheet
  4. breakdown of the Atlantic meridional overturning circulation (AMOC) caused by an increased influx of freshwater into the North Atlantic 
  5. Amazon forest dieback 
  6. West African monsoon shift 
  7. Indian monsoon shift 
  8. Coral reef die-off
  9. West Antarctic ice disintegration
Not included in this list are the increased desertification and the extensive fires in parts of the continents, including the Arctic, Siberia, western North America, the Mediterranean, Brazil and Australia.

Figure 2. Monthly anomalies for October 2020 by NOAA (National Centers for Environmental Information)

A conflation of regional climate developments into global climate tipping point/s, namely a shift in state of the Earth climate is likely, although the details of this process are not clear. Alternatively it is the migration of climate zones toward the poles, indicated by climate zone maps, which is triggering regional events.
Figure 3. High anomalies over the Arctic from Nov. 2019 to Oct. 2020 (NASA image)

Here I list some of these likely relationships: 
  • In the Arctic sea ice extent in October 2020 was lower by 36.8% than during 1981-2010 (Figure 2). High anomalies have hit the Artic Ocean and Siberia over the 12-month period from November 2019 to October 2020 (Figure 3). The warming of the Arctic is driven by (1) a decline in albedo due to ice melt and exposure of open water surfaces; (2) the albedo flip generated by formation of thin water surfaces above ice sheets and glaciers, and (3) the penetration of warm air masses through the weakened circum-Arctic jet stream (Figure 4.). 
  • The tropics are expanding at a rate of near-50 km per decade (Jones 2018) and have widened about 0.5° latitude per decade since 1979 (Staten et al. 2018). With warming and desertification effects across North Africa and the Mediterranean Sea this is leading to draughts and fires in southern Europe. The shift of climate zones toward the poles, at a rate approximately 50 to 100 km per decade, as well as sea level rise, is changing the geography of the planet. Once sea level reaches equilibrium temperatures it will attain at least 25 meters above the present, by analogy to Pliocene level (before 2.6 million years ago).
  • As climate zones shift northward an increase of winter precipitation of up to 35% is recorded in mid to northern Europe during the 21st century, with increases of up to 30% in north-eastern Europe. In 2020 Europe had the warmest October on record and North America the heaviest snow precipitation on record (Figure 2). 
  • In Australia a southward migration of the tropical North Australia climate zone and the high pressure ridge separating it from the southern terrain dominated by the Westerlies and the precipitation-bearing spirals of the Antarctic-sourced vortex southward, with consequent droughts in southern and southwestern parts of the continent. 
Figure 4. The Arctic jet stream, summer, 1988, NASA. Extreme melting in 
Greenland’s ice sheet is linked to warm air delivered by the wandering jet 
stream, a fast-moving belt of westerly winds created by the convergence of 
cold air masses descending from the Arctic and rising warm air masses from 
the tropics that flow through the lower layers of the atmosphere.

As evident from the above the shift in climate zones constitutes the underlying factor which triggers extreme weather events and tipping points.

Figure 5. Arctic surface-air temperature anomalies for July 2020.

Since the onset of the industrial age, in particular since about 1960-70, global warming accelerated at by one to two orders of magnitude faster than during the last glacial termination (~16000 – 8000 years ago) and much earlier. Mass extinction events in the Earth history have occurred when environmental changes took place at a rate to which species could not adapt. Plants and animals are currently dying off at a rate 100 to 1000 times faster than the mean rate of extinction over geological timescales.

The Intergovernmental Panel for Climate Change (IPCC AR5) projects linear warming to 2300 and 2500, which however does not take full account of amplifying feedbacks from a range of sources (Trajectories of the Earth system in the Anthropocene). These include reduced CO2 sequestration in the warming oceans, albedo changes due to melting of ice, enrichment of the atmosphere in water vapor, desiccation and burning vegetation, release of methane from permafrost. Nor do these linear trends take account of the stadial effects of the flow of cold ice melt water into the oceans (Glikson, 2019).

According to the National Oceanic and Atmospheric Agency (NOAA) global warming has accelerated significantly during 2015-2020. The danger inherent in temperature rise to about 4 degrees Celsius by 2100 is underpinned by the consequences at lower temperature rise of +1 to +2 degrees Celsius, already in evidence. Thus, whereas the mean land-ocean temperature rise between 1880-2020 is +1.16 degrees Celsius, the average rise in continental temperatures during this period has already reached +1.6 degrees Celsius, beyond the upper limit proposed by the Paris Accord. The rise in temperatures is driving a three-fold to six-fold rise in extreme weather events since 1980 (Figure 6.), including severe storms, tropical storms, flooding, droughts and wildfires (NOAA 2018).

Figure 6. The growth in the frequency of extreme weather events in the US during 1980-2018

Large-scale melting of the Greenland and Antarctica ice sheets, discharging cold ice melt water, is already cooling of parts of the oceans. The clash between cold air masses and tropical fronts would increase storminess, in particular along coastal boundaries and islands. Such storminess, along with intensified tropical cyclones, would render island chains increasingly vulnerable.

To date most suggestions for mitigation and adaptation are woefully inadequate to arrest global warming. Reductions in carbon emissions, which are absolutely essential, may no longer be adequate to arrest accelerating greenhouse gas and temperature levels. At the current level of carbon dioxide (>500 parts per million equivalent CO2+methane+nitrous oxide), reinforced by amplifying feedbacks from land and oceans, the remaining option would be to sequester (down-draw) greenhouse gases from the atmosphere.

A global imperative.


Andrew Glikson

Dr Andrew Glikson
Earth and Paleo-climate scientist
ANU Climate Science Institute
ANU Planetary Science Institute
Canberra, Australia


Books:
The Asteroid Impact Connection of Planetary Evolution
http://www.springer.com/gp/book/9789400763272
The Archaean: Geological and Geochemical Windows into the Early Earth
http://www.springer.com/gp/book/9783319079073
Climate, Fire and Human Evolution: The Deep Time Dimensions of the Anthropocene
http://www.springer.com/gp/book/9783319225111
The Plutocene: Blueprints for a Post-Anthropocene Greenhouse Earth
http://www.springer.com/gp/book/9783319572369
Evolution of the Atmosphere, Fire and the Anthropocene Climate Event Horizon
http://www.springer.com/gp/book/9789400773318
From Stars to Brains: Milestones in the Planetary Evolution of Life and Intelligence
https://www.springer.com/us/book/9783030106027
Asteroids Impacts, Crustal Evolution and Related Mineral Systems with Special Reference to Australia
http://www.springer.com/us/book/9783319745442


Wednesday, November 25, 2020

There is no time to lose

Carbon dioxide levels continue at record levels, despite COVID-19 lockdown, the WMO reports. The increase in carbon dioxide from 2018 to 2019 was larger than that observed from 2017 to 2018 and larger than the average annual growth rate over the last decade.

The rise has continued in 2020. The lockdown did cut emissions of many pollutants and greenhouse gases, but any impact on carbon dioxide levels - the result of cumulative past and current emissions - is in fact no bigger than the normal year to year fluctuations. 

“Carbon dioxide remains in the atmosphere for centuries and in the ocean for even longer. The last time the Earth experienced a comparable concentration of CO₂ was 3-5 million years ago, when the temperature was 2-3°C warmer and sea level was 10-20 meters higher than now. But there weren’t 7.7 billion inhabitants,” said WMO Secretary-General Professor Petteri Taalas.

“The COVID-19 pandemic is not a solution for climate change. However, it does provide us with a platform for more sustained and ambitious climate action to reduce emissions to net zero through a complete transformation of our industrial, energy and transport systems. The needed changes are economically affordable and technically possible and would affect our everyday life only marginally. It is to be welcomed that a growing number of countries and companies have committed themselves to carbon neutrality,” he said. “There is no time to lose.”


Above image illustrates the steep rise in methane, compared to carbon dioxide and nitrous oxide. Levels of carbon dioxide, methane and nitrous oxide reached new highs in 2019, reports the WMO. Carbon dioxide (CO₂) rose to 410.5 ppm (148% of its pre-industrial level), methane (CH₄) to 1877 ppb (260% of pre-industrial) and nitrous oxide (N₂O) to 332.0 ppb (123% of pre-industrial).

So, given that there's no time to lose, why mention carbon neutrality, and not 100% clean, renewable energy? Also, let's not lose sight of other emissions such as N₂O. Yes, dramatic cuts in CO₂ emissions do need to happen rapidly, and yes, this does require a complete transformation of industry, energy and transport. Nonetheless, N₂O emissions are also important and most N₂O emissions result from land use, such as food production and waste handling, which must also change. 

[ from earlier post ]
The IPCC (AR5) gave N₂O a lifetime of 121 years and a 100-year global warming potential (GWP) of 265 times that of carbon dioxide. Furthermore, N₂O also causes stratospheric ozone depletion. 

The IPCC, in special report Climate Change and Land, found that agriculture, forestry and other land use activities accounted for some 13% of CO₂, 44% of CH₄, and 82% of N₂O emissions from human activities globally during 2007-2016, representing 23% of total net anthropogenic emissions of greenhouse gases.

If emissions associated with pre- and post-production activities in the global food system are included, the emissions could be another 14% higher, i.e. as high as 37% of total net anthropogenic greenhouse gas emissions, the IPCC added.

Let's get back to that 23%. The IPCC calculates this 23% by using a GWP of 28 for CH₄. Over the first few years, however, the GWP of CH₄ is more than 150, as discussed in an earlier post. When using a GWP of 150, land use emissions rise from 23% to 31%, as the image on the right shows. Add another 14% from further food-related emissions and the total share for land use becomes 45% of people's emissions. 

[ click on images to enlarge ]
In other words, all polluting emissions need to be reduced. Moreover, a recent paper by Jorgen Randers et al. points out that, even if all greenhouse gas emissions by people could stop immediately and even if the temperature anomaly could fall to 0.5°C above pre-industrial, greenhouse gas levels would start rising again after 2150 and keep rising for centuries to come. Another recent paper, by Tapio Schneider et al., points out that solar geoengineering may not prevent strong warming from direct effects of CO₂ on stratocumulus cloud cover. 

This means that the threat is even more menacing when including large methane releases that threaten to occur as temperatures keep rising in the Arctic and sediments at the seafloor of the Arctic Ocean threaten to get destabilized, resulting in the eruption of huge amounts of methane. 

What is the joint impact of carbon dioxide and methane? The WMO reported CO₂ levels of 410.5 ppm and CH₄ levels of 1877 ppb in 2019. As discussed in an earlier post, over the first few years after release, methane's GWP is more than 150 times higher than carbon dioxide. Accordingly, the 2019 level of 1877 ppb of methane translates into global heating of 281.55 ppm CO₂e. Together, that makes 692.5 ppm CO₂e, which is 507.5 ppm CO₂e away from the 1200 ppm CO₂e cloud tipping point

The image below illustrates that the joint impact of carbon dioxide and methane could cause the 1200 ppm CO₂e tipping point to be crossed in 2040. The image uses IPCC and WMO through 2019 to display three lines, with added trends: 
- Black line: CO₂ in parts per million (ppm);
- Red line: CH₄ in ppm CO₂e, using a GWP of 150;
- Purple line: CO₂ and CH₄ in ppm CO₂e.

Trends for CH₄ are selected to reflect a steep rise as a result of methane hydrate destabilization. 

How could such a steep rise in methane levels occur?

Stronger methane releases from subsea permafrost can be expected, says a paper by Natalia Shakhova et al. A 1000-fold methane increase could occur, resulting in a rise of as much as 6°C within 80 years, with more to follow after that, according to a paper by Atsushi Obata et al.

Seafloor methane releases could be triggered by strong winds causing an influx of warm, salty water into the Arctic ocean (see this earlier post and this page). 

Since little hydroxyl is present in the atmosphere over the Arctic, it is much harder for this methane to get broken down.

Even relatively small methane releases could cause tremendous heating, if they reach the stratosphere.

Methane rises from the Arctic Ocean concentrated in plumes, pushing away the aerosols and gases that slow down the rise of methane elsewhere, which enables methane erupting from the Arctic Ocean to rise straight up fast and reach the stratosphere. 

The IPCC (AR5) gave methane a lifetime of 12.4 years. The IPCC (TAR) gave stratospheric methane a lifetime of 120 years, adding that less than 7% of methane did reach the stratosphere at the time.

The images on the right illustrate this. On November 20 pm, 2020, the MetOp-1 satellite recorded high methane levels over the Arctic Ocean at 293 mb (top image on the right). This corresponds with an altitude of some 9 km altitude, which is where the Stratosphere starts at the North Pole. The global mean methane level at that altitude was 1921 ppb.

The next images show areas with high levels of methane, as indicated by the magenta color, remaining present over the Arctic Ocean even at higher altitudes.

The higher the altitude, the more methane will concentrate over the Equator. Yet at 229 mb, high methane levels are still visible north of Siberia, while global mean methane levels were still very high, i.e. 1916 ppb. 

Even at 156 mb, there still are high methane levels visible (green circle, third image right). 

The conversion table shows that the Tropopause, which separates the Troposphere from the Stratosphere, is lower over the North Pole (at about 9 km altitude) than over the Equator (17 km altitude). 

The fifth image on the right, from an earlier post, shows that methane has accumulated more at higher altitudes over the years. 

The sixth image on the right shows that the MetOp-1 satellite recorded mean methane levels of 1925 ppb at 293 mb on December 2, 2020 am, with high methane levels present over the Arctic Ocean.

The next image shows that a peak methane level of 2715 ppb was recorded by the SNPP satellite on November 30, 2020 pm at 399.1 mb.

The animation on the right shows high methane levels recorded by the MetOp-2 satellite on December 2, 2020 pm, at a number of altitudes: 

- At 1000 mb (close to ground/sea level) a peak methane level of 2129 ppb shows up north of Svalbard. 

- At 918 mb, methane peaks at 2408 ppb and high methane levels show up over the Artic Ocean.

- At 815 mb, methane reaches a peak of 2582 ppb and high methane levels are visible over larger parts of the Arctic Ocean. 

- At 742 mb, methane reaches a peak of 2663 ppb and high methane levels are visible over even larger parts of the Arctic Ocean. 

- At 586 mb, methane reaches a peak of 2518 ppb and high methane levels are visible over a huge part of the Arctic Ocean, while hardly any high levels of methane are visible over land. 

- At 293 mb, methane reaches a peak of 2411 ppb and high levels of methane are still visible over the Arctic Ocean, even at this high altitude. 

[ from earlier post ]
In conclusion, a huge temperature rise could occur soon, even with a relatively small increase in carbon dioxide and methane releases. 

As above image illustrates, a temperature rise of more than as 10°C could eventuate as soon as 2026 when taking into account aerosol changes, albedo changes, water vapor, nitrous oxide, etc., as an earlier analysis shows. 

The joint impact of these warming elements threatens the cloud tipping point to be crossed and the resulting 8°C rise would then come on top of the 10°C rise, resulting in a total rise of 18°C, as illustrated by the image on the right, from an earlier post.

Indeed, there is no time to lose. It is high time to stop the denial of the size of the threats and challenges that the world faces, the harm inflicted and the speed at which developments could strike. 

The situation is dire and calls for immediate, comprehensive and effective action, as described in the Climate Plan


• WMO Greenhouse GasBulletin
https://public.wmo.int/en/resources/library/wmo-greenhouse-gas-bulletin

• WMO news release: Carbon dioxide levels continue at record levels, despite COVID-19 lockdown
https://public.wmo.int/en/media/press-release/carbon-dioxide-levels-continue-record-levels-despite-covid-19-lockdown

• Understanding the Permafrost–Hydrate System and Associated Methane Releases in the East Siberian Arctic Shelf, by Natalia Shakhova, Igor Semiletov and Evgeny Chuvilin (2019)
https://www.mdpi.com/2076-3263/9/6/251

• Damage of Land Biosphere due to Intense Warming by 1000-Fold Rapid Increase in Atmospheric Methane: Estimation with a Climate–Carbon Cycle Model - by Atsushi Obata et al. (2012) 
https://journals.ametsoc.org/doi/full/10.1175/JCLI-D-11-00533.1

• Possible climate transitions from breakup of stratocumulus decks under greenhouse warming, by Tapio Schneider et al. (2019)
https://www.nature.com/articles/s41561-019-0310-1

• Solar geoengineering may not prevent strong warming from direct effects of CO2 on stratocumulus cloud cover - by Tapio Schneider et al. 
https://www.pnas.org/content/early/2020/11/10/2003730117

• An earth system model shows self-sustained thawing of permafrost even if all man-made GHG emissions stop in 2020 - by Jorgen Randers et al.
https://www.nature.com/articles/s41598-020-75481-z


Monday, November 16, 2020

Accelerated global warming and stadial cooling events: IPCC oversights regarding future climate trends

 by Andrew Glikson

The linear nature of global warming projections by the IPCC (2014) Assessment Report (AR5) (Figure 1) appears to take little account of stadial cooling events, such as have followed peak temperature rises in previous interglacial stages. The linear trends appear to take only limited account of amplifying positive feedback effects of the warming from land and ocean. A number of factors cast doubt on IPCC climate change projections to 2100 AD and 2300 AD, including:
Figure 1 (a) IPCC average surface temperature change to 2100 relative to 1986-2005 IPCC AR5;
(b) IPCC average surface temperature change to 2300 relative to 1986-2005 IPCC AR5

However, global temperature measurements for 2015-2020 indicate accelerated warming due to both the greenhouse effect reinforced by a solar radiation maximum (Hansen and Sato 2020) (Figure 2).

Figure 2. Accelerated Global Warming reinforced by both greenhouse 
gases and a solar maximum Hansen and Sato, 2020

The weakening of the northern Jet stream, due to polar warming and thus reduced longitudinal temperature contrasts, allows penetration of warm air masses into the polar region and consequent fires (Figure 3). The clash between tropical and polar air and water masses (Figure 3A) leads to regional storminess and contrasting climate change trajectories in different parts of the Earth, in particular along land-ocean boundaries and island chains. 

The weakening of the jet stream and migration of climate zones constitute manifestations of an evolving Earth’s energy imbalance¹, namely a decrease in reflection of solar radiation from Earth to space and thereby global warming. Earth retained 0.6 Watt/m² during 2005-2010 and 0.87 Watt/m² during 2010-2020 (Hansen and Sato 2020), primarily due to a rise in greenhouse gases but also due to a solar radiation peak. During 2015-2020 global warming rates exceeded the 1970-2015 warming rate of 0.18°C/per decade, a deviation greater than climate variability. Hansen and Sato (2020) conclude the accelerated warming is caused by an increasing global climate forcing, specifically by the role of atmospheric aerosols.

Figure 3 A. Undulating and weakening jet stream and the polar vortex and penetration
of warm air, inducing Arctic warming and fires.     B. Satellite images of Wildfires
ravaging parts of the Arctic
, with areas of Siberia, Alaska, Greenland and Canada
engulfed in flames and smoke. While wildfires are common at this time of year, record-
breaking summer temperatures and strong winds have made 2020 fires particularly bad.

Bronselaer et al., 2018 modelled a meltwater-induced cooling of the southern hemisphere toward the end 21st century by as low as -1.5°C (Figure 4A). Hansen et al. 2016 estimated the time frame of 21st century stadial cooling event as dependent on the rates of ice melt (Figure 4B), reaching near global extent toward the end of the century (Figure 4C).

Figure 4 A. 2080–2100 meltwater-induced sea-air temperature anomalies relative to
the standard RCP8.5 ensemble (Bronselaer et al., 2018). Hatching indicates where the
anomalies are not significant at the 95% level;  B. Negative temperature anomalies
through the 21st-22nd centuries signifying stadial cooling intervals (Hansen et al., 2016);
C. A model of Global warming for 2096, where cold ice melt water occupies large parts
of the North Atlantic and circum-Antarctica, raises sea level by about 5 meters and
decreases global temperature by -0.33°C (Hansen et al., 2016).

With the concentration of greenhouse gases rising by approximately 47% during the last century and a half, faster than almost any observed rise in the Cenozoic geological record, the term “climate change” refers to an extreme shift in state of the atmosphere-ocean system. The greenhouse gas rise and temperature rise rates are faster than those of the K-T mass extinction, the Paleocene-Eocene extinction and the last glacial termination.

The consequences for future climate change trends include:
  • Further expansion of the tropical climate zones and a polar-ward shift of intermediate climate zones, leading to encroachment of subtropical deserts over fertile Mediterranean zones. 
  • Spates of regional to continent-scale fires, including in Brazil, Siberia, California, around the Mediterranean, Australia.
  • A weakened undulating jet stream (Figure 3) allowing penetration of and clashes between warm and cold air and water masses, with ensuing storms. 
  • In Australia the prolonged drought, low vegetation moisture, high temperatures and warm winds emanating from the northern Indian Ocean and from the inland, rendering large parts of the continent tinder dry and creating severe fire weather subject to ignition by lightning.
  • The delayed melting of the large ice sheets due to hysteresis², would be followed by sea level rise to Pliocene levels, ~25 meters above pre-industrial levels, once sea level reaches equilibrium with temperature of 2 to 3 degrees Celsius or higher, changing the geography of the continents.
It would follow from these considerations that succeeding periods of peak temperatures, extensive melting of the ice sheets, flow of ice melt into the oceans and thereby stadial cooling would lead to clashes between tropical fronts and cooling masses of air, producing storminess, in particular along continental margins and island chains. The modelled time frame of these developments (Figure 4B) may be cyclical, or may extend further in time and place as long as the ice sheets continue to breakdown.


¹ Earth's energy imbalance is the difference between the amount of solar energy
absorbed 
by Earth and the amount of energy the planet radiates to space as heat.
If the imbalance is 
positive, more energy coming in than going out, we can expect
Earth to become warmer in t
he future — but cooler if the imbalance is negative.
² Hysteresis is the dependence of the state of a system on its history. For example the 
melting of an ice sheet may occur slowly depending on its previous state.

Andrew Glikson

Dr Andrew Glikson
Earth and Paleo-climate scientist
ANU Climate Science Institute
ANU Planetary Science Institute
Canberra, Australia


Books:
The Asteroid Impact Connection of Planetary Evolution
http://www.springer.com/gp/book/9789400763272
The Archaean: Geological and Geochemical Windows into the Early Earth
http://www.springer.com/gp/book/9783319079073
Climate, Fire and Human Evolution: The Deep Time Dimensions of the Anthropocene
http://www.springer.com/gp/book/9783319225111
The Plutocene: Blueprints for a Post-Anthropocene Greenhouse Earth
http://www.springer.com/gp/book/9783319572369
Evolution of the Atmosphere, Fire and the Anthropocene Climate Event Horizon
http://www.springer.com/gp/book/9789400773318
From Stars to Brains: Milestones in the Planetary Evolution of Life and Intelligence
https://www.springer.com/us/book/9783030106027
Asteroids Impacts, Crustal Evolution and Related Mineral Systems with Special Reference to Australia
http://www.springer.com/us/book/9783319745442