Showing posts with label Arctic Ocean. Show all posts

Sunday, September 22, 2024

High temperatures despite La Niña?


[ click on images to enlarge ]
Temperatures remain extremely high, even though La Niña conditions may already be present, as illustrated by the above image, showing sea surface temperature anomalies (SSTA) versus 1981-2011. 

The image on the right shows the Northern Hemisphere (-90°,90°) with SSTA as high as 24.8°F (13.8°C) in Hudson Bay (green circle) on Sep. 22, 2024. There are only very few cold spots, while massive amounts of ocean heat are present in the North Atlantic and the North Pacific. 

On September 26, 2024, the sea surface temperature (60°S-60°N, 0-360°E) was 20.97°C, a record high for the time of year and 0.83°C above the 1982-2010 average, as illustrated by the image below. 


North Atlantic (0-60°N 0-80°W) sea surface temperature anomalies remained high and reached a record high for the time of year on September 26, 2024, as illustrated by the image below (SSTA vs 1882-2011).


The image below shows that the North Atlantic sea surface reached a temperature of 24.97°C (76.95°F) on September 22, 2024, a record high for the time of year and 1.07°C (1.926°F) above 1991-2020 or 1.3°C (2.34°F) above 1981-2010. The image also shows a 0.23°C difference in anomalies when shifting the base by a decade, indicating that the anomaly would be much higher when calculated from a pre-industral base. 
 

The image below, by Brian McNoldy shows that ocean heat content in the Gulf of Mexico was at a record high for the time of year on September 23, 2024. 


La Niña conditions may already be present

The black dashed line in the image below, adapted from NOAA, indicates a transition to La Niña in October 2024, persisting through Jan-Mar 2025.


The image below, adapted from NOAA, illustrates that El Niño conditions were present from June 2023 through April 2024, and that ENSO-neutral started in May 2024.


While El Niños typically occur every 3 to 5 years, as NOAA explains, El Niños can occur as frequently as every two years, as happened in 2002, 2004 and 2006, as the above image shows. Moving from the bottom of a La Niña to the peak of a strong El Niño could make a difference of more than 0.5°C.

The danger is that we could move into a new El Niño in 2025, while sunspots move toward a peak and while temperatures remain high due to Earth's high Energy Imbalance and due to feedbacks, as discussed in a recent post. The peak in sunspots in this cycle is expected to occur in July 2025, at which time Arctic sea ice may disappear, triggering further feedbacks, leading to a huge temperature rise by end 2026 that could drive humans into extinction. 


The above image from Copernicus illustrates that, for many months, the temperature anomaly has been high, i.e. about 0.8°C (± 0.3°C) above the 1991-2020 average and much more when compared to a pre-industrial base, with little or no sign of a return to earlier temperatures.


The above image illustrates that global daily mean near-surface (2m) air temperature anomalies vs 1991-2020 (Copernicus) have been above about 0.5°C for almost 16 consecutive months, i.e. since El Niño started (in June 2023, blue shade) and under ENSO-neutral conditions (starting May 2024). La Niña is expected to start October 2024 and the added trends point at a continued rise.   

The danger of methane hydrates getting destabilized

[ click on images to enlarge ]
The image on the right shows sea surface temperatures as high as 32.6°C on September 21, 2024. The image also shows the Gulf Stream pushing ocean heat toward the Arctic Ocean.

This flow of ocean heat can be accelerated by storms that are amplified due to high sea surface temperatures, deformation of the Jet Stream and a freshwater lid forming at the surface of the North Atlantic. 

At the same time, Arctic sea ice starts expanding rapidly in extent at this time of year, effectively sealing off the Arctic Ocean and making it hard for heat to get transferred from the surface of the Arctic Ocean to the atmosphere. 

As discussed in earlier posts, Arctic sea ice has become very thin, diminishing its capacity to act as a buffer that consumes ocean heat entering the Arctic Ocean from the North Atlantic. 

Sea ice constitutes a latent heat buffer, consuming incoming heat as it melts. While the ice is melting, all energy (at 334 J/g) goes into changing ice into water and the temperature remains the same. Once all ice has turned into water, all subsequent energy goes into heating up the water, and will do so at 4.18 J/g for every 1°C the temperature of the water rises.

Ocean heat that was previously consumed by melting the sea ice, can no longer get consumed by melting of the sea ice once Arctic sea ice has become very thin, and further incoming heat instead gets absorbed by the Arctic Ocean, rapidly pushing up the temperature of the water of the Arctic Ocean.

The danger is that, as the water of the Arctic Ocean keeps heating up, more heat will reach the seafloor and destabilize methane hydrates contained in sediments at the seafloor, resulting in eruptions of huge amounts of methane. 

The image below illustrates how incoming ocean heat that previously was consumed in the process of melting of the sea ice, is now causing the water of the Arctic Ocean to heat up, with more heat reaching the seafloor of the Arctic Ocean, which has seas that in many places are very shallow.
[ Latent heat loss, feedback #14 on the Feedbacks page ]

Eruptions from hydrates occur at great force, since the methane expands 160 times in volume when it vaporizes, resulting in the methane rapidly rising in the form of plumes, leaving little or no opportunity for microbes to decompose the methane in the water column, which especially applies to the many areas where the Arctic Ocean is very shallow. Furthermore, the atmosphere over the Arctic contains very little hydroxyl, resulting in methane persisting in the air over the Arctic much longer than elsewhere.

Climate Emergency Declaration

The situation is dire and the precautionary principle calls for rapid, comprehensive and effective action to reduce the damage and to improve the situation, as described in this 2022 post, where needed in combination with a Climate Emergency Declaration, as discussed at this group.


Links

• Nullschool
https://earth.nullschool.net

• Climate Reanalyzer
https://climatereanalyzer.org

• Ocean Heat Content - by Brian McNoldy
https://bmcnoldy.earth.miami.edu/tropics/ohc

• NOAA - Climate Prediction Center - ENSO: Recent Evolution, Current Status and Predictions
https://www.cpc.ncep.noaa.gov/products/analysis_monitoring/lanina/enso_evolution-status-fcsts-web.pdf


Monday, December 5, 2022

Arctic Ocean overheating

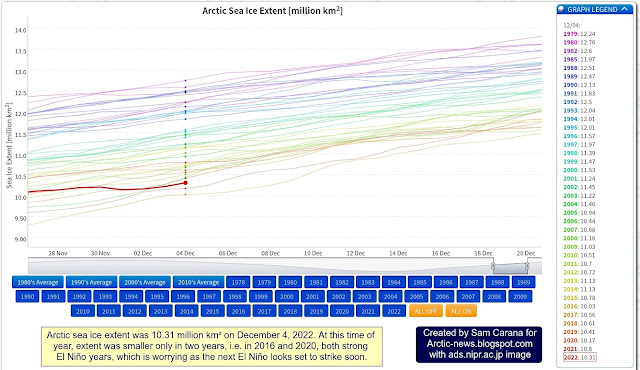
Arctic sea ice extent was 10.31 million km² on December 4, 2022. At this time of year, extent was smaller only in two years, i.e. in 2016 and 2020, both strong El Niño years. With the next El Niño, Arctic sea ice extent looks set to reach record lows. 


The NOAA image on the right indicates that, while we're still in the depths of a persistent La Niña, the next El Niño looks set to strike soon.

The image below shows high sea surface temperature anomalies near the Bering Strait on December 2, 2022, with a "hot blob" in the North Pacific Ocean where sea surface temperature anomalies are reaching as high as 7°C or 12.6°F from 1981-2011. The Jet Stream is stretched out vertically from pole to pole, enabling hot air to enter the Arctic from the Pacific Ocean and from the Atlantic Ocean.


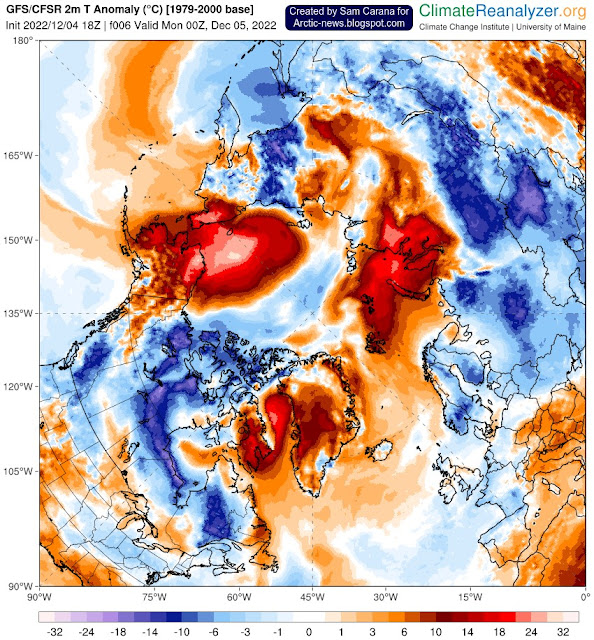
The image below shows a forecast for December 5, 2022, of 2m temperature anomalies versus 1979-2000, with anomalies over parts of the Arctic Ocean near the top end of the scale.


On December 6, 2022, the Arctic was 6.63°C or 11.93°F warmer compared to 1979-2000, as illustrated by the image below. 


The image below shows the daily average Arctic air temperature (2m) from 1979 up to December 6, 2022.


Given that we're still in the depth of a persistent La Niña, these currently very high air temperature anomalies indicate that ocean temperatures are very high and that ocean heat is heating up the air over the Arctic. 

Additionally, ocean heat is melting the sea ice from below. 

Accordingly, Arctic sea ice has barely increased in thickness over the past 30 days, as illustrated by the navy.mil animation on the right.

This leaves only a very short time for Arctic sea ice to grow back in thickness before the melting season starts again, which means that there will be little or no latent heat buffer to consume heat when the melting season starts. 

Furthermore, rising temperatures and changes to the Jet Stream contribute to formation of a freshwater lid at the sea surface at higher latitudes, resulting in further heating up of the Arctic Ocean. 

As a result, more heat threatens to penetrate sediments at the seafloor of the Arctic Ocean that contain vast amounts of methane in hydrates and free gas, and result in abrupt release of huge amounts of methane, dramatically pushing up temperatures globally. 

[ The Buffer has gone, feedback #14 on the Feedbacks page ]

The situation is dire and the right thing to do now is to help avoid or delay the worst from happening, through action as described in the Climate Plan.


Links

• Vishop sea ice extent
https://ads.nipr.ac.jp/vishop/#/extent

• NOAA ENSO: Recent Evolution, Current Status and Predictions
https://www.cpc.ncep.noaa.gov/products/analysis_monitoring/lanina/enso_evolution-status-fcsts-web.pdf

• nullschool.net
https://earth.nullschool.net

• Climate Reanalyzer
https://climatereanalyzer.org

• Naval Research Laboratory - HYCOM Consortium for Data-Assimilative Ocean Modeling
https://www7320.nrlssc.navy.mil/GLBhycomcice1-12/arctic.html

• Albedo, latent heat, insolation and more

• Cold freshwater lid on North Atlantic

Thursday, September 29, 2022

Crossing 3C

The Northern Hemisphere is where most people live. Furthermore, most people live on land. Let's first look at the temperature rise on the Northern Hemisphere. 

The image below, created with a September 30, 2022 screenshot from NASA customized analysis plots, shows June-July-August temperature anomalies from 1880-1920 on the Northern Hemisphere with June-July-August 2022 highlighted with an anomaly of 1.4°C or 2.52°F, a record high in a tie with 2020. 


Secondly, most people live on land. The image below shows the monthly mean global surface temperature anomaly on land. It is similarly created with a September 30, 2022 screenshot from NASA customized analysis plots and shows a peak anomaly from 1880-1920 of 2.95°C or 5.31°F (for February 2016, land only).


The year 2016 was an El Niño year. During an El Niño, temperatures are higher than usual. We are currently in the depths of a persistent La Niña, which suppresses temperatures. We look set to move into another El Niño within years. 

In conclusion, the temperature rise on land on the Northern Hemisphere looks set to cross 3°C soon, the more so since we are also facing a peak in sunspots (by 2025), which may coincide with peak temperatures associated with the upcoming El Niño. Also keep in mind that the above temperature anomalies are measured from 1880-1920, so the temperature rise from pre-industrial is significantly higher than that. 


There are further events and developments that could additionally speed up the temperature rise, as discussed at the extinction page. Humans are likely to go extinct with a rise of 3°C, as illustrated by the above image, from an analysis discussed in an earlier post.

Methane levels keep rising

The image below, from an earlier post, shows annual global mean methane with a trend added that points at a methane rise that could in 2028 represent a forcing of 780 ppm CO₂e (with a 1-year GWP of 200).

In other words, the clouds tipping point at 1200 ppm CO₂e could be crossed in 2028 due to the forcing of methane and CO₂ alone, assuming that CO₂ concentration in 2028 will exceed 420 ppm. Moreover, this could happen even earlier, since there are further forcers, while there also are further events and developments that could additionally speed up the temperature rise, as discussed in earlier posts such as this one. Furthermore, the NOAA data used in the above image rise are for marine surface measurements. Methane is accumulating at higher altitude, as illustrated by the compilation images below. 


The top image of above compilation image shows that the MetOp-B (also known as MetOp-1) satellite recorded a mean methane concentration of 1979 parts per billion (ppb) at 293 mb on September 30, 2022 pm. 

The above compilation image shows high concentrations of methane close to sea level, all the way up to the Tropopause. Does this indicate that methane is rising up from the seafloor of the Arctic Ocean?  

Polar Jet Stream (blue) and Subtropical
Jet Stream (red) - NOAA image
Let's first take a look at prevailing wind pattern and how they changed. On the Northern Hemisphere, the coldest point used to be the North Pole, so wind used to flow from the tropics to the North Pole.

This and the deflection due to the Coriolis force resulted in two Jet Streams forming, circumnavigating the globe in what used to be narrow and straight bands, i.e. the Polar Jet Stream at 60° North and the Subtropical Jet Stream at about 30°, both on the Northern and Southern Hemisphere, resulting in a total of four Jet Streams.

The Jet Stream used to circumnavigate the globe in narrow and straight bands, predominantly following a path from East to West, in line with its strength and with this deflection.

Polar Jet Stream and Subtropical Jet Stream - NOAA image
The Jet Stream used to circumnavigate the globe at specific latitudes, as illustrated by the images on the right.

Prevailing wind patterns cause carbon dioxide to accumulate at the poles, as illustrated by the image underneath on the right that shows a high carbon dioxide concentration of 235 ppm over the North Pole. 

Some things changed as, due to emissions by people, the difference in temperature between the Arctic and the Tropics narrowed. 

This decreases the speed at which heat is moving to the North on the Northern Hemisphere and it deforms the Jet Stream and the prevailing wind patterns, which can make it even more easy for methane that is released from the Arctic Ocean to rise up and accumulate at the Tropopause, and move from there toward the Equator as it rises. 

Emissions by people are also causing the Troposhere to expand. 

Note the important difference in weight between carbon dioxide and methane. Carbon dioxide tends to accumulate at lower altitudes since it is heavier than air. Methane, on the other hand, is lighter than air, causing methane to rise and accumulate at altitudes near the Tropopause, from where methane moves closer to the Equator, since the Tropopause is higher in altitude at the Tropics than at the Poles. 

The accumulation of methane at higher altitudes is further illustrated in the compilation image below that shows that methane mean levels are highest where the troposphere ends over the Arctic. 


The situation is dire and the right thing to do now is to help avoid or delay the worst from happening, through action as described in the Climate Plan.


Links

• NASA - GISS Surface Temperature Analysis
https://data.giss.nasa.gov/gistemp/graphs_v4/customize.html

• Cataclysmic Alignment
https://arctic-news.blogspot.com/2022/06/cataclysmic-alignment.html

• Sunspots
https://arctic-news.blogspot.com/p/sunspots.html

• Pre-industrial
https://arctic-news.blogspot.com/p/pre-industrial.html

• When will we die?
https://arctic-news.blogspot.com/2019/06/when-will-we-die.html

• Extinction
https://arctic-news.blogspot.com/p/extinction.html

• Blue Ocean Event 2022?

• Jet Stream

• nullschool.net

Friday, December 23, 2016

Accelerating Warming of the Arctic Ocean


Stronger Winds causing further Warming of the Arctic Ocean

Warming is accelerating in the Arctic. On December 22, 2016, the Arctic was on average 3.33°C or 5.99°F warmer than it was in 1979-2000.


Within the Arctic, the Arctic Ocean is warming most rapidly. The image below gives a snapshot of the situation on December 22, 2016 at 06:00 UTC. The Arctic as a whole was as much as 3.34°C or 6.01°F warmer than in 1979-2000. At the same time, temperatures over much of the Arctic Ocean were at the top end of the scale, i.e. as much as 30°C or 54°F warmer than in 1979-2000 (pink color at 90°N latitude).


The temperature in the Arctic (north of 80°N Latitude) is also illustrated by the image below. The red line of the temperature for 2016, up to December 22, 2016. The green line is the 1958-2002 temperature.


Over the entire year 2016, warming was most profound over the Arctic Ocean, which was more than 2.5°C or 4.5°F warmer than 1981-2010, as illustrated by the image below.


The animation below illustrates how this anomaly developed over the past few years, each time showing a 365-day period, starting in 2014 and each time shifted by roughly one month.


These high temperatures over the Arctic Ocean reflect warm water of the Arctic Ocean, with heat added from the Atlantic Ocean and the Pacific Ocean. The image below shows ocean warming, with temperatures rising particularly rapidly on the Northern Hemisphere.

[ Ocean warming, from earlier post ]
Warmer water of the Atlantic Ocean is pushed by the Coriolis force toward the Arctic Ocean. The huge amounts of energy entering the oceans translate not only into higher temperatures of the water and of the air over the water, but also into higher waves and stronger winds.


Above image shows winds on December 29, 2016.

[ click on images to enlarge ]
As above image shows, waves were as high as 7.65 m or 25.1 ft in between Norway and Svalbard on December 29, 2016.


Sea surface temperatures west of Svalbard were as high as 14.6°C (58.2°F) on December 29, 2016. Sea surface temperature went up at the end of December at this spot, while the longer-term average went down in line with the change in seasons.


Underneath the surface of the North Atlantic, the water is much warmer than at the surface, and this temperature difference increases as winds get stronger and cause stronger evaporation, which has a cooling effect on the sea surface. This is illustrated by the image below, showing both the North Pacific and the North Atlantic on November 28, 2016.


The fact that the North Pacific shows a huge cold area, while the cold area in the North Atlantic has virtually disappeared, suggests that the cold area in the North Pacific is not the result of melt-water. The path of the cold areas and the low temperatures over the continents at higher latitudes, give further indications that strong winds are causing such cold areas. The image below shows that a cold area reappearing in the North Atlantic as it gets hit by strong winds (see video further below).


Above images and the image below, from an earlier post, illustrate how stronger evaporation and the resulting precipitation, at times in combination with melt-water, could create cold freshwater lids on both the North Atlantic and the North Pacific. The situation in the North Atlantic is very dangerous, as such a lid can cause much more heat to get carried into the Arctic Ocean underneath the sea surface of the North Atlantic, due to reduced heat transfer to the atmosphere from water on its way to the Arctic Ocean.


The image below, from an earlier post,  shows the depth of Barents Sea, which is relatively shallow around Svalbard.


As the image on the right shows, this spot warms up due to a sea current that brings warm water from the North Atlantic into the Arctic Ocean.

Above images give an indication of the temperature of the water in the Atlantic Ocean underneath the sea surface, as the water comes to the surface near Svalbard, as also illustrated by the plot on the right.

The Arctic Ocean is now warming underneath the sea ice due to the inflow of warm water from the Atlantic Ocean and the Pacific Ocean.

The Arctic Ocean is also warming due to feedbacks such as increased levels of water vapor in the atmosphere, warmer river water running into the Arctic Ocean and soot from wildfires that can settle on snow and ice, resulting in further albedo changes.

Further feedbacks of global warming include warmer air temperatures, higher waves and stronger winds that all speed up the demise of snow and ice.

Stronger winds are pushing warm water from the North Atlantic into the Arctic Ocean. Why are these winds getting stronger? As the Arctic warms faster than the rest of the world, the temperature difference between the Arctic and the Equator decreases, making the Jet Stream wavier, with longer loops extending to the north and to the south. At the same time, the temperature difference between the oceans and the continents (Europe, Asia and North America) is increasing, speeding up the Jet Stream as it travels, e.g., over the North Atlantic towards the Arctic Ocean.

[ click on images to enlarge ]
The above 14.6°C SST on December 29, 2016, near Svalbard is the result of warm water being pushed from the North Atlantic into the Arctic Ocean. The situation is illustrated by the above combination image that shows that the Jet stream is forecast to reach speeds as high as 319 km/h or 198 mph in between North America and Greenland on December 31, 2016 (left panel). At the same time, surface winds are forecasts to reach speeds as high as 95 km/h or 59 mph (center panel) and waves as high as 8.96 m or 29.4 ft in between Norway and Svalbard (right panel).

The situation is further illustrated by the video below, showing winds over the North Atlantic from December 27, 2016 to January 3, 2017, as forecasts by cci-reanalyzer.org.


The fact that this is not a one-off event is also illustrated by the image on the right, showing that the Jet Stream reached speeds of 384 km/h or 239 mph over the Pacific Ocean on December 27, 2015. At the same day and time in 2015, the Jet Stream reached speeds as high as 430 km/h or 267 mph as it moved over North America on its way over the North Atlantic.

In conclusion, increasingly stronger winds are causing huge amounts of heat to enter the Arctic Ocean from the North Atlantic, and also from the Pacific Ocean. As the water of the Arctic Ocean keeps warming, the danger increases that methane hydrates at the bottom of the Arctic Ocean will destabilize.

The danger is illustrated by the two images above and below, recorded by the MetOp2 satellite on the afternoon of Christmas eve and Christmas.


Continued warming could trigger huge abrupt methane eruptions leading to mass destruction and extinction.

Potential warming by more than 10°C or 18°F by 2026 (from: Climate Plan Summary, see also: the extinction page)

The image below shows the associated temperature rise from preindustrial to 2026, with figures discussed in more detail on the Temperature page.


The situation is dire and calls for comprehensive and effective action as described at the Climate Plan.

Two videos complement this. Have a look at the video entitled Abrupt Climate Disrupting Arctic Changes: Part 2 of 2 by Paul Beckwith, in particular the segment from 8:30 to 12:00 minutes where Paul discusses how wind patterns are changing over the Arctic.


For further thoughts on the situation, also have a look at the video below in which Jennifer Hynes interviews Peter Wadhams.


Links

• Climate Plan
http://arctic-news.blogspot.com/p/climateplan.html

• Climate Plan summary
http://arctic-news.blogspot.com/p/summary.html

• Feedbacks
http://arctic-news.blogspot.com/p/feedbacks.html

• Extinction
http://arctic-news.blogspot.com/p/extinction.html

• Temperature
http://arctic-news.blogspot.com/p/temperature.html

• The University Centre in Svalbard: UNIS
http://www.unis.no/

• Danish Meteorological Institute (DMI)
http://ocean.dmi.dk/arctic/meant80n.uk.php

• Monthly CO₂ not under 400 ppm in 2016
http://arctic-news.blogspot.com/2016/11/monthly-co-not-under-400-ppm-in-2016.html

• Methane's Role in Arctic Warming
http://arctic-news.blogspot.com/2016/02/methanes-role-in-arctic-warming.html

• Gulf Stream brings ever warmer water into Arctic Ocean
http://arctic-news.blogspot.com/2015/06/gulf-stream-brings-ever-warmer-water-into-arctic-ocean.html