Showing posts with label ice. Show all posts

Friday, December 22, 2023

Too late to save the climate?

by Andrew Glikson

“Without major action to reduce emissions, global temperature is on track to rise 
by 2.5°C to 4.5°C by 2100” (NASA 2023)

“We Will Not Sign Our Own Death Warrant” (a delegate at COP28)


Whether anything can be done by humans to arrest or reverse global warming and its consequences for the habitability of planet Earth remains an open question, for which neither climate science nor the ignorant hordes of politicians and economists, oblivious to the basic laws of physics, have the answer. However, it is likely that over the next centuries or longer the flow of cold water from the melting of the Greenland and Antarctica ice sheets will lead to a transient slowdown of the rate of warming before the large ice sheets are exhausted.


Having ignored climate science, dismissed climate scientists and repeatedly confected untruths, while global heating accelerates with deleterious consequences, Homo “sapiens” finds itself on track toward carbon poisoning of the atmosphere, the lungs of the inhabitable Earth, acidification of the hydrosphere and coating of the land with carbon and plastics.

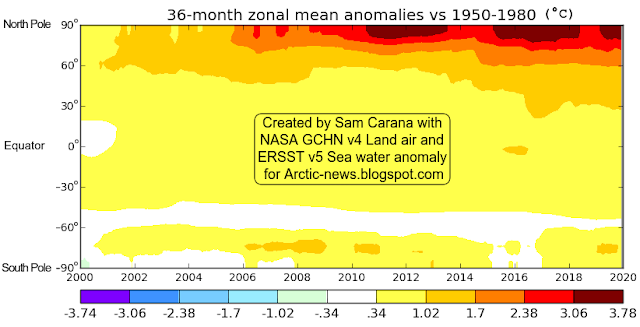
In a new paper, a group of leading climate scientists (Hansen et al., 2023) indicates mean global temperature is currently accelerating toward 2.0°C above pre-industrial temperature by the middle of the decade (Figure 1). The Arctic is warming nearly four times faster than the rest of the world over the last 43 years, on average around 3℃ warmer than it was in 1980. Over the past 30 years Antarctica has been one of the fastest-changing places on Earth, warming more than 3 times faster than the rest of the world.

[ Figure. 1. Global temperature relative to 1880-1920 based on the GISS
(Goddard Institute of Space Studies) analysis - by James Hansen et al., 2023. ]

As the polar regions warm, the tropical climate zones expand and the mid-latitudes, where the most fertile soils are and where the bulk of the population lives, are contracting.

Thus (Figure 2.):
  • Agro-climate zones in eastern Europe experienced a northward migration velocity of 100 km per 10 years over the past 40 years.
  • Northward migration of climate zones in Europe may be up to two times faster in the next decades.
  • Negative impacts of heat stress are expected to non-linearly increase in large parts of southern and southeastern Europe.

[ Figure 2. (a) Agro-climate zonation of Europe based on growing season length (GSL) and active temperature sum (ATS) for the period between 1975 and 1995.The identified agro-climate zones are named as follows (going from north to south): boreal north (BON), boreal south (BOS), nemoral (NEM), continental (CON), Pannonian (PAN), northern maritime (NMA), southern maritime (SMA) and Mediterranean (MED). (b) The migration of agro-climate zones between the 1975–1995 and 1996–2016 periods. For better distinction, only the areas affected by migration of agro-climate zones are displayed (colored areas), while gray color denotes the areas where the agro-climate zones have not changed - Ceglar et al. 2019. ]

A projection by NOAA states: “While we cannot stop global warming overnight, we can slow the rate and limit the amount of global warming by reducing human emissions of heat-trapping gases and soot (“black carbon”). This projection takes neither the amplifying feedback, i.e. from warming of the oceans, melting ice sheets, melting of the permafrost, migrating climate zones, nor the time factor into account.

Factors rendering a potential reversal of global warming in the short term unlikely include:
  1. The rise of mean global heating above a level of ~1.5oC and much higher at the poles above pre-industrial temperatures, polar-ward migration of climate zones, melting of the Greenland and Antarctic ice sheets, intensification of extreme weather events, requiring major cooling of the Earth, which is unlikely within the time frame of a tribal-conflicted civilization.

  2. Where scientific breakthroughs would allow effective climate mitigation, for example global cooling by CO₂ drawdown, it is questionable whether Homo sapiens ─ recorded by history as an invasive blood-stained tribal species ─ would be able to avoid destroying its home planet.
The apparent absence of radio signals from technological civilizations in the Milky Way may suggest that advanced civilizations tend to undergo self-destruction, consistent with local observations, referred to as the “Fermi Paradox”.

A factor rarely taken into account emerges from the key paper “Ice melt, sea level rise and superstorms: evidence from paleoclimate data, climate modelling, and modern observations that 2°C global warming could be dangerous”, by Hansen et al. (1996) (Figure 3.).
[ Figure 3. Surface air temperature (°C) relative to 1880-1920 for several scenarios - by James Hansen et al. 2016. ]

Here the flow of cold ice-melt water results in formation of large cold pools in the Atlantic Ocean and Southern Ocean (Figure 3), related to an overall decline in mean global temperatures to -0.33°C by 2096 (Figure 4.) due to the flow of cold ice-melt  water from Greenland and Antarctica.

While the collision between the cold air and water fronts and the tropical war air mass would lead to intense storms over large tracts of Earth, such transient cooling may allow Home "sapiens" a respite from global warming before its home becomes an uninhabitable planet.

[ Figure 4. Surface air temperature (◦C) relative to 1880–1920 in (a) 2065, (b) 2080, and (c) 2096. Top row is IPCC scenario A1B. Ice melt with 10-year doubling is added in other scenarios - James Hansen et al. 2016. ]


A/Prof. Andrew Y Glikson
Earth and Paleo-climate scientist


Andrew Glikson
Books:

The Asteroid Impact Connection of Planetary Evolution
https://www.springer.com/gp/book/9789400763272
The Archaean: Geological and Geochemical Windows into the Early Earth
https://www.springer.com/gp/book/9783319079073
The Plutocene: Blueprints for a Post-Anthropocene Greenhouse Earth
https://www.springer.com/gp/book/9783319572369
The Event Horizon: Homo Prometheus and the Climate Catastrophe
https://www.springer.com/gp/book/9783030547332
Climate, Fire and Human Evolution: The Deep Time Dimensions of the Anthropocene
https://www.springer.com/gp/book/9783319225111
Evolution of the Atmosphere, Fire and the Anthropocene Climate Event Horizon
https://www.springer.com/gp/book/9789400773318
From Stars to Brains: Milestones in the Planetary Evolution of Life and Intelligence
https://www.springer.com/us/book/9783030106027
Asteroids Impacts, Crustal Evolution and Related Mineral Systems with Special Reference to Australia
https://www.springer.com/us/book/9783319745442
The Fatal Species: From Warlike Primates to Planetary Mass Extinction
https://www.springer.com/gp/book/9783030754679
The Trials of Gaia. Milestones in the evolution of Earth with reference to the Antropocene
https://www.amazon.com.au/Trials-Gaia-Milestones-Evolution-Anthropocene/dp/3031237080


Wednesday, February 9, 2022

Accelerating loss of global snow and ice cover


Ocean heat is at record levels. As a result, global sea ice extent was only 16.23 million km² on February 9, 2022, the third lowest extent on record. What makes this even more worrying is that we're currently in the depth of a persistent La Niña.


Antarctic sea ice at lowest extent on record since start satellite measurements

Ocean heat is a huge threat for Antarctica at the moment. The image below shows that Antarctic sea ice extent was only 2.091 million km² on February 16, 2022, the lowest on record since the start of satellite measurements.


Ocean heat is reducing the sea ice around Antarctica and is getting underneath floating sea ice. 

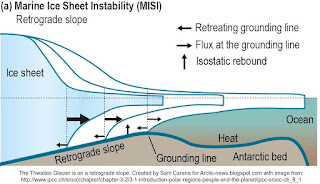
The Thwaites Glacier, which is on a retrograde slope, is especially vulnerable to collapse. 

The Thwaites Glacier contains enough ice to raise global sea levels by 65 cm (25.59 inches) if it were to completely collapse.

The animation on the right, created with images from Climate Reanalyzer, shows the retreat of the Antarctic snow and ice cover from January 5 to February 18, 2021. 

The animation underneath, by navy.mil, shows sea ice thickness over 30 days up to February 17, 2022 (with 8 days of forecasts added).

Another danger of a rapid loss of the snow and ice cover on Antarctica is release of methane. Jemma Wadham warned about this in a 2012 study, as discussed at the post methane hydrates. More recently, Jemma Wadham said: “We are sleepwalking into a catastrophe for humanity.

The Thwaites Glacier is often called the Doomsday Glacier because if it collapses it would lead to vast sea level rise, and scientists believe it is likely to fail within a few years, says Cliff Seruntine (the Naturalist) in the video below. 


A recent study concludes that mountain glaciers may hold less ice than previously thought. Their disappearance means less water for drinking and agriculture, and faster temperature rises due to albedo loss. While the study found that the Himalayas contain more water than thought, another recent study, Mt. Everest’s highest glacier is a sentinel for accelerating ice loss, describes how human-induced climate change has a huge impact on the highest reaches of the planet.

The outlook for the Arctic is most threatening, as the post methane hydrates also concluded back in 2013, as described in numerous post here at Arctic-news and as discussed in the video below by Jim Massa.


A huge temperature rise threatens to unfold soon


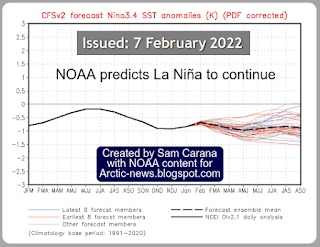
Above image indicates that the difference between the top of El Niño and the bottom of La Niña could be more than half a degree Celsius.

As said, we're currently in the depth of a persistent La Niña, which suppresses temperatures. As the temperature keeps rising, ever more frequent strong El Niño events are likely to occur, as discussed in an earlier post

A 2019 study analyzes how tipping the ENSO into a permanent El Niño can trigger state transitions in global terrestrial ecosystems.

Currently, the temperature rise is additionally suppressed by low sunspots. Within a few years time, sunspots can be expected to reach the peak of their current cycle and observed sunspots are looking stronger than predicted. 

In the image below on the right, adapted from NOAA, the solar cycle is represented as the number of sunspots (top) and F10.7cm radio flux (bottom). 

In a recent communication, James Hansen repeats that, as reductions take place in the sulfate aerosols that are currently co-emitted by traffic, transport and industry, this is causing the current temperature rise to accelerate and could cause further rapid global warming, referred to in a 2021 presentation as a termination shock.

Furthermore, in addition to a huge temperature rise resulting from sulfate aerosols falling away, there could be a further rise in temperature as a result of releases of other aerosols with a net warming impact, such as black and brown carbon, which can increase dramatically as more wood burning and forest fires take place.

In summary, while the temperatures are accelerating, we'll soon be moving into the next El Niño, with sunspots moving toward a peak, with sulfate aerosols causing a termination shock and with other aerosols further driving up the temperature rise. 

Stop the deception!

In a giant scheme of deception, the temperature rise is all too often presented with images of people playing on the beach on a 'warm' day, as if 'global warming' was making life more 'comfortable'. 

Forest fires are called 'wildfires', biomass burning and associated deforestation is referred to as 'renewable biofuel', fracking-induced earthquakes are called 'natural' disasters and methane eruptions are called seeps and bubbles of 'natural' gas from 'natural' sources such as wetlands. 

This gives the false impression that this was somehow 'natural' as if human activities had nothing to do with it, and as if owning beach-front property was becoming ever more attractive.


Let's stop this deception! In reality, human-caused emissions have a huge short-term impact on temperature and their combination with genuinely natural variability such as El Niño and sunspots can act as a catalyst, causing numerous feedbacks to kick in with ever greater ferocity. 

This can result in collapse of global sea ice and permafrost, resulting in albedo loss and eruption of huge quantities of carbon dioxide, methane and nitrous oxide, further driving up the temperature rise abruptly, as described at the extinction page. Further feedbacks are also described at the feedbacks page

Conclusion

The situation is dire and calls for the most comprehensive and effective action, as described at the Climate Plan.


Links

• Another Record: Ocean Warming Continues through 2021 despite La Niña Conditions - by Lijing Cheng et al. 
https://link.springer.com/article/10.1007%2Fs00376-022-1461-3

• Ocean heat is at record levels, with major consequences - by Kevin Trenberth

• Arctic Data archive System - Vishop extent

• NSIDC: Charctic Interactive Sea Ice Graph

• IPCC: Marine Ice Sheet Instability

• Climate Reanalyzer
https://climatereanalyzer.org/wx/DailySummary/#seaice-snowc-topo

• Antarctica CICE ice thickness

• Antarctica’s ‘doomsday’ glacier: how its collapse could trigger global floods and swallow islands 
https://theconversation.com/antarcticas-doomsday-glacier-how-its-collapse-could-trigger-global-floods-and-swallow-islands-173940

• Methane hydrates (2013)

• Potential methane reservoirs beneath Antarctica - by Jemma Wadham et al. (2012) 
https://www.nature.com/articles/nature11374

• A new frontier in climate change science: connections between ice sheets, carbon and food webs (2021) 

• Ice velocity and thickness of the world’s glaciers - by Romain Millan et al. 
https://www.nature.com/articles/s41561-021-00885-z

• Mountain glaciers may hold less ice than previously thought – here’s what that means for 2 billion downstream water users and sea level rise 
https://theconversation.com/mountain-glaciers-may-hold-less-ice-than-previously-thought-heres-what-that-means-for-2-billion-downstream-water-users-and-sea-level-rise-176514

• Mt. Everest’s highest glacier is a sentinel for accelerating ice loss - by Mariusz Potocki et al. 

• Human-induced climate change impacts the highest reaches of the planet — Mount Everest
• Ocean Heat Content Update 1 - 2022 - Science Talk with Jim Massa
https://www.youtube.com/watch?v=pctkg_LDqcU

• NOAA - ENSO: Recent Evolution, Current Status and Predictions
https://www.cpc.ncep.noaa.gov/products/analysis_monitoring/lanina/enso_evolution-status-fcsts-web.pdf

• NOAA - Monthly Temperature Anomalies Versus El Niño 
• Human Extinction by 2022? 

• Tipping the ENSO into a permanent El Niño can trigger state transitions in global terrestrial ecosystems - by Mateo Duque-Villegas et al. (2019) 
https://esd.copernicus.org/articles/10/631/2019

• James Hansen - The New Horse Race

• Climate Impact of Decreasing Atmospheric Sulphate Aerosols and the Risk of a Termination Shock - by Leon Simons, James Hansen and Yann duFournet (2021) 

• NOAA - Solar Cycle Progression

• Aerosols

• Feedbacks

• Extinction


Monday, June 28, 2021

Heatwaves and the danger of the Arctic Ocean heating up

 Heatwaves and Jet Stream Changes

Heatwaves are increasingly hitting higher latitudes, as illustrated by the forecasts below. The background behind this is that the temperature rise caused by people's emissions is also causing changes to the jet streams. 

[ click on images to enlarge ]

These changes to the Jet Stream are increasingly creating conditions for heatwaves to strike at very high latitudes, as also illustrated by the images on the right.

The first image on the right shows that surface temperatures as high as 48°C or 118.3°F are forecast in the State of Washington for June 30, 2021, at 01:00 UTC, at a latitude of 46.25°N. At the same time, even higher temperatures are forecast nearby at 1000 hPa level (temperatures as high as 119.4°C or 48.6°C). 

The next two images on the right show what happened to the jet stream. One image shows instantaneous wind power density at 250 hPa, i.e. at an altitude where the jet stream circumnavigates the globe, on June 26, 2021 at 11:00 UTC. The image features two green circles. The top green circle marks a location where the jet stream is quite forceful and reaches a speed of 273 km/h or 170 mph. The bottom green circle marks the same location where the 48°C is forecast on June 30, 2021. This shows how heat has been able to move north from as early as June 26, 2021.

The next image on the right shows the situation on June 30, 2021, 04:00 UTC, illustrating how such a jet stream pattern can remain in place (blocked) for several days (in this case for more than five days). The green circle again marks the same location where the 48°C is forecast (in the top image on the right).

This illustrates how a more wavy jet stream can enable high temperatures to rise to higher latitudes, while holding a pattern in place for several days, thus pushing up temperatures over time in the area.  

As said, these changes in the jet stream that are enabling hot air to rise up to high latitudes are caused by global warming. Accelerating warming in the Arctic is causing the temperature difference between the North Pole and the Equator to narrow, which in turn is making the jet stream more wavy.

The next image on the right shows that a UV index reading as high as 12 (extreme) is forecast for a location at 51.56°N in Washington for June 28, 2021, illustrating that such an extreme level of UV can occur at high latitudes, due to changes in the jet stream.

Accelerated Warming in the Arctic


As the temperature rise is accelerating due to people's emissions, it is speeding up more in the Arctic than anywhere else on Earth. 

The Arctic is heating up faster than elsewhere, as numerous feedbacks and tipping points are hitting the Arctic, including:

• Albedo loss goes hand in hand with decline of the snow and ice cover. Albedo is a measure of reflectivity of the surface. Albedo is higher as more sunlight is reflected back upward and less energy is getting absorbed at the surface. Albedo decline can occur as snow and ice disappears and the underlying darker soil and rock becomes exposed. Even when the snow and ice cover remains extensive, its reflectivity can decline, due to cracks and holes in the ice, due to formation of melt ponds on top of the ice and due to changes in texture (melting snow and ice reflects less light). Calving of the ice can take place where warmer water can reach it, and such calving can increase as storms strengthen and waves get larger.

• Furthermore, albedo loss can occur as dust, soot and organic compounds that are caused by human activities get deposited on the snow and ice cover, reducing the reflectivity of the surface. Organic compounds and nutrients in meltwater pools can lead to rapid growth of algae, especially at times of high insolation.

• Latent heat loss. As sea ice gets thinner, ever less ocean heat gets consumed in the process of melting the subsurface ice, to the point where - as long as air temperatures are still low enough - there still is a thin layer of ice at the surface that will still consume some heat below the surface, but that at the same time acts as a seal, preventing heat from the Arctic Ocean to enter the atmosphere.

• Wind changes including changes to the Jet Stream can further amplify the temperature rise in the Arctic. As the temperature difference between the North Pole and the Equator narrows, the Jet Stream becomes more wavy, spreading out widely at times. The changes to the jet stream cause more extreme weather, including heatwaves, forest fires, storms, flooding, etc. This can cause more aerosols to get deposited on the snow and ice cover. Stronger wind and storms over the North Atlantic can also speed up the flow of warm water into the Arctic Ocean.

Albedo loss, latent heat loss and changes to wind patterns can dramatically amplify the temperature rise in the Arctic. The temperature of the Arctic Ocean is rising accordingly, while there are a number of developments and events that specifically speed up the temperature rise of the water of the Arctic Ocean, as discussed below.


Arctic Ocean heating up

The temperature of the water of the Arctic Ocean is rising, due to a number of events and developments:
                 [ from the insolation page ]
  • Solstice occurred on June 21, 2021. The Arctic is now receiving huge amounts of sunlight (see image on the right, from the insolation page).

  • Sea surface temperatures and temperatures on land are very high in Siberia, Canada and Alaska. Strong winds can spread warm air over the Arctic Ocean.

  • Arctic sea ice extent is low for the time of year, but at this stage, there still is a lot of sea ice present (compared to September). The sea ice acts as a seal, preventing ocean heat from entering the atmosphere, resulting in more heat remaining in the Arctic Ocean.

[ Lena River, Siberia ]

  • Warm water from rivers is flowing into the Arctic Ocean, carrying further heat into the Arctic Ocean. Above image shows that on June 23, 2021, sea surface temperatures were 22.3°C or 72.2°F at a spot where water from the Lena River flows into the Arctic Ocean. The image on the right shows that at a nearby location the sea surface temperature was 20°C or 36°F higher than 1981-2011. 

  • Warm water from the North Atlantic Ocean and the North Pacific Ocean is flowing into the Arctic Ocean and the amount of ocean heat flowing into the Arctic Ocean is rising each year.

  • As mentioned above, latent heat loss is contributing to the rapid temperature rise in the Arctic. The remaining sea ice acts as a buffer, consuming ocean heat from below. Sea ice is getting thinner each year, so ever less ocean heat can get consumed in the process of melting the sea ice from below.

  • Changes to the jet stream can also cause strong storms to dramatically speed up the amount of heat flowing into the Arctic Ocean, as discussed at the Cold freshwater lid on North Atlantic page.

The danger of the temperature rise of the Arctic Ocean

The danger of the temperature rise of the Arctic Ocean is that it can cause destabilization of hydrates at its seafloor, resulting in eruption of huge amounts of methane from hydrates and from free gas underneath the hydrates.

[ The Buffer has gone, feedback #14 on the Feedbacks page ]

In conclusion, changes to the jet stream could cause a huge temperature rise soon, while a 3°C rise could cause humans to go extinct, which is a daunting prospect. Even so, the right thing to do is to help avoid the worst things from happening, through comprehensive and effective action as described in the Climate Plan.

• Insolation

• Cold freshwater lid on North Atlantic

• Most Important Message Ever
https://arctic-news.blogspot.com/2019/07/most-important-message-ever.html

• Could temperatures keep rising?

• Latent Heat


Wednesday, February 19, 2020

Arctic Ocean February 2020


On February 20, 2020, 09Z, surface temperature anomalies reached both ends of the scale over North America, while the Arctic was 3.7°C or 6.7°F warmer than in 1979-2000. On that day, the average 2 m temperature anomaly for the Arctic was 3.5°C or 6.3°F.


These high temperature anomalies at 2 meters in the left panel go hand in hand with the wind patterns at 250 hPa (jet stream) as shown in the center panel and the wind patterns at 10 meters shown in the right panel. Closer to sea level, circular winds around low pressure areas bring warm air into the Arctic, from Russia and from the Pacific Ocean.


Above image shows winds at 250 hPa (jet stream) with speeds as high as 317 km/h or 197 mph (green circle) in the left panel, while the right panel shows circular winds at 850 hPa reaching speeds as high as 176 km/h or 109 mph (green circle).

These wind patterns have caused much warm air to enter the Arctic, while relatively little cold air has moved out of the Arctic. Furthermore, stronger winds cool the sea surface. As a result, Arctic sea ice extent on February 24, 2020, was 14.1 million km², slightly more than the 2010s average of 14 million km².


Arctic sea ice, however, is very thin. Stronger winds can also accelerate the speed at which ever warmer water is flowing into the Arctic Ocean from the Atlantic Ocean and from the Pacific Ocean, as discussed in a previous post. The overall result is that sea ice volume is at a record low for the time of the year.


This is further illustrated by the sea ice thickness (in meters) comparison below between February 28, 2015 and February 28, 2020, i.e. forecasts for February 28, run on February 27.


Rise in greenhouse gas levels is accelerating

Temperatures are rising at ever faster speed as the rise in greenhouse gas levels in the atmosphere is accelerating. As illustrated by the image below, the daily average CO₂ level at Mauna Loa, Hawaii, was 416.08 ppm on February 10, 2020, higher than it has been for millions of years. Since the annual peak is typically reached in May, even higher levels can be expected soon.


From the way emissions are rising now, it looks like we could soon reach even higher CO₂e forcing than during the Paleocene–Eocene Thermal Maximum (PETM) mass extinction event, some 55.5 million years ago, as discussed in a previous post. Very worrying also is the recent rise in methane levels recorded at Barrow, Alaska, as illustrated by the image below.


The buffer is gone

As the sea ice is getting thinner, there is little or no buffer left to consume the influx of ever warmer and salty water from the Atlantic Ocean and Pacific Ocean. As illustrated by the image below, there is a tipping point at 1°C above the 20th century average, i.e. there are indications that a rise of 1°C will result in most of the sea ice underneath the surface to disappear.

[ from earlier post ]
As long as there is sea ice in the water, this sea ice will keep absorbing heat as it melts, so the temperature will not rise at the sea surface. But there is ever less sea ice volume left to absorb ocean heat, and the amount of energy absorbed by melting ice is as much as it takes to heat an equivalent mass of water from zero to 80°C.


Meanwhile, temperatures keep rising globally and more than 90% of global warming is going into oceans.


As the temperature of the oceans keeps rising, the danger increases that heat will reach the seafloor of the Arctic Ocean and will destabilize hydrates contained in sediments at the seafloor, resulting in huge releases of methane.


Are humans functionally extinct?

For more background as to when temperatures
could cross 2°C, see also this discussion on trends 
Species can be regarded to be ‘functionally extinct’ when their numbers have declined below levels needed for them to reproduce healthy offspring. This can occur due to causes such as loss of habitat and disappearance of other species that they depend on.

Species can also be declared to be ‘functionally extinct’ when they are threatened to be wiped out by a catastrophe that appears to be both imminent and inescapable, which would cause their numbers to dwindle below a critical threshold required for survival of the species.

Rising temperatures now threaten most, if not all, species to go extinct in a matter of years. In 2020, the global temperature rise could cross the critical guardrail of 2°C above preindustrial that politicians at the Paris Agreement promised would not be crossed. In fact, they pledged to take efforts to avoid a 1.5°C rise. Their failure to do so constitutes a de facto declaration that humans are now functionally extinct and that the looming temperature rise will drive most, if not all species on Earth into extinction.

See also the 2015 postWARNING - 
Dire Situation

The situation is dire, in many respects. Current laws punish people for the most trivial things, while leaving the largest crime one can imagine unpunished: planetary omnicide!

In the video below, Guy McPherson warns that a rapid decline in industrial activity could result in an abrupt rise in temperature of 1°C, as much of the aerosol masking effect falls away.


The dire situation calls for immediate, comprehensive and effective action, as described in the Climate Plan.

P.S. Don't forget to vote!

One of the most important things one can do to change things is to vote, e.g. in the U.S., vote for Bernie Sanders and the Green New Deal!

Fossil fuel and control over its supply is behind much of the conflict, violence and pollution that has infested the world for more than a century.

Instead of using fossil fuel, the world must rapidly transition to the use of wind turbines, geothermal power, solar power, wave power, and similar clean and renewable ways to generate energy.

The transition to clean, renewable energy removes much cause for conflict, since it is available locally around the world and its use in one place doesn't exclude use of clean, renewable energy elsewhere.

The transition to clean, renewable energy will provide greater energy security and reliability, besides its numerous further benefits, e.g. it will make more land and water available for growing food and it will give us more jobs, better health, and a cleaner environment. And, because it's more economic, the transition to clean, renewable energy will pay for itself as we go.

Bernie Sanders calls for a rapid transition to clean, renewable energy as part of the Green New Deal.

Please share this message, vote for Bernie Sanders and support the GND!


Links

• Climate Plan
https://arctic-news.blogspot.com/p/climateplan.html

• Why stronger winds over the North Atlantic are so dangerous
https://arctic-news.blogspot.com/2020/02/why-stronger-winds-over-north-atlantic-are-so-dangerous.html

• Critical Tipping Point Crossed In July 2019
https://arctic-news.blogspot.com/2019/09/critical-tipping-point-crossed-in-july-2019.html

• Could Humans Go Extinct Within Years?
https://arctic-news.blogspot.com/2020/01/could-humans-go-extinct-within-years.html

• January 2020 Temperature Anomaly
https://arctic-news.blogspot.com/2020/02/january-2020-temperature-anomaly.html


Tuesday, December 17, 2019

Extinction in 2020?


Above image depicts how humans could go extinct as early as 2020. The image was created with NASA LOTI 1880-Nov.2019 data, 0.78°C adjusted to reflect ocean air temperatures (as opposed to sea surface temperatures), to reflect higher polar temperature anomalies (as opposed to leaving out 'missing' data) and to reflect a 1750 baseline (as opposed to a 1951-1980 baseline), with two trends added. Blue: a long-term trend based on Jan.1880-Nov.2019 data. Red: a short-term trend, based on Jan.2009-Nov.2019 data, to illustrate El Niño/La Niña variability and how El Niño could be the catalyst to trigger huge methane releases from the Arctic Ocean.

How was above image created? Let's first look at the baseline. The NASA default baseline is 1951-1980. The added trend in the image below shows early 1900s data to be well below this 1951-1980 baseline. In this analysis, a 0.28°C adjustment was therefore used to reflect this, and to reflect a 1750 baseline, a further 0.3°C was used, adding up to a 0.58°C baseline adjustment.


Furthermore, the NASA Land+Ocean temperature index (LOTI) uses sea surface temperatures, but ocean air temperatures seem more appropriate, which adds a further 0.1°C adjustment. Also, when comparing current temperatures with preindustrial ones, it's hard to find data for the polar areas. Treating these data as 'missing' would leave important heating out of the picture. After all, the polar areas are heating up much faster than the rest of the world, and especially so in the Arctic region. Therefore, a further 0.1°C adjustment was used to reflect higher polar temperature anomalies, resulting in the above-mentioned 0.78°C adjustment.

Finally, the red trend illustrates El Niño/La Niña variability. As discussed in a recent post, an El Niño is forecast for 2020 and this could be the catalyst to trigger huge methane releases from the Arctic Ocean.

The image below shows El Niño/La Niña variability going back to 1950, added to the NOAA monthly temperature anomaly.


As said, the Arctic region is heating up much faster than the rest of the world. There are several reasons why this is the case. Decline of the sea ice makes that less sunlight gets reflected back into space and that more sunlight is reaching the Arctic Ocean. This also causes more water vapor and clouds to appear over the Arctic Ocean. Furthermore, Arctic sea ice has lost most of the thicker multi-year ice that used to extend meters below the surface, consuming huge amounts of ocean heat entering the Arctic Ocean along ocean currents from the North Atlantic and the North Pacific oceans.

[ created with NOAA Arctic Report Card 2019 image ]
Above-mentioned feedbacks (albedo changes and more water vapor and clouds) contribute to higher temperatures in the Arctic. Furthermore, as the temperature difference between the North Pole and the Equator narrows, the jet stream changes, which can lead to further Arctic heating, i.e. higher temperatures of the atmosphere over the Arctic Ocean and over land around the Arctic Ocean, which in turn causes higher temperatures of the water flowing into the Arctic Ocean from rivers.

Furthermore, jet stream changes can also cause additional heating of parts of the Pacific Ocean and the Atlantic Ocean.

[ click on images to enlarge ]
Above image shows that sea surface temperature anomalies off the East Coast of North America as high as 13.6°C or 24.4°F were recorded on December 18, 2019.

Ocean currents can bring huge amounts of heat into the Arctic Ocean, and this can be amplified due to cyclones speeding up the inflow of water from the Atlantic Ocean and the Pacific Ocean into the Arctic Ocean.


As above image shows, the temperature rise of the oceans on the Northern Hemisphere is accelerating. This constitutes a critical tipping point, i.e. there are indications that a rise of 1°C will result in most of the sea ice underneath the surface to disappear. This sea ice used to consume the inflow of warm, salty water from the Atlantic Ocean and the Pacific Ocean. So, while there may still be sea ice left at the surface, since low air temperatures will cause freezing of surface water, the latent heat buffer has gone.


As long as there is sea ice, this will keep absorbing heat as it melts, so the temperature will not rise at the sea surface. The amount of energy absorbed by melting ice is as much as it takes to heat an equivalent mass of water from zero to 80°C.

The danger is that, as Arctic Ocean heating accelerates further, hot water will reach sediments at the Arctic Ocean seafloor and trigger massive methane eruptions, resulting in a huge abrupt global temperature rise. As discussed in an earlier post, a 3°C will likely suffice to cause extinction of humans.


Earlier this year, an Extinction Alert was issued, followed by a Stronger Extinction Alert.

In a rapid heating scenario:
  1. a strong El Niño would contribute to
  2. early demise of the Arctic sea ice, i.e. latent heat tipping point +
  3. associated loss of sea ice albedo,
  4. destabilization of seafloor methane hydrates, causing eruption of vast amounts of methane that further speed up Arctic warming and cause
  5. terrestrial permafrost to melt as well, resulting in even more emissions,
  6. while the Jet Stream gets even more deformed, resulting in more extreme weather events
  7. causing forest fires, at first in Siberia and Canada and
  8. eventually also in the peat fields and tropical rain forests of the Amazon, in Africa and South-east Asia, resulting in
  9. rapid melting on the Himalayas, temporarily causing huge flooding,
  10. followed by drought, famine, heat waves and mass starvation, and
  11. collapse of the Greenland Ice Sheet.
[ from an earlier post ]

The precautionary principle calls for appropriate action when dangerous situations threaten to develop. How can we assess such danger? Risk is a combination of probability that something will eventuate and severity of the consequences. Regarding the risk, there is growing certainty that climate change is an existential threat, as discussed in a recent post. There's a third dimension, i.e. timescale. Imminence alone could make that a danger needs to be acted upon immediately, comprehensively and effectively. While questions may remain regarding probability, severity and timescale of the dangers associated with climate change, the precautionary principle should prevail and this should prompt for action, i.e. comprehensive and effective action to reduce damage is imperative and must be taken as soon as possible.

The image below gives a visual illustration of the danger.


Polynomial trendlines can point at imminent danger by showing that acceleration could eventuate in the near future, e.g. due to feedbacks. Polynomial trendlines can highlight such acceleration and thus warn about dangers that could otherwise be overlooked. This can make polynomial trendlines very valuable in climate change analysis. In the image below, the green linear trend and the blue polynomial trend are long-term trends (based on Jan.1880-Nov.2019 data), smoothing El Niño/La Niña variability, but the blue polynomial trend better highlights the recent temperature rise than the green linear trend does. The red short-term trend (based on Jan.2009-Nov.2019 data) has the highest R² (0.994) and highlights how El Niño could be the catalyst for huge methane eruptions from the Arctic Ocean, triggering a huge global temperature rise soon.


The image below, from an earlier post, explains the speed at which warming elements can strike, i.e. the rise could for a large part occur within years and in some cases within days and even immediately.


As the image below shows, peak methane levels as high as 2737 parts per billion (ppb) were recorded by the MetOp-2 satellite in the afternoon of December 20th, 2019, at 469 mb. Ominously, a large part of the atmosphere over the East Siberian Arctic Shelf (ESAS) is colored solid magenta, indicating methane levels above 1950 ppb.


The situation is dire and calls for immediate, comprehensive and effective action, as described in the Climate Plan.


Links

• NASA - GISS Surface Temperature Analysis (GISTEMP v4)
https://data.giss.nasa.gov/gistemp/maps/index_v4.html

• NOAA Northern Hemisphere ocean temperature anomalies through November 2019
https://www.ncdc.noaa.gov/cag/global/time-series/nhem/ocean/1/11/1880-2019

• NOAA - Monthly temperature anomalies versus El Niño
https://www.ncdc.noaa.gov/sotc/global/201911/supplemental/page-3

• 2020 El Nino could start 18°C temperature rise
https://arctic-news.blogspot.com/2019/11/2020-el-nino-could-start-18-degree-temperature-rise.html

• NOAA Arctic Report Card 2019
https://www.arctic.noaa.gov/Report-Card/Report-Card-2019

• Critical Tipping Point Crossed In July 2019
https://arctic-news.blogspot.com/2019/09/critical-tipping-point-crossed-in-july-2019.html

• Most Important Message Ever
https://arctic-news.blogspot.com/2019/07/most-important-message-ever.html

• Accelerating greenhouse gas levels
https://arctic-news.blogspot.com/2019/11/accelerating-greenhouse-gas-levels.html

• Debate and Controversy
https://arctic-news.blogspot.com/p/debate.html

• Extinction Alert
https://arctic-news.blogspot.com/2019/02/extinction-alert.html

• Stronger Extinction Alert
https://arctic-news.blogspot.com/2019/03/stronger-extinction-alert.html

• Abrupt Warming - How Much And How Fast?
http://arctic-news.blogspot.com/2017/05/abrupt-warming-how-much-and-how-fast.html

• Climate Plan
https://arctic-news.blogspot.com/p/climateplan.html