The clouds feedback refers to disappearance of the lower clouds, more specifically the stratocumulus decks. Stratus cloud decks cover about 20% of subtropical oceans and are prevalent in the eastern portions of those oceans—for example, off the coasts of California or Peru. The clouds cool and shade Earth as they reflect the sunlight that hits them back into space. Tapio Schneider et al. calculated that these clouds begin to break up when carbon dioxide equivalent (CO₂e) levels rise above the tipping point of 1,200 ppm.
Disappearance of these clouds will make the temperatures go up strongly and rather abruptly. By the time CO₂e levels will have risen to this clouds tipping point of 1,200 ppm CO₂e, temperatures will already have gone up a lot in line with the warming from rising CO₂e levels. On top of this, the clouds feedback itself triggers an additional surface warming of some 8°C globally.
Study:
Possible climate transitions from breakup of stratocumulus decks under greenhouse warming - by Tapio Schneider et al., published February 25, 2019.
https://www.nature.com/articles/s41561-019-0310-1
Discussion at facebook starting February 26, 2019:
https://www.facebook.com/groups/arcticnews/permalink/10157149203669679


NOAA's globally averaged marine surface mean for April 2022 was 1909.9 ppb. The above image shows that, on September 4, 2022 am, the MetOp satellite recorded a mean methane concentration of 1904 ppb at 586 mb, which is close to sea level. At 293 mb, the MetOp satellite recorded a mean of 1977 ppb, while at 218 mb it recorded a peak of 2805 ppb.
Such high methane levels could be caused by destabilization of methane hydrates at the seafloor of the Arctic Ocean, with large amounts of methane erupting (increasing 160 x in volume) and rising up at accelerating speed through the water column (since methane is lighter than water), concentrated in the form of plumes, which makes that less methane gets broken down in the water by microbes and in the air by hydroxyl, of which there is very little in the Arctic in the first place. Such a methane eruption entering the atmosphere in the form of a plume can be hard to detect as long as it still doesn't cover enough of the 12 km in diameter footprint to give a pixel the color associated with high methane levels.
The clouds tipping point could thus be crossed due to an additional amount of methane from an abrupt eruption of the seafloor that is smaller than the 5 Gt that is currently in the atmosphere, while 5 Gt is only 10% of the 50 Gt that Natalia Shakhova et al. warned about long ago, while 50 Gt is in turn only a small fraction of all the methane contained in sediments in the Arctic. On its own, an additional 5 Gt of seafloor methane could raise the global mean methane concentration by another 1977 ppb which, at a 1-year GWP of 200, would translate into another 395.4 ppm CO₂e. Adding up 2 x 395.4 ppm CO₂e and 410 ppm CO₂ gives a total of 1200.8 ppm CO₂e.
So, that would abruptly cause the joint CO₂e of just two greenhouse gases, i.e. methane and CO₂, to cross the 1200 ppm clouds tipping point, triggering a further 8°C global temperature rise, due to the clouds feedback.
There are further forcers, events and developments to be taken into account, which means that the clouds tipping point could be crossed even with a far smaller abrupt release of seafloor methane.

 Furthermore, the narrowing temperature difference between the Arctic and the Tropics will further deform the Jet Stream and in turn cause more extreme weather, leading to more loss of sea ice and thus of its capacity to reflect sunlight and act as a buffer against incoming ocean heat.
A huge amount of heat has built up in the North Atlantic off the coast of North America, as illustrated by the image on the right.
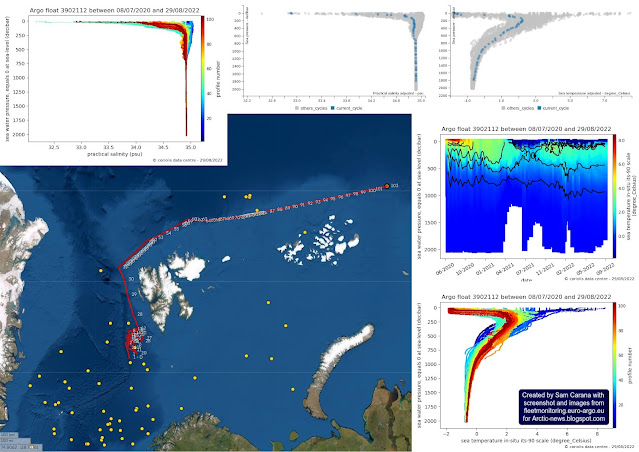
As discussed in an earlier post, rising temperatures result in stronger winds along the path of the Gulf Stream that can make huge amounts of warm, salty water travel from the Atlantic Ocean toward the Arctic and reach shallow parts of the Arctic Ocean such as the East Siberian Arctic Shelf (ESAS), where most of the sea is less than 50 m deep. The danger is illustrated by the Argo float compilation below.
3. Clouds amplify global heating
• News release: Global satellite data shows clouds will amplify global heating (2021)
https://www.imperial.ac.uk/news/226553/global-satellite-data-shows-clouds-will
• Study: Observational evidence that cloud feedback amplifies global warming - by Paulo Ceppi et al. https://www.pnas.org/content/118/30/e2026290118
4. Net effect of clouds is more global heating
• News release: International analysis narrows range of climate’s sensitivity to CO2 (2020)
https://newsroom.unsw.edu.au/news/science-tech/international-analysis-narrows-range-climate%E2%80%99s-sensitivity-co2
• After 40 years, researchers finally see Earth's climate destiny more clearly (2020)
https://www.science.org/content/article/after-40-years-researchers-finally-see-earths-climate-destiny-more-clearly
• Study: An Assessment of Earth's Climate Sensitivity Using Multiple Lines of Evidence - by Steven Sherwood et al. (2020)
https://agupubs.onlinelibrary.wiley.com/doi/10.1029/2019RG000678
• Maximum warming occurs about one decade after a carbon dioxide emission - by Katharine Ricke et al.
Discussion at facebook starting February 26, 2019:
https://www.facebook.com/groups/arcticnews/permalink/10157149203669679
Discussion in post at Arctic-News blog:
When will we die?
Presentation:
Earth System Modeling 2.0: Toward Data-Informed Climate Models With Quantified Uncertainties - by Tapio Schneider | Earth System Modeling 2.0: Toward Data Informed Climate Models w/ Uncertainty - December 8, 2020
Presentation:
AI-Accelerated Climate Modeling | by Tapio Schneider
Stratocumulus clouds are low-lying clouds that can be found between 400 m and 2000 m (about 1300 ft and 6500 ft) altitude. They are the most common clouds on Earth and, over oceans, they often form nearly unbroken decks covering thousands of km². Stratocumulus clouds cover about 20% of the tropical ocean area (between 30°S and 30°N). The albedo of stratocumulus clouds (30-40%) is much higher than the albedo of the ocean background (10%).
Catastrophic crack propagation is what makes a balloon pop. Could low-lying clouds similarly break up and vanish abruptly?
Could peak greenhouse gas concentrations in one spot break up droplets into water vapor, thus raising CO₂e and propagating break-up of more droplets, etc., to shatter entire clouds?
Moreover, could an extra burst of methane from the seafloor of the Arctic Ocean alone suffice to trigger the clouds tipping point and then abruptly push global temperatures up by an additional 8°C?
From:
• Overshoot or Omnicide?
https://arctic-news.blogspot.com/2021/03/overshoot-or-omnicide.html
This possibility is further explored below.
How fast could temperatures rise?
The NASA image below shows the October 2021 temperature anomaly. The Arctic is heating up enormously, with anomalies showing up as high as 9.1°C, as discussed in an earlier post. 


 Peaks in levels of carbon dioxide (CO₂) and methane (CH₄) can be quite high.
Hourly CO₂ levels as high as around 430 ppm were recorded at Mauna Loa recently, as illustrated by the above image.
As illustrated by the image on the right, a carbon dioxide level as high as around 427 ppm was recorded recently at Mauna Loa, Hawaii. This constitutes an increase of over 100 ppm since flask records started in 1969.
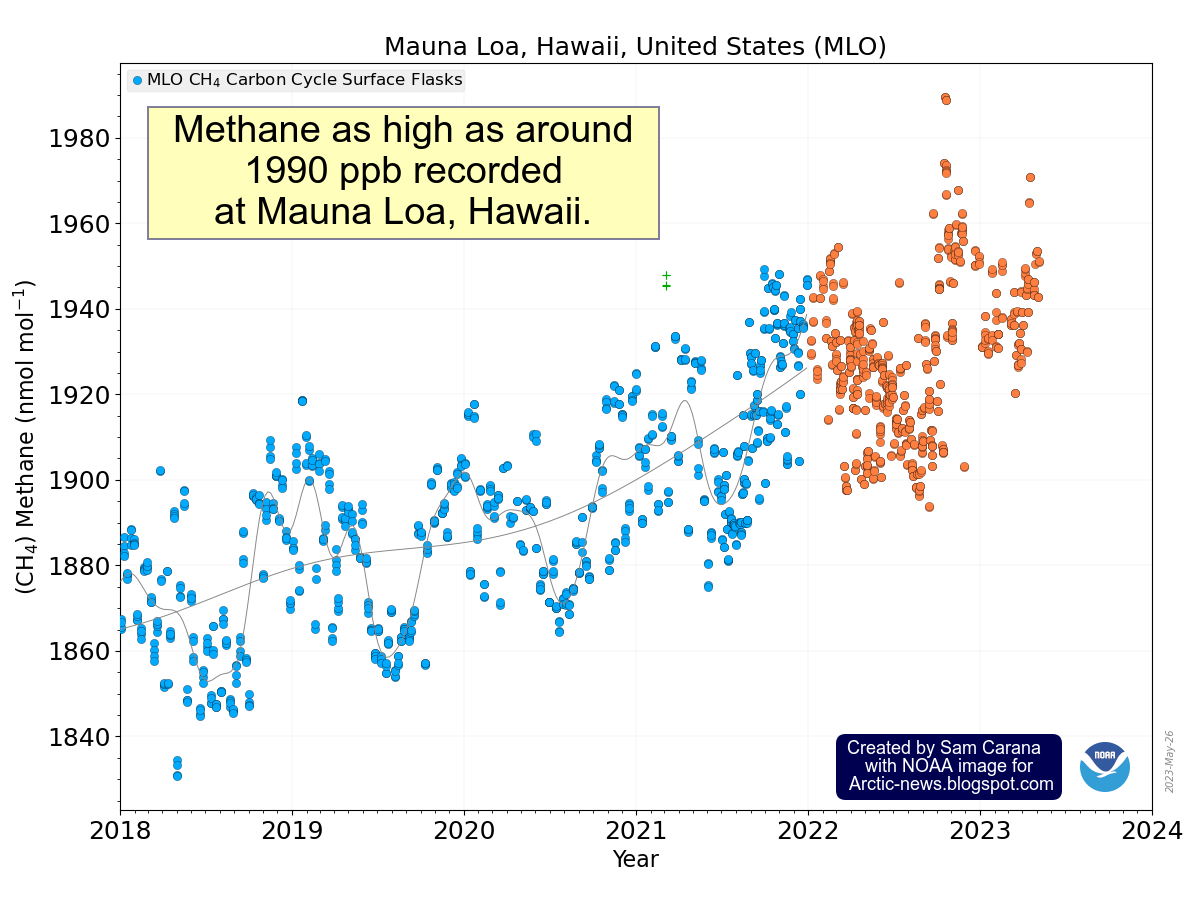
 Even more crucially, methane emissions should be cut rapidly and dramatically, as discussed in an earlier post. The image on the right shows methane levels as high as around 1990 ppb recorded at Mauna Loa, Hawaii.
Carbon dioxide (CO₂) peaks can be quite high. As illustrated by the image on the right, a carbon dioxide level as high as around 427 ppm was recorded recently at Mauna Loa, Hawaii. This constitutes an increase of over 100 ppm since flask records started in 1969.
discussed at facebook at:
https://www.facebook.com/SamCarana/posts/10161811791010161
News release:
High CO₂ Levels Can Destabilize Marine Layer Clouds, published February 25, 2019.
https://www.caltech.edu/about/news/high-cosub2sub-levels-can-destabilize-marine-layer-clouds
Video:
Clouds and the Climate Tipping Point - T. Schneider - April 24, 2019
https://www.youtube.com/watch?v=eGshzvKAM3w
High CO₂ Levels Can Destabilize Marine Layer Clouds, published February 25, 2019.
https://www.caltech.edu/about/news/high-cosub2sub-levels-can-destabilize-marine-layer-clouds
Clouds and the Climate Tipping Point - T. Schneider - April 24, 2019
https://www.youtube.com/watch?v=eGshzvKAM3w
Presentation:
Earth System Modeling 2.0: Toward Data-Informed Climate Models With Quantified Uncertainties - by Tapio Schneider | Earth System Modeling 2.0: Toward Data Informed Climate Models w/ Uncertainty - December 8, 2020
At youtube:
https://www.youtube.com/watch?v=CO_v6fwLdSk
https://www.youtube.com/watch?v=CO_v6fwLdSk
FAQ:
Possible climate transitions from breakup of stratocumulus decks under greenhouse warming
https://clima.caltech.edu/2019/03/01/faq-possible-climate-transitions-from-breakup-of-stratocumulus-decks-under-greenhouse-warming
Possible climate transitions from breakup of stratocumulus decks under greenhouse warming
https://clima.caltech.edu/2019/03/01/faq-possible-climate-transitions-from-breakup-of-stratocumulus-decks-under-greenhouse-warming
AI-Accelerated Climate Modeling | by Tapio Schneider
Specific questions answered in the study:
1. Is the tipping point 1200 ppm CO₂ or CO₂e?
CO₂ levels here should be understood as the equivalent CO₂ levels that correspond to a change in the concentration of all well-mixed greenhouse gases. When a CO₂ threshold is crossed at around 1,200 ppm, the stratocumulus decks abruptly become unstable and break up into scattered cumulus clouds. When the atmospheric concentration of greenhouse gases (for example, CO₂ and H₂O) increases (1,200 ppm), the longwave cooling of the cloud tops weakens, because the downwelling longwave radiation that reaches the cloud tops from above emanates at lower levels with higher temperatures relative to the cloud-top temperatures.
CO₂ levels here should be understood as the equivalent CO₂ levels that correspond to a change in the concentration of all well-mixed greenhouse gases. When a CO₂ threshold is crossed at around 1,200 ppm, the stratocumulus decks abruptly become unstable and break up into scattered cumulus clouds. When the atmospheric concentration of greenhouse gases (for example, CO₂ and H₂O) increases (1,200 ppm), the longwave cooling of the cloud tops weakens, because the downwelling longwave radiation that reaches the cloud tops from above emanates at lower levels with higher temperatures relative to the cloud-top temperatures.
2. How difficult is it to reverse the clouds feedback once the tipping point has been crossed?
When CO₂ levels are lowered again after the stratocumulus breakup, the stratocumulus decks only reform once the CO₂ levels drop below 300 ppm.
3. How is the 8°C temperature rise calculated?
Subtropical marine stratocumulus clouds cover about 6.5% of the Earth’s surface and, where they occur, reduce the solar radiative energy flux absorbed in the climate system by ~110 Wm⁻², compared to about a 10 Wm⁻² reduction by scattered cumulus. If we assume a climate sensitivity parameter of 1.2 K (Wm⁻²)⁻¹ (as for the more sensitive among current GCMs), this implies (110−10) Wm⁻²×6.5%×1.2 K (Wm⁻²)⁻¹ ≈8K global-mean surface warming when subtropical marine stratocumulus break up.
What are stratocumulus clouds? Where are they located?
Abrupt stratocumulus cloud shattering
 |
| [ from earlier post ] |
Could peak greenhouse gas concentrations in one spot break up droplets into water vapor, thus raising CO₂e and propagating break-up of more droplets, etc., to shatter entire clouds?
Moreover, could an extra burst of methane from the seafloor of the Arctic Ocean alone suffice to trigger the clouds tipping point and then abruptly push global temperatures up by an additional 8°C?
From:
• Overshoot or Omnicide?
https://arctic-news.blogspot.com/2021/03/overshoot-or-omnicide.html
This possibility is further explored below.
The NASA image below shows the October 2021 temperature anomaly. The Arctic is heating up enormously, with anomalies showing up as high as 9.1°C, as discussed in an earlier post.

The MetOp satellite recorded a peak methane level of 3644 ppb and a mean level of 1944 ppb at 367 mb on November 21, 2021, pm, as discussed in an earlier post.
The above images are from the post 'Human Extinction by 2022?', at:


Hourly CO₂ levels as high as around 430 ppm were recorded at Mauna Loa recently, as illustrated by the above image.
As illustrated by the image on the right, a carbon dioxide level as high as around 427 ppm was recorded recently at Mauna Loa, Hawaii. This constitutes an increase of over 100 ppm since flask records started in 1969.
Carbon dioxide (CO₂) peaks can be quite high. As illustrated by the image on the right, a carbon dioxide level as high as around 427 ppm was recorded recently at Mauna Loa, Hawaii. This constitutes an increase of over 100 ppm since flask records started in 1969.
 |
| [ click on images to enlarge ] |
NOAA registered 336.45 ppb for nitrous oxide (N₂O) for January 2023. Further drivers of climate change are CFCs, HCFCs and HFCs, which NOAA gives about twice as much radiative forcing as N₂O.
The upcoming El Nino will cause a temperature rise that can additionally act as a trigger to unleash and accelerate further developments, such as caused by sea ice loss and changes in aerosols that can abruptly speed up the temperature rise, and thus also further raise the amount of water vapor in the atmosphere and further raise CO₂e levels.
The above text and images are from the post 'Will there be Arctic sea ice left in September 2023?' at:
When using an hourly carbon dioxide peak of 424 ppm and the above peak methane level of 3644 ppb, which at a 1-year GWP of 200 translates into 728.8 ppm CO₂e, they together add up to a total of 1152.8 ppm CO₂e, i.e. close to 1200 ppm CO₂e. In other words, peak CO₂ and methane levels could - when coinciding - cause CO₂e to approach and even reach the clouds tipping point, and this without even adding further forcers such as nitrous oxide and without further events and developments that could additionally speed up the temperature rise.
The image below, from an earlier post, shows annual global mean methane with a trend added that points at a methane rise that could in 2028 represent a forcing of 780 ppm CO₂e (with a 1-year GWP of 200), which means that the clouds tipping point at 1200 ppm CO₂e would be reached in 2028 due to mean methane and carbon dioxide alone (i.e. assuming a mean carbon dioxide concentration of at least 420 ppm and without even taking into account further forcers, events and developments that could additionally speed up the temperature rise).

Alternatively, the clouds tipping point could be crossed instantly in case of a large abrupt eruption of methane, assuming a CO₂ concentration of more than 410 ppm. This could happen with an eruption of methane smaller than the amount currently in the atmosphere, while there are further forcers, events and developments that could additionally speed up the temperature rise. Furthermore, the NOAA data used in the above image are for marine surface measurements. More methane tends to accumulate at higher altitudes, as illustrated by the compilation image and text below, from an earlier post.

NOAA's globally averaged marine surface mean for April 2022 was 1909.9 ppb. The above image shows that, on September 4, 2022 am, the MetOp satellite recorded a mean methane concentration of 1904 ppb at 586 mb, which is close to sea level. At 293 mb, the MetOp satellite recorded a mean of 1977 ppb, while at 218 mb it recorded a peak of 2805 ppb.
Such high methane levels could be caused by destabilization of methane hydrates at the seafloor of the Arctic Ocean, with large amounts of methane erupting (increasing 160 x in volume) and rising up at accelerating speed through the water column (since methane is lighter than water), concentrated in the form of plumes, which makes that less methane gets broken down in the water by microbes and in the air by hydroxyl, of which there is very little in the Arctic in the first place. Such a methane eruption entering the atmosphere in the form of a plume can be hard to detect as long as it still doesn't cover enough of the 12 km in diameter footprint to give a pixel the color associated with high methane levels.
The clouds tipping point could thus be crossed due to an additional amount of methane from an abrupt eruption of the seafloor that is smaller than the 5 Gt that is currently in the atmosphere, while 5 Gt is only 10% of the 50 Gt that Natalia Shakhova et al. warned about long ago, while 50 Gt is in turn only a small fraction of all the methane contained in sediments in the Arctic. On its own, an additional 5 Gt of seafloor methane could raise the global mean methane concentration by another 1977 ppb which, at a 1-year GWP of 200, would translate into another 395.4 ppm CO₂e. Adding up 2 x 395.4 ppm CO₂e and 410 ppm CO₂ gives a total of 1200.8 ppm CO₂e.
There are further forcers, events and developments to be taken into account, which means that the clouds tipping point could be crossed even with a far smaller abrupt release of seafloor methane.

Importantly, depicted above is only one scenario out of many. Things may eventuate in different order and occur simultaneously, i.e. instead of one domino tipping over the next one sequentially, many events may occur simultaneously and reinforce each other. Further events and developments could be added to the list, such as ocean stratification and stronger storms that can push large amounts of warm salty water into the Arctic Ocean.
Here is another example of such a scenario. Recent studies indicate that human-caused climate change will soon increase El Niño frequency and intensity. Accordingly, the upcoming El Niño may well be strong. We're currently in the depth of a persistent La Niña, which suppresses the temperature rise, whereas the opposite occurs during El Niño, which amplifies the temperature rise, and this especially affects the Arctic, which is already heating up much faster than the rest of the world. Also, the upcoming El Niño may very well coincide with a peak in sunspots in 2025, further pushing up temperatures.
Here is another example of such a scenario. Recent studies indicate that human-caused climate change will soon increase El Niño frequency and intensity. Accordingly, the upcoming El Niño may well be strong. We're currently in the depth of a persistent La Niña, which suppresses the temperature rise, whereas the opposite occurs during El Niño, which amplifies the temperature rise, and this especially affects the Arctic, which is already heating up much faster than the rest of the world. Also, the upcoming El Niño may very well coincide with a peak in sunspots in 2025, further pushing up temperatures.

A huge amount of heat has built up in the North Atlantic off the coast of North America, as illustrated by the image on the right.
As discussed in an earlier post, rising temperatures result in stronger winds along the path of the Gulf Stream that can make huge amounts of warm, salty water travel from the Atlantic Ocean toward the Arctic and reach shallow parts of the Arctic Ocean such as the East Siberian Arctic Shelf (ESAS), where most of the sea is less than 50 m deep. The danger is illustrated by the Argo float compilation below.

Such events and developments could unfold in just a few years time, say by the end of the year 2026, as illustrated by the image below.
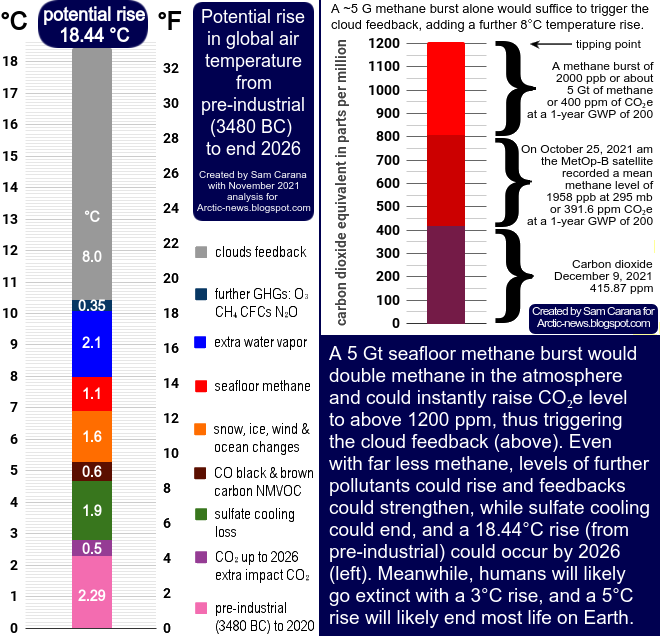
A 5 Gt seafloor methane burst would double the methane in the atmosphere and could instantly raise CO₂e level to above 1200 ppm, thus triggering the cloud feedback (panel top right). Even with far less methane, levels of further pollutants could rise and feedbacks could strengthen, while sulfate cooling could end, and a 18.44°C rise (from pre-industrial) could occur by 2026 (left panel). Meanwhile, humans will likely go extinct with a 3°C rise, and a 5°C rise will likely end most life on Earth.
Above image and caption are from the post:
The image on the right is adapted from NASA and shows anomalies versus 1951-1980 of up to 4.79°C. The image also shows that the Arctic is heating up much faster than the rest of the world, a phenomenon known as accelerated Arctic temperature rise.
The next image on the right illustrates how two of these feedbacks contribute to the accelerated Arctic temperature rise:
• News release: Earth is dimming due to climate change
• Study: Greater committed warming after accounting for the pattern effect - by Chen Zhou et al. (2021)
https://www.nature.com/articles/s41558-020-00955-x
A 5 Gt seafloor methane burst would double the methane in the atmosphere and could instantly raise CO₂e level to above 1200 ppm, thus triggering the cloud feedback (panel top right). Even with far less methane, levels of further pollutants could rise and feedbacks could strengthen, while sulfate cooling could end, and a 18.44°C rise (from pre-industrial) could occur by 2026 (left panel). Meanwhile, humans will likely go extinct with a 3°C rise, and a 5°C rise will likely end most life on Earth.
Above image and caption are from the post:
• Terrifying Arctic methane levels
https://arctic-news.blogspot.com/2021/12/terrifying-arctic-methane-levels.html
https://arctic-news.blogspot.com/2021/12/terrifying-arctic-methane-levels.html
• The temperature rise that has already unfolded from pre-industrial
Water vapor and clouds
The above study by Tapio Schneider et al. finds that stratus cloud decks, which cover about 20% of subtropical oceans and are prevalent in the eastern portions of those oceans—for example, off the coasts of California or Peru, begin to break up rather abruptly when CO₂e levels rise above the tipping point of 1,200 ppm.
As concentrations of greenhouse gases keep rising, when could the clouds tipping point be reached and to what extent could the rise in water vapor contribute to the tipping point of 1200 ppm CO₂e to get crossed? What is the influence of water vapor? When averaged over the globe, increased water vapor does cause the temperature to rise, but this rise is often regarded to be outweighed by an increase in low cloud cover that causes more sunlight to be reflected back into space, and that thus causes cooling.
As concentrations of greenhouse gases keep rising, when could the clouds tipping point be reached and to what extent could the rise in water vapor contribute to the tipping point of 1200 ppm CO₂e to get crossed? What is the influence of water vapor? When averaged over the globe, increased water vapor does cause the temperature to rise, but this rise is often regarded to be outweighed by an increase in low cloud cover that causes more sunlight to be reflected back into space, and that thus causes cooling.
Even so, the situation is different at higher latitudes, where there is less sunlight, particularly during Winter. Furthermore, many feedbacks particularly affect the Arctic, resulting in acceleration of the temperature rise in the Arctic.
The danger is that, as temperatures rise, low cloud cover will decrease strongly at higher latitudes, and this will cause the rise in water vapor to be felt more strongly at higher latitudes, thus constituting another feedback that is felt particularly strongly at higher latitudes, contributing further to amplification of the temperature rise at higher latitudes.
The danger is that, as temperatures rise, low cloud cover will decrease strongly at higher latitudes, and this will cause the rise in water vapor to be felt more strongly at higher latitudes, thus constituting another feedback that is felt particularly strongly at higher latitudes, contributing further to amplification of the temperature rise at higher latitudes.
 |
| [ click on images to enlarge ] |
The next image on the right illustrates how two of these feedbacks contribute to the accelerated Arctic temperature rise:
 |
| [ Two out of numerous feedbacks ] |
- Feedback #1: albedo loss as sea ice melts away and as it gets covered by soot, dust, algae, meltpools and rainwater pools;
Feedback #19: distortion of the Jet Stream as the temperature difference narrows between the Arctic and the Tropics, in turn causing further feedbacks to kick in stronger, such as hot air moving into the Arctic and cold air moving out, and more extreme weather events bringing heavier rain and more intense heatwaves, droughts and forest fires that cause black carbon to settle on the sea ice.
Related studies and discussions
1. Earthshine decline
Warming oceans cause fewer bright clouds to reflect sunlight into space, admitting even more energy into earth's climate system
https://news.agu.org/press-release/earth-is-dimming-due-to-climate-change
• Study: Earth's Albedo 1998–2017 as Measured From Earthshine - by Philip Goode et al. (2021)
https://agupubs.onlinelibrary.wiley.com/doi/10.1029/2021GL094888
discussed at:
https://www.facebook.com/groups/arcticnews/posts/10159604016414679
2. The pattern effect
• News release: Paying for emissions we’ve already released
• Study: Earth's Albedo 1998–2017 as Measured From Earthshine - by Philip Goode et al. (2021)
https://agupubs.onlinelibrary.wiley.com/doi/10.1029/2021GL094888
discussed at:
https://www.facebook.com/groups/arcticnews/posts/10159604016414679
2. The pattern effect
 |
| [ from earlier post ] |
• News release: Paying for emissions we’ve already released
• Study: Greater committed warming after accounting for the pattern effect - by Chen Zhou et al. (2021)
https://www.nature.com/articles/s41558-020-00955-x
discussed at:
https://www.facebook.com/groups/arcticnews/posts/10159009753799679
and at:
https://www.facebook.com/SamCarana/posts/10164808484750161
https://www.facebook.com/groups/arcticnews/posts/10159009753799679
and at:
https://www.facebook.com/SamCarana/posts/10164808484750161
and at:
3. Clouds amplify global heating
• News release: Global satellite data shows clouds will amplify global heating (2021)
https://www.imperial.ac.uk/news/226553/global-satellite-data-shows-clouds-will
• Study: Observational evidence that cloud feedback amplifies global warming - by Paulo Ceppi et al. https://www.pnas.org/content/118/30/e2026290118
discussed at:
https://www.facebook.com/groups/arcticnews/posts/101594668746646794. Net effect of clouds is more global heating
• News release: International analysis narrows range of climate’s sensitivity to CO2 (2020)
https://newsroom.unsw.edu.au/news/science-tech/international-analysis-narrows-range-climate%E2%80%99s-sensitivity-co2
• After 40 years, researchers finally see Earth's climate destiny more clearly (2020)
https://www.science.org/content/article/after-40-years-researchers-finally-see-earths-climate-destiny-more-clearly
• The climate won’t warm as much as we feared – but it will warm more than we hoped - by Steven Sherwood et al. (2020)
https://theconversation.com/the-climate-wont-warm-as-much-as-we-feared-but-it-will-warm-more-than-we-hoped-143175
https://theconversation.com/the-climate-wont-warm-as-much-as-we-feared-but-it-will-warm-more-than-we-hoped-143175
• Study: An Assessment of Earth's Climate Sensitivity Using Multiple Lines of Evidence - by Steven Sherwood et al. (2020)
https://agupubs.onlinelibrary.wiley.com/doi/10.1029/2019RG000678
discussed at:
5. Tipping point 478.6 ppm CO₂
• News release: Time Lag Between Intervention and Actual CO2 Decrease Could Still
Lead to Climate Tipping Point (2021)
https://news.ncsu.edu/2021/12/time-lag-could-still-lead-to-climate-tipping-point
https://news.ncsu.edu/2021/12/time-lag-could-still-lead-to-climate-tipping-point
• Investigating climate tipping points under various emission reduction and carbon capture scenarios with a stochastic climate model - by
Alexander Mendez et al. (2021)
discussed at:
6. Maximum warming occurs about one decade after carbon dioxide emission
• Maximum warming occurs about one decade after carbon dioxide emission
• Maximum warming occurs about one decade after a carbon dioxide emission - by Katharine Ricke et al.
https://iopscience.iop.org/article/10.1088/1748-9326/9/12/124002
• Positive tropical marine low-cloud cover feedback inferred from cloud-controlling factors - by Xin Qu et al. (2015)
https://agupubs.onlinelibrary.wiley.com/doi/epdf/10.1002/2015GL065627
• Interpretation of Factors Controlling Low Cloud Cover and Low Cloud Feedback Using a Unified Predictive Index - by Hideaki Kawai et al. (2017)
• Estimated cloud-top entrainment index explains positive low-cloud-cover feedback - by Tsuyoshi Koshiro et al. (2022)
https://www.pnas.org/doi/10.1073/pnas.2200635119

• Systematic warming pool discovered in the Pacific due to human activities
7. Global warming causes reduction of lower clouds, accelerating global heating
https://agupubs.onlinelibrary.wiley.com/doi/epdf/10.1002/2015GL065627
https://www.pnas.org/doi/10.1073/pnas.2200635119
8. Higher sea surface temperatures result in less winter-time low-cloud cover and therefore less cooling
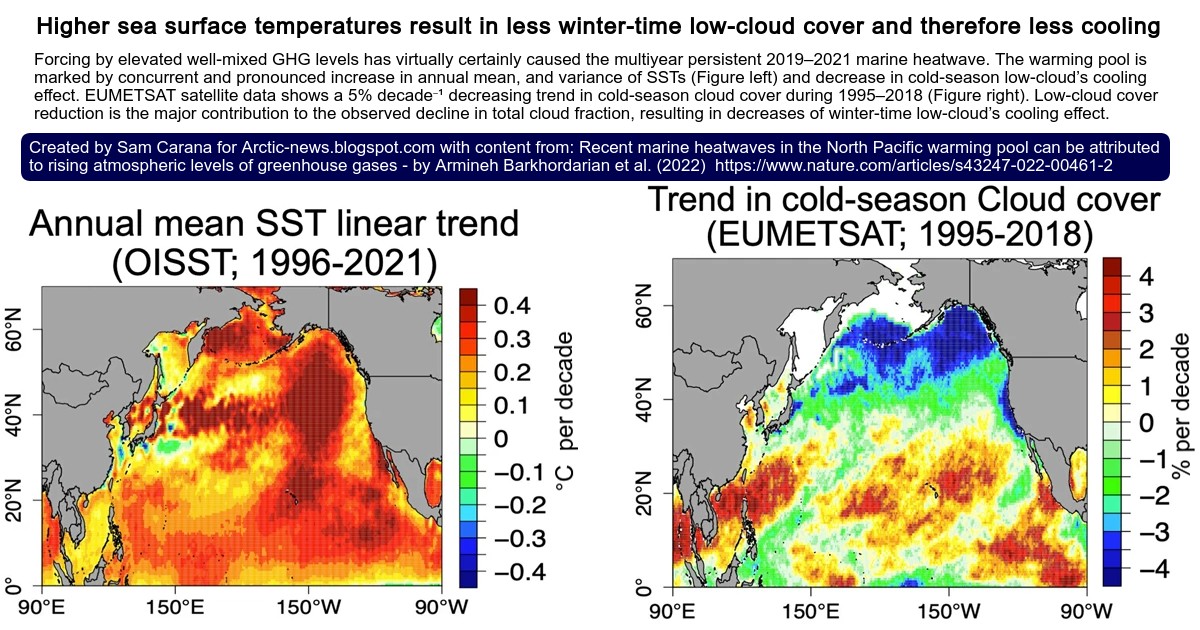
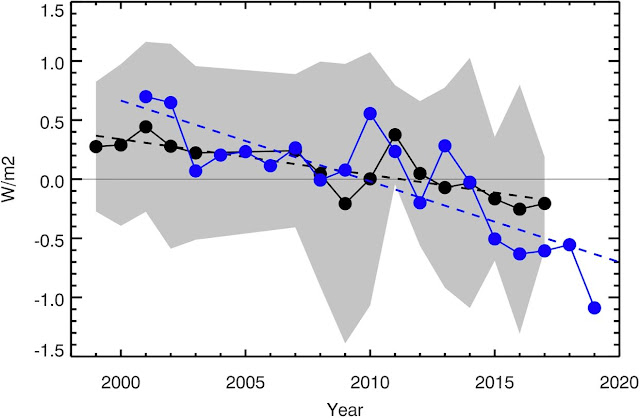
Forcing by elevated well-mixed GHG levels has virtually certainly caused the multiyear persistent 2019–2021 marine heatwave. The warming pool is marked by concurrent and pronounced increase in annual mean, and variance of SSTs (Figure below left) and decrease in cold-season low-cloud’s cooling effect. EUMETSAT satellite data shows a 5% decade⁻¹ decreasing trend in cold-season cloud cover during 1995–2018 (Figure below right). Low-cloud cover reduction is the major contribution to the observed decline in total cloud fraction, resulting in decreases of winter-time low-cloud’s cooling effect.
• Systematic warming pool discovered in the Pacific due to human activities
https://www.cliccs.uni-hamburg.de/about-cliccs/news/2022-news/2022-06-21-pm-marine-heat-waves.html
9. Temperature looks set to keep rising
An analysis by Jorgen Randers et al. points out that, even if all greenhouse gas emissions by people could stop immediately and even if the temperature anomaly could fall to 0.5°C above pre-industrial, greenhouse gas levels would start rising again after 2150 and keep rising for centuries to come.
Another analysis by Tapio Schneider et al., points out that solar geoengineering may not prevent strong warming from direct effects of CO₂ on stratocumulus cloud cover.
This means that the threat is even more menacing when including large methane releases that threaten to occur as temperatures keep rising in the Arctic and sediments at the seafloor of the Arctic Ocean threaten to get destabilized, resulting in the eruption of huge amounts of methane.
As discussed in an earlier post, an analysis by Ganapolski et al. indicates that even moderate anthropogenic cumulative carbon dioxide emissions would cause an absence of the snow and ice cover in the next Milankovitch cycle, so there would be no buffer at the next peak in insolation, and temperatures would continue to rise, making the absence of snow and ice a permanent loss for millennia to come.
• An earth system model shows self-sustained thawing of permafrost even if all man-made GHG emissions stop in 2020 - by Jorgen Randers et al. (2021)
https://www.nature.com/articles/s41598-020-75481-z
discussed at:
• Recent marine heatwaves in the North Pacific warming pool can be attributed to rising atmospheric levels of greenhouse gases - by Armineh Barkhordarian et al. (2022)
discussed at:
 |
| [ click on images to enlarge ] |
Another analysis by Tapio Schneider et al., points out that solar geoengineering may not prevent strong warming from direct effects of CO₂ on stratocumulus cloud cover.
This means that the threat is even more menacing when including large methane releases that threaten to occur as temperatures keep rising in the Arctic and sediments at the seafloor of the Arctic Ocean threaten to get destabilized, resulting in the eruption of huge amounts of methane.
As discussed in an earlier post, an analysis by Ganapolski et al. indicates that even moderate anthropogenic cumulative carbon dioxide emissions would cause an absence of the snow and ice cover in the next Milankovitch cycle, so there would be no buffer at the next peak in insolation, and temperatures would continue to rise, making the absence of snow and ice a permanent loss for millennia to come.
https://www.nature.com/articles/s41598-020-75481-z
discussed at:
https://www.facebook.com/SamCarana/posts/10164574764915161
• Critical insolation–CO2 relation for diagnosing past and future glacial inception - by Andrey Ganapolski et al. (2016)
https://www.nature.com/articles/nature16494
• Solar geoengineering may not prevent strong warming from direct effects of CO2 on stratocumulus cloud cover - by Tapio Schneider et al.
https://www.pnas.org/content/early/2020/11/10/2003730117
• CO2 levels in Earth’s atmosphere will be higher than at any time in the last 3.3 million years by 2025
https://www.southampton.ac.uk/.../co2-levels-rise-2025.page
• Atmospheric CO2 during the Mid-Piacenzian Warm Period and the M2 glaciation - by Elwyn de la Vega et al. (2020)
https://www.nature.com/articles/s41598-020-67154-8
discussed at:
Important also is the rate of change. Current temperatures are rising faster than they ever did in history.
From the post:
• When will humans go extinct?
• Critical insolation–CO2 relation for diagnosing past and future glacial inception - by Andrey Ganapolski et al. (2016)
https://www.nature.com/articles/nature16494
https://www.pnas.org/content/early/2020/11/10/2003730117
• There is no time to lose
https://arctic-news.blogspot.com/2020/11/there-is-no-time-to-lose.html
https://arctic-news.blogspot.com/2020/11/there-is-no-time-to-lose.html
discussed at:
• CO2 levels in Earth’s atmosphere will be higher than at any time in the last 3.3 million years by 2025
https://www.southampton.ac.uk/.../co2-levels-rise-2025.page
• Atmospheric CO2 during the Mid-Piacenzian Warm Period and the M2 glaciation - by Elwyn de la Vega et al. (2020)
https://www.nature.com/articles/s41598-020-67154-8
discussed at:
10. Rate of change
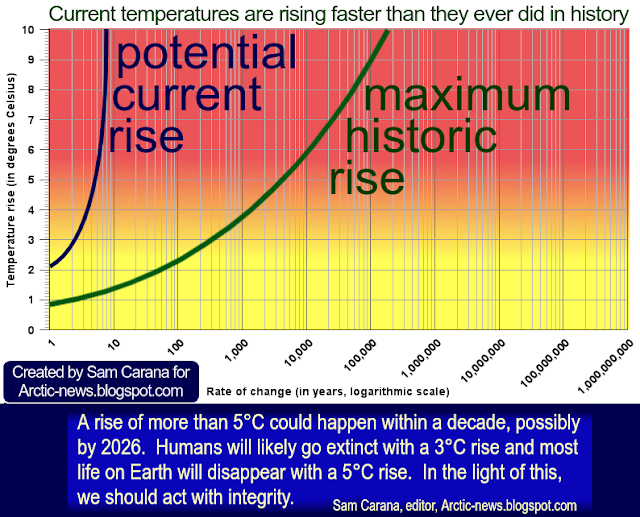 |
| [ from: When will humans go extinct? ] |
• When will humans go extinct?
11. Events and developments leading up to reaching the clouds tipping point
• Blue Ocean Event 2022?
discussed at: