Showing posts with label growth. Show all posts

Saturday, April 27, 2024

CO2 keeps accelerating

The Scripps Institution of Oceanography, UC San Diego, reported a daily average carbon dioxide (CO₂) at Mauna Loa, Hawaii, of 428.63 parts per million (ppm) on April 26, 2024, as illustrated by the image below. 

This is the highest daily average on record at Mauna Loa, which is the more remarkable since the annual CO₂ maximum is typically reached in May, so even higher values are likely to be reached over the next few weeks. 

The image below, adapted from NOAA, shows that the weekly mean CO₂ at Mauna Loa was 427.94 ppm for the week beginning on April 21, 2024, i.e. 3.98 ppm higher than the 423.96 ppm for the week 1 year earlier.

The image below, adapted from NOAA, shows that the daily mean CO₂ at Mauna Loa on April 26, 2024, was 428.59 ppm, a difference of 4.7 ppm from April 26, 2023.


The image below, adapted from NOAA, shows that the annual CO₂ growth at Mauna Loa in 2023 was 3.36 ppm, the highest annual growth on record.

The image below shows the daily average carbon dioxide recorded by NOAA over the past few years at Mauna Loa, Hawaii. 

Clouds Tipping Point

The image below illustrates that a polynomial trend (red) follows the recent acceleration in CO₂ concentration in the atmosphere more than a linear trend (blue). Data used are NOAA Mauna Loa weekly average CO₂ data through the week starting on April 21, 2024 (data downloaded April 28, 2024). 


The image below is the same as the image above, except that the canvas is zoomed out to show all data on record with trends extended to 2060 (X-axis) and CO₂ concentration going from 300 ppm to 1200 ppm (Y-axis). 


The red polynomial trend also illustrates how rising CO₂ can cause the clouds tipping point at 1200 ppm to be crossed well before 2060, i.e. earlier than anticipated in IPCC models (inset).

Moreover, the clouds tipping point could be crossed much earlier than 2060 when also taking into account methane. Peak daily average methane is approaching 2000 parts per billion (ppb) at Mauna Loa, Hawaii, as illustrated by the image below.


A methane concentration of 2000 ppb corresponds, at a Global Warming Potential (GWP) of 200, with a carbon dioxide equivalent (CO₂e) of 400 ppm. Together with the above daily average CO₂ concentration of 428.63 ppm this adds up to a joint CO₂e of 828.63 ppm, i.e. only 371.37 ppm away from the clouds tipping point (at 1200 ppm CO₂e) that on its own could raise the global temperature by 8°C.

This 371.37 ppm CO₂e could be added almost immediately by a burst of seafloor methane less than the size of the methane that is currently in the atmosphere (about 5 Gt). There is plenty of potential for such an abrupt release, given the rising ocean heat and the vast amounts of methane present in vulnerable sediments at the seafloor of the Arctic Ocean, as discussed in earlier posts such as this one.

Already now, local peaks can at times reach very high levels. The image below shows that the NOAA-20 satellite recorded a peak level of 2432 ppb at 399.1 mb on April 25, 2024, am. 


The MetOp-B satellite (also known as MetOp-1) recorded a peak methane level of 3644 ppb and a mean level of 1944 ppb at 367 mb on November 21, 2021, pm, as illustrated by the image below. 
[ from earlier post ]
[ from earlier post ]
Catastrophic crack propagation is what makes a balloon pop. Could low-lying clouds similarly break up and vanish abruptly? Could peak greenhouse gas concentrations in one spot break up droplets into water vapor, thus raising CO₂e and propagating break-up of more droplets, etc., to shatter entire clouds?

Could a combination of high CO₂ levels and high peak levels of methane suffice to cause the clouds tipping point to be crossed?

Moreover, nitrous oxide is also rising and there are additional elements that could further speed up the rise in CO₂e, as discussed at the Extinction page and this earlier post that warn about the potential for a temperature rise of well over 18°C to unfold as early as 2026.

A 2018 study (by Strona & Bradshaw) indicates that most life on Earth will disappear with a 5°C rise. Humans, who depend for their survival on many other species, will likely go extinct with a 3°C rise, as illustrated by the image below, from an earlier post.


Environmental crimes

The accelerating growth in carbon dioxide indicates that politicians have failed and are failing to take adequate action. 

Current laws punish people for the most trivial things, while leaving the largest crime one can imagine unpunished: planetary omnicide!

[ from earlier post ]

The image below is from the post Planetwide Ecocide - The Crime Against Life on Earth, by Andrew Glikson


If we accept that crimes against humanity include climate crimes, then politicians who inadequately act on the unfolding climate catastrophe are committing crimes against humanity and they should be brought before the International Criminal Court in The Hague, the Netherlands.

[ image from earlier post ]

Climate Emergency Declaration

The situation is dire and the precautionary principle calls for rapid, comprehensive and effective action to reduce the damage and to improve the situation, as described in this 2022 post, where needed in combination with a Climate Emergency Declaration, as discussed at this group.


Links

• NOAA - Carbon Cycle Gases - Mauna Loa, Hawaii, United States
https://gml.noaa.gov/dv/iadv/graph.php?code=MLO&program=ccgg&type=ts

• Scripps Institution of Oceanography
https://keelingcurve.ucsd.edu

• NOAA - Weekly average CO2 at Mauna Loa 
https://gml.noaa.gov/ccgg/trends/weekly.html

• NOAA - annual mean carbon dioxide growth rates for Mauna Loa
https://gml.noaa.gov/ccgg/trends/gr.html

• NOAA - greenhouse gases at Mauna Loa 

• How long do we have?
https://arctic-news.blogspot.com/2019/04/how-long-do-we-have.html


• Blue Ocean Event 2024?

• Potential temperature trends

• Co-extinctions annihilate planetary life during extreme environmental change, by Giovanni Strona and Corey Bradshaw (2018)
https://www.nature.com/articles/s41598-018-35068-1

• CO2 rise is accelerating


Friday, March 15, 2024

CO2 rise is accelerating

On March 15, 2024, the daily average carbon dioxide (CO₂) at Mauna Loa, Hawaii, was 427.93 parts per million (ppm), as illustrated by the image below, adapted from NOAA. 

This is the highest daily in situ average in the NOAA record at Mauna Loa, which is the more remarkable since the annual CO₂ maximum is typically reached in May, so even higher values are likely to be reached over the next few months. 

The image below, adapted from NOAA, shows 31 days of CO₂ at Mauna Loa, Hawaii. The image shows that a daily mean CO₂ of 427.93 ppm was recorded on March 15, 2024, and that many of the hourly averages that were recorded in April 2024 were higher than 430 ppm.

The image below, adapted from the Scripps Institution of Oceanography, shows that CO₂ at Mauna Loa was 427.80 ppm on March 14, 2024. The background shows six months of CO₂ ending March 15, 2024. 

The image below, adapted from NOAA, shows that the monthly mean CO₂ at Mauna Loa in March 2024 was 425.38 ppm, a growth of 4.39 ppm compared to March 2023. 

The image below, adapted from NOAA, shows that the annual CO₂ growth at Mauna Loa in 2023 was 3.36 ppm, the highest annual growth on record.

Temperature rise

The February 2024 global surface temperature is 1.75°C or 3.15°F when compared to a base of 1886-1915, i.e. a 30-year period centered around the year 1900, as illustrated by the image below. The image shows part (from 1980) of a graph based on NASA Land+Ocean data from January 1880 through February 2024, with the black squares showing the raw monthly data. 

The rise is as large as 2.74°C or 3.132°F when compared to a pre-industrial base and when also taking into account ocean air temperatures and higher polar anomalies, as indicated in the bright yellow inset on the image below. 

Lowess smoothing (red line, 1 year window) highlights variability between years and the huge rise that has occurred recently, which is partly caused by variability such as associated with El Niño. 

The red line also highlights the potential for an even larger rise to come soon, as feedbacks and further developments start to kick in with greater ferocity, contributing to non-linear and abrupt temperature rise, as discussed in earlier posts such as this one and this one

The use of an early date for a pre-industrial base is discussed at the pre-industrial page and is supported by recent analysis of sponges collected in the Caribbean, illustrated by the image below.

[ from earlier post ]

Other recent research debunks the idea that Earth’s surface (across land and sea) has experienced really hot temperatures over the last two billion years. Instead, it shows that Earth has had a relatively stable and mild climate. This makes the threat of a huge temperature rise over the next few years even more menacing. 

The temperature is rising most rapidly in the Arctic. Loss of sea ice threatens to accelerate the temperature rise in the Arctic even more, and cause destabilization of methane hydrates at the bottom of the Arctic Ocean and thawing of permafrost on land, resulting in massive releases of greenhouse gases, further acceleration of the temperature rise and widespread extinction of species (including humans) as early as in the year 2026.

Clouds Tipping Point

The image below illustrates that a polynomial trend (red) can better capture the acceleration in the rise in CO₂ concentration in the atmosphere than a linear trend (blue). 

The red polynomial trend also illustrates how rising CO₂ can cause the clouds tipping point at 1200 ppm to be crossed before 2100, i.e. earlier than anticipated in IPCC models (inset).

Moreover, the clouds tipping point could be crossed much earlier when also taking into account methane. Monthly methane was about 1960 parts per billion (ppb) recently at Mauna Loa, Hawaii, as illustrated by the image below.


A methane concentration of 1960 ppb corresponds, at a Global Warming Potential (GWP) of 200, with a carbon dioxide equivalent (CO₂e) of 392 ppm. Together with the above daily average CO₂ concentration of 427.93 ppm this adds up to a joint CO₂e of 819.93 ppm, i.e. only 380.07 ppm away from the clouds tipping point (at 1200 ppm CO₂e) that on its own could raise the global temperature by 8°C.

This 380.07 ppm CO₂e could be added almost immediately by a burst of seafloor methane less than the size of the methane that is currently in the atmosphere (about 5 Gt). There is plenty of potential for such an abrupt release, given the rising ocean heat and the vast amounts of methane present in vulnerable sediments at the seafloor of the Arctic Ocean, as discussed in earlier posts such as this one.

Furthermore, nitrous oxide is also rising and there are additional elements that could further speed up the temperatures rise, as discussed at the Extinction page, which shows that, altogether, there is the potential for a temperature rise of well over 18°C by 2026.

A 2018 study (by Strona & Bradshaw) indicates that most life on Earth will disappear with a 5°C rise. Humans, who depend for their survival on many other species, will likely go extinct with a 3°C rise, as illustrated by the image below, from an earlier post.


Environmental crimes

The accelerating growth in carbon dioxide indicates that politicians have failed and are failing to take adequate action. 

Current laws punish people for the most trivial things, while leaving the largest crime one can imagine unpunished: planetary omnicide!

[ from earlier post ]

The image below is from the post Planetwide Ecocide - The Crime Against Life on Earth, by Andrew Glikson


If we accept that crimes against humanity include climate crimes, then politicians who inadequately act on the unfolding climate catastrophe are committing crimes against humanity and they should be brought before the International Criminal Court in The Hague, the Netherlands.

[ image from earlier post ]

Meanwhile, Belgium has recognised ecocide as international crime and the EU Parliament has voted to criminalize the most serious cases of ecosystem destruction. 

Climate Emergency Declaration

The situation is dire and the precautionary principle calls for rapid, comprehensive and effective action to reduce the damage and to improve the situation, as described in this 2022 post, where needed in combination with a Climate Emergency Declaration, as discussed at this group.


Links

• NOAA - Carbon Cycle Gases - Mauna Loa, Hawaii, United States
https://gml.noaa.gov/dv/iadv/graph.php?code=MLO&program=ccgg&type=ts

• Scripps Institution of Oceanography
https://keelingcurve.ucsd.edu

• NOAA - Weekly average CO2 at Mauna Loa 
https://gml.noaa.gov/ccgg/trends/weekly.html

• NOAA - annual mean carbon dioxide growth rates for Mauna Loa
https://gml.noaa.gov/ccgg/trends/gr.html

• NOAA - greenhouse gases at Mauna Loa 

• Belgium becomes first in EU to recognise ecocide as international crime 
https://www.facebook.com/groups/climateplan/posts/8012665172096853

• ‘Revolutionary’: EU Parliament votes to criminalise most serious cases of ecosystem destruction 

• How long do we have?
https://arctic-news.blogspot.com/2019/04/how-long-do-we-have.html


• Blue Ocean Event 2024?

• Potential temperature trends

• Co-extinctions annihilate planetary life during extreme environmental change, by Giovanni Strona and Corey Bradshaw (2018)
https://www.nature.com/articles/s41598-018-35068-1

• NASA GISTEMP - Temperature analysis Plots
https://data.giss.nasa.gov/gistemp/graphs_v4/customize.html

• Tragedy set to unfold in tropics 
https://arctic-news.blogspot.com/2024/02/tragedy-set-to-unfold-in-tropics.html

• 300 years of sclerosponge thermometry shows global warming has exceeded 1.5 °C - by Malcolm McCulloch et al. (2024)
https://www.nature.com/articles/s41558-023-01919-7
discussed at facebook at: 
https://www.facebook.com/groups/arcticnews/posts/10161250170389679

• Oxygen isotope ensemble reveals Earth’s seawater, temperature, and carbon cycle history - by Terry Isson et al. 

Monday, September 24, 2018

Looking the climate abyss in the eye!


Growth of CO₂ in the atmosphere is accelerating. The image shows the growth rate in parts per million (ppm), based on annual Mauna Loa data (1959-2017), with a 4th-order polynomial trend added.

While no data are yet available for the year 2018, the trend on above image points at 2.65 ppm. The image below shows the level for the most recent week, which is 2.53 ppm above the corresponding week a year ago.


Carl Rasmussen calculates that the de-seasonalised growth rate has now (at the middle of 2018) reached ±2.3 ppm/y. Carl adds: "the rate of growth is itself growing, [it is] the highest growth rate ever seen in modern timesThis is not just a 'business as usual' scenario, it is worse than that, we're actually moving backward, becoming more and more unsustainable with every year. This shows unequivocally that the efforts undertaken so-far to limit green house gases such as carbon dioxide are woefully inadequate."


Even more alarming is the growth in methane.

Peak methane levels were as high as 3.37 ppm on August 31, 2018, an ominous warning of the threat of destabilization of methane hydrates at the seafloor of the Arctic Ocean.

Mean global methane levels were as high as 1.91 ppm on the morning of September 20, 2018, at 293 millibar.

This is a level unprecedented in human history and it far exceeds the WMO-data-based trend (added on the right of above image).

Temperatures look set for a steep rise within years, as we now are fully in the danger zone.

Meanwhile, the IPCC seeks to downplay the amount of global warming that has already occurred and that looks set to eventuate over the next decade or so.

The image on the right shows the full extent of the climate abyss that we’re facing.

Have a look at the Extinction page for more details on the full extent of the threat.

How many people and species will survive the coming temperature rise? We don’t know.

The best we can do is to support climate action, i.e. action that starts immediately, and that is transformative, comprehensive and effective, as described in the Climate Plan.

Have a look at the lines of action depicted in the image below.


Links

• Blue Ocean Event
https://arctic-news.blogspot.com/2018/09/blue-ocean-event.html

• Can we weather the Danger Zone?
https://arctic-news.blogspot.com/2018/07/can-we-weather-the-danger-zone.html

• How much warmer is it now?
https://arctic-news.blogspot.com/2018/04/how-much-warmer-is-it-now.html

• 100% clean, renewable energy is cheaper
https://arctic-news.blogspot.com/2018/02/100-clean-renewable-energy-is-cheaper.html

• Feedbacks
https://arctic-news.blogspot.com/p/feedbacks.html

• How much warming have humans caused?
https://arctic-news.blogspot.com/2016/05/how-much-warming-have-humans-caused.html

• IPCC seeks to downplay global warming
https://arctic-news.blogspot.com/2018/02/ipcc-seeks-to-downplay-global-warming.html

• The Threat
https://arctic-news.blogspot.com/p/threat.html

• Extinction
https://arctic-news.blogspot.com/p/extinction.html

• Aerosols
https://arctic-news.blogspot.com/p/aerosols.html

• How extreme will it get?
https://arctic-news.blogspot.com/2012/07/how-extreme-will-it-get.html

• Climate Plan
https://arctic-news.blogspot.com/p/climateplan.html


Saturday, February 25, 2017

Accelerating growth in CO₂ levels in the atmosphere

CO₂ Growth

In 2016, CO₂ levels in the atmosphere grew by 3.36 ppm (parts per million), a new record since 1959 and much higher than the previous record set in 2015.


Worryingly, above graph has a trendline added pointing at a growth rate in CO₂ levels of 6 ppm per year by 2026.

Growth in levels of CO₂ in the atmosphere is accelerating, despite reports that - for the third year in a row - carbon dioxide emissions from fossil fuels and industry (including cement production) had barely grown, as illustrated by the Global Carbon Project image below.

Why is growth in CO₂ levels in the atmosphere accelerating?

So, what makes growth in CO₂ levels in the atmosphere accelerate? As discussed in a previous post, growth in CO₂ levels in the atmosphere is accelerating due to:
  • Deforestation and Soil Degradation:
    Agricultural practices such as depleting groundwater and aquifers, plowing, mono-cultures and cutting and burning of trees to raise livestock can significantly reduce the carbon content of soils, along with soil moisture and nutrients levels.
  • Climate change and extreme weather events:
    The recent jump in global temperature appears to have severely damaged soils and vegetation. Soil carbon loss and enhanced decomposition of vegetation appear to have occurred both because of the temperature rise and the resulting extreme weather events such as heatwaves, drought, dust-storms and wildfires, and storms, hail, lightning, flooding and the associated erosion, turning parts of what was once a huge land sink into sources of CO₂ emissions.
    Moreover, extreme weather events can also lead to emissions other than CO₂ emissions, such as soot, nitrous oxide, methane and carbon monoxide, which can in turn cause a rise in the levels of ground-level ozone, thus further weakening vegetation and making plants even more vulnerable to pests and infestations.
  • Oceans may also be taking up less CO₂ than before:
    Oceans have absorbed some 40% of CO₂ emissions since the start of the industrial era. Up until recently, oceans still took up some 26% of carbon dioxide emitted by people annually. As discussed earlier, oceans are getting warmer, and warm water holds less oxygen than cold water. Furthermore, as the water warms, it tends to form a layer at the surface that does not mix well with cooler, nutrient-rich water below, depriving phytoplankton of some of the nutrients needed in order for phytoplankton to grow. Less phytoplankton in the oceans means that oceans become less able to take up carbon dioxide from the atmosphere. A study by Boyce et al. found a decrease of about 1% per year of phytoplankton in oceans globally. Sergei Petrovskii, co-author of a 2015 study, found that a rise in the water temperature of the world’s oceans of about 6°C could stop oxygen production by phytoplankton by disrupting the process of photosynthesis, adding that “About two-thirds of the planet’s total atmospheric oxygen is produced by ocean phytoplankton – and therefore cessation would result in the depletion of atmospheric oxygen on a global scale. This would likely result in the mass mortality of animals and humans.”
Sensitivity

Meanwhile, research including a 2014 study by Franks et al. concludes that the IPCC was too low in its estimates for the upcoming temperature rise locked in for current CO₂ levels. A study by Friedrich et al. updates IPCC estimates for sensitivity to CO₂ rise, concluding that temperatures could rise by as much as 7.36°C by 2100 as a result of rising CO₂ levels.

When also taking further elements than CO₂ more fully into account, we could face an even larger temperature rise, i.e. a rise of 10°C (or 18°F) by 2026 (compared to pre-industrial), as further described at the extinction page that specifies the different elements of such a rise, including a 0.5°C rise due to CO₂ emissions from 2016 to 2026. The CO₂ growth discussed in this post appears to be in line with such a rise and in line with the associated loss of carbon sinks and rising vulnerability of carbon pools.

The situation looks particularly threatening in the Arctic where many of the most vulnerable carbon pools are located, where temperatures are rising fastest and where CO₂ levels have recently risen rapidly (see image below with CO₂ readings at Barrow, Alaska).
[ click on images to enlarge ] 
Also note the recent rise in methane readings at Barrow (image below).
[ click on images to enlarge ] 
Action is needed!

The situation is dire and calls for comprehensive and effective action, as described in the Climate Plan.


Links

• Climate Plan
http://arctic-news.blogspot.com/p/climateplan.html

• Extinction
http://arctic-news.blogspot.com/p/extinction.html

• Monthly CO₂ not under 400 ppm in 2016
http://arctic-news.blogspot.com/2016/11/monthly-co-not-under-400-ppm-in-2016.html
• Oxygenating the Arctic
http://arctic-news.blogspot.com/p/oxygenating-arctic.html

• How much warming have humans caused?
http://arctic-news.blogspot.com/2016/05/how-much-warming-have-humans-caused.html

• Warning of mass extinction of species, including humans, within one decade
http://arctic-news.blogspot.com/2017/02/warning-of-mass-extinction-of-species-including-humans-within-one-decade.html

• Global phytoplankton decline over the past century, by Daniel G. Boyce, Marlon R. Lewis & Boris Worm
http://www.nature.com/nature/journal/v466/n7306/abs/nature09268.html

• Mathematical Modelling of Plankton–Oxygen Dynamics Under the Climate Change, by Yadigar Sekerci and Sergei Petrovskii
https://link.springer.com/article/10.1007%2Fs11538-015-0126-0

• Global warming disaster could suffocate life on planet Earth, research shows
http://www2.le.ac.uk/offices/press/press-releases/2015/december/global-warming-disaster-could-suffocate-life-on-planet-earth-research-shows


Saturday, February 8, 2014

CO2 growth highest on record

Despite many promises, global emissions of carbon dioxide (CO2) continue to grow.

NOAA figures show that 2013 CO2 level growth was the highest ever recorded, i.e. 2.95 ppm.

The EPA expects U.S. 2013 energy-related CO2 emissions to be 2% higher than in 2012.

The UC San Diego image below shows CO2 levels in the atmosphere over the past two years.

Back in September 2013, John Davies warned: The world is probably at the start of a Runaway Greenhouse Event which will end most human life on Earth before 2040. This will occur because of a massive and rapid increase in the carbon dioxide concentration in the air which has just accelerated significantly. The increasing Greenhouse Gas concentration, the gases which cause Global Warming, will very soon cause a rapid warming of the global climate and a chaotic climate.

The post featured a graph with a 4th-order polynomial trendline pointing at some 7.5 ppm CO2 annual growth by 2040. While many welcomed the warning contained in the graph, some argued against using higher-order polynomial trendlines. So, for those who don't feel comfortable with a 4th-order polynomial trendline, the graph below adds both a linear trendline and a 3rd-order polynomial trendline.


The 3rd-order polynomial trendline, based on the recent data, points at CO2 annual growth of some 7 ppm by 2040, justifying the warning sounded by the 2013 graph.

And what do the recent data say, when a 4th-order polynomial trendline is applied? As the image below shows, they show an even steeper rise, reaching 7 ppm growth per year as early as 2030.


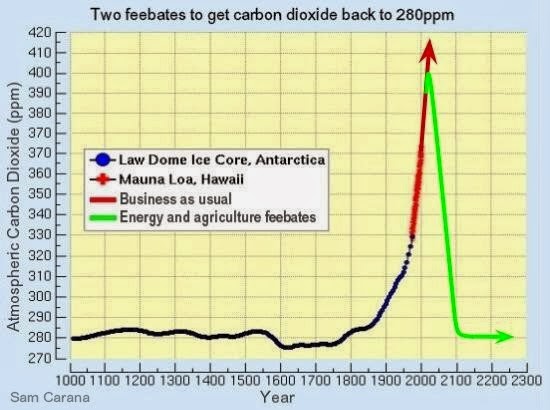
As many posts at this blog have warned, rapid growth in greenhouse gases and numerous feedbacks are threatening to push Earth into runaway global warming. This calls for comprehensive and effective action to - among other things - reduce atmospheric CO2 levels back to 280 ppm, as illustrated by the image below and as further discussed at the Climate Plan blog.


Friday, September 20, 2013

A RUNAWAY GREENHOUSE EVENT

by John Davies

A linear trendline shows steady growth in the annual increase in CO2 levels, despite promises to reduce emissions.
Furthermore, recent increases show a worrying trend illustrated in the graph by a 4th order polynomial trendline.

GROWTH RATE OF CARBON DIOXIDE IN THE ATMOSPHERE

The world is probably at the start of a runaway Greenhouse Event which will end most human life on Earth before 2040. This will occur because of a massive and rapid increase in the carbon dioxide concentration in the air which has just accelerated significantly. The increasing Greenhouse Gas concentration, the gases which cause Global Warming, will very soon cause a rapid warming of the global climate and a chaotic climate.

Immediately before the Industrial Revolution, in 1750, the concentration of carbon dioxide in the air which had been stable for millennia, the main Greenhouse gas, was 280 parts per million, but in 2013 it is likely to average 395 parts per million. It has been increasing at an increasing rate since 1750.

In 1960 the carbon dioxide concentration was 315 parts per million and in the 1960’s the concentration was increasing at 0.8 parts per million per year, in the 1980’s at 1.6 parts per million and from 2003 until 2011 inclusive it rose at 2 .0 parts per year.

In 2012 it rose 2.39 parts. Between July 2012 and July 2013 atmospheric carbon dioxide increased in concentration by 3.35 parts, by far the largest 12 month increase ever.


THIS HUGE INCREASE SHOULD BE PUBLISHED EVERYWHERE WORLDWIDE NOW

ASSESSMENT

When there have been large anomalous increases in the past, though nothing like this, there has been a rapid return to near normal but this is probably slightly different. The most likely growth in the calendar year 2013 is likely to be about 2.85 parts per million, a calendar year record , but much below the growth from July 2012 until July 2013. The growth for 2012 and 2013 is likely to average out at about 2.62 parts per million, a record for a two year period.

Again, looking to the past, when there has been a rise in concentration like we will have had in 2012 and 2013 the rate of increase in concentration diminishes for a couple of years before rising again. I would expect the rise in concentration in 2014 and 2015 to average 2.55 parts per million before rising at an increasing rate thereafter assuming the world carries on with business as usual. Nevertheless this average rate is faster than we have yet witnessed except for the 2012 and 2013 period. This rate of increase is much faster than that which preceded the greatest ever wipe out of life on earth 249 million years ago.

There is a significant uncertainty about the above growth rate in the near term, with a chance of a higher and lower growth rate though the above forecast is the most likely outcome.

There must be a small chance that this is really the start of a very fast runaway event. Should the growth rate of atmospheric carbon dioxide in 2013 be greater than about 3.1 parts per million then the world will probably have entered a very fast runaway event.

It is even more absolutely critical that carbon dioxide concentrations from August 2013 onwards are rising at a slower rate than between July 2012 and July 2013 otherwise the world will have entered a very fast runaway Greenhouse Event. Carbon Dioxide concentrations will almost certainly be rising at a slower rate from August 2013 onwards.

The runaway greenhouse event, or a very fast runaway Greenhouse Event is probably just starting, and can only be stopped by an immediate response. The danger is that it will very rapidly run out of our control. I think the net negative feedback to greenhouse gas emissions is just starting to diminish. It is not clear whether this is because the sinks are absorbing less carbon dioxide or a form of positive feedback is starting probably a bit of both.

The rising carbon dioxide levels will probably lead to rising global temperatures from about 2015 onwards which will cause more climatic disruption, especially severe droughts, and thus more carbon emissions almost certainly before 2020.

This is going to occur at a time when the Arctic Ocean will probably become free of sea ice leading to a different set of runaway events which will coalesce with the build-up of carbon dioxide in the atmosphere.

This will lead to societal collapse after rising global temperatures have caused severe droughts and a global famine at some time prior to 2040, but probably much sooner in about 2020 or in the 2020’s.

IMMEDIATE ACTION IS CRUCIAL

The absolute priority is that the world’s public and politicians are told about the rapidly increasing rate of carbon dioxide concentrations in the air which will cause a runaway Greenhouse Event, both in the media and in social media. The gravity of the situation needs to be accepted and all nations agree to co-operate to solve the problem.

There needs to be a world conference at which all nations agree the grave situation that the world is facing and that urgent and drastic action is essential. They need to accept and agree that all nations will cut greenhouse gas emissions to an accepted and equal low level of emissions per person. This will mean that only nations with very small emissions per person like the Central African Republic will not need to make any emission cuts. The rate of increase in Carbon Dioxide needs to be cut to 2 parts per million per annum by 2015 onwards. The arctic needs to be cooled so that the sea ice does not all melt before the end of the Arctic Summer.

Reducing the rate of carbon dioxide build-up in the atmosphere will be astoundingly difficult. Emissions must be cut drastically, but this will lead to a reduction of Sulphate aerosols in the atmosphere, which might cause temperatures to rise and more carbon to be emitted from biomass as droughts become more severe. The solution is to try the relatively easy route and then use geo-engineering as necessary. This involves huge societal changes, a more egalitarian society and a smaller global economy, but if it is not done almost everybody will die.

Secondly, a group of scientists needs to be formed under the authority of the United Nations to formulate geo-engineering technologies, to go together with cuts in emissions, to reduce the carbon dioxide content of the atmosphere, such as planting forests, and to cool the arctic to save the arctic sea ice.

The immediate priority is to accept the gravity of the situation and that all nations and peoples will co-operate to solve the problem.

These measures will give humanity a chance of saving civilization.