Sunday, September 22, 2024

High temperatures despite La Niña?


[ click on images to enlarge ]
Temperatures remain extremely high, even though La Niña conditions may already be present, as illustrated by the above image, showing sea surface temperature anomalies (SSTA) versus 1981-2011. 

The image on the right shows the Northern Hemisphere (-90°,90°) with SSTA as high as 24.8°F (13.8°C) in Hudson Bay (green circle) on Sep. 22, 2024. There are only very few cold spots, while massive amounts of ocean heat are present in the North Atlantic and the North Pacific. 

On September 26, 2024, the sea surface temperature (60°S-60°N, 0-360°E) was 20.97°C, a record high for the time of year and 0.83°C above the 1982-2010 average, as illustrated by the image below. 


North Atlantic (0-60°N 0-80°W) sea surface temperature anomalies remained high and reached a record high for the time of year on September 26, 2024, as illustrated by the image below (SSTA vs 1882-2011).


The image below shows that the North Atlantic sea surface reached a temperature of 24.97°C (76.95°F) on September 22, 2024, a record high for the time of year and 1.07°C (1.926°F) above 1991-2020 or 1.3°C (2.34°F) above 1981-2010. The image also shows a 0.23°C difference in anomalies when shifting the base by a decade, indicating that the anomaly would be much higher when calculated from a pre-industral base. 
 

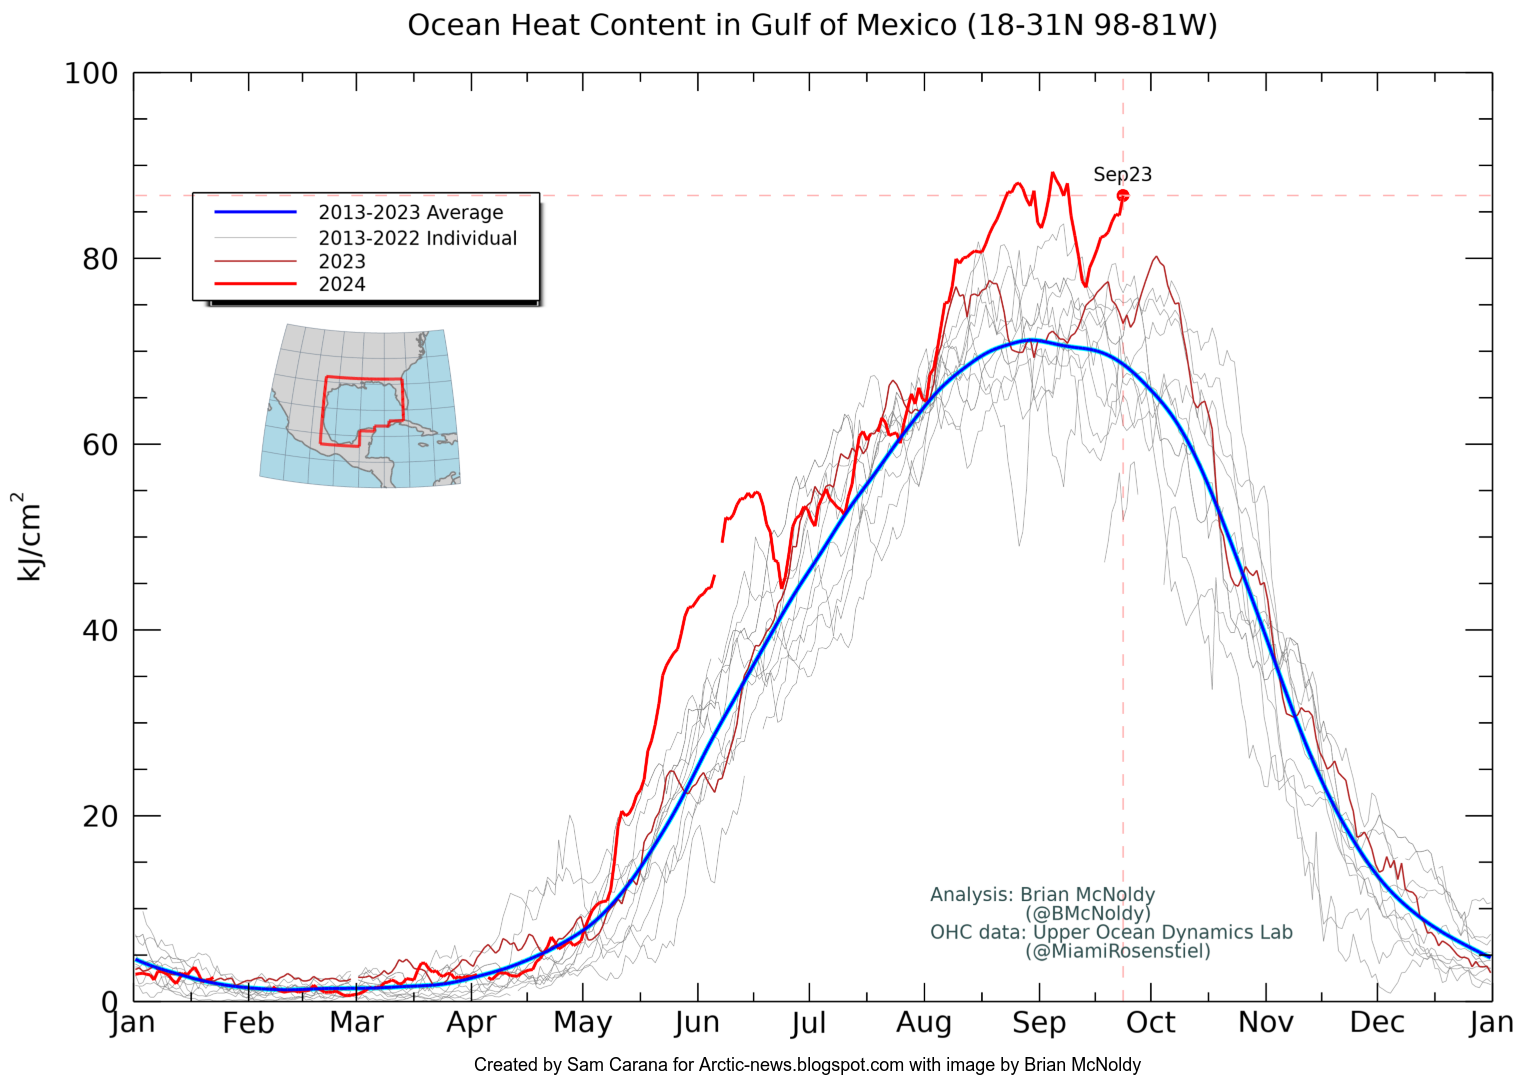
The image below, by Brian McNoldy shows that ocean heat content in the Gulf of Mexico was at a record high for the time of year on September 23, 2024. 


La Niña conditions may already be present

The black dashed line in the image below, adapted from NOAA, indicates a transition to La Niña in October 2024, persisting through Jan-Mar 2025.


The image below, adapted from NOAA, illustrates that El Niño conditions were present from June 2023 through April 2024, and that ENSO-neutral started in May 2024.


While El Niños typically occur every 3 to 5 years, as NOAA explains, El Niños can occur as frequently as every two years, as happened in 2002, 2004 and 2006, as the above image shows. Moving from the bottom of a La Niña to the peak of a strong El Niño could make a difference of more than 0.5°C.

The danger is that we could move into a new El Niño in 2025, while sunspots move toward a peak and while temperatures remain high due to Earth's high Energy Imbalance and due to feedbacks, as discussed in a recent post. The peak in sunspots in this cycle is expected to occur in July 2025, at which time Arctic sea ice may disappear, triggering further feedbacks, leading to a huge temperature rise by end 2026 that could drive humans into extinction. 


The above image from Copernicus illustrates that, for many months, the temperature anomaly has been high, i.e. about 0.8°C (± 0.3°C) above the 1991-2020 average and much more when compared to a pre-industrial base, with little or no sign of a return to earlier temperatures.


The above image illustrates that global daily mean near-surface (2m) air temperature anomalies vs 1991-2020 (Copernicus) have been above about 0.5°C for almost 16 consecutive months, i.e. since El Niño started (in June 2023, blue shade) and under ENSO-neutral conditions (starting May 2024). La Niña is expected to start October 2024 and the added trends point at a continued rise.   

The danger of methane hydrates getting destabilized

[ click on images to enlarge ]
The image on the right shows sea surface temperatures as high as 32.6°C on September 21, 2024. The image also shows the Gulf Stream pushing ocean heat toward the Arctic Ocean.

This flow of ocean heat can be accelerated by storms that are amplified due to high sea surface temperatures, deformation of the Jet Stream and a freshwater lid forming at the surface of the North Atlantic. 

At the same time, Arctic sea ice starts expanding rapidly in extent at this time of year, effectively sealing off the Arctic Ocean and making it hard for heat to get transferred from the surface of the Arctic Ocean to the atmosphere. 

As discussed in earlier posts, Arctic sea ice has become very thin, diminishing its capacity to act as a buffer that consumes ocean heat entering the Arctic Ocean from the North Atlantic. 

Sea ice constitutes a latent heat buffer, consuming incoming heat as it melts. While the ice is melting, all energy (at 334 J/g) goes into changing ice into water and the temperature remains the same. Once all ice has turned into water, all subsequent energy goes into heating up the water, and will do so at 4.18 J/g for every 1°C the temperature of the water rises.

Ocean heat that was previously consumed by melting the sea ice, can no longer get consumed by melting of the sea ice once Arctic sea ice has become very thin, and further incoming heat instead gets absorbed by the Arctic Ocean, rapidly pushing up the temperature of the water of the Arctic Ocean.

The danger is that, as the water of the Arctic Ocean keeps heating up, more heat will reach the seafloor and destabilize methane hydrates contained in sediments at the seafloor, resulting in eruptions of huge amounts of methane. 

The image below illustrates how incoming ocean heat that previously was consumed in the process of melting of the sea ice, is now causing the water of the Arctic Ocean to heat up, with more heat reaching the seafloor of the Arctic Ocean, which has seas that in many places are very shallow.
[ Latent heat loss, feedback #14 on the Feedbacks page ]

Eruptions from hydrates occur at great force, since the methane expands 160 times in volume when it vaporizes, resulting in the methane rapidly rising in the form of plumes, leaving little or no opportunity for microbes to decompose the methane in the water column, which especially applies to the many areas where the Arctic Ocean is very shallow. Furthermore, the atmosphere over the Arctic contains very little hydroxyl, resulting in methane persisting in the air over the Arctic much longer than elsewhere.

Climate Emergency Declaration

The situation is dire and the precautionary principle calls for rapid, comprehensive and effective action to reduce the damage and to improve the situation, as described in this 2022 post, where needed in combination with a Climate Emergency Declaration, as discussed at this group.


Links

• Nullschool
https://earth.nullschool.net

• Climate Reanalyzer
https://climatereanalyzer.org

• Ocean Heat Content - by Brian McNoldy
https://bmcnoldy.earth.miami.edu/tropics/ohc

• NOAA - Climate Prediction Center - ENSO: Recent Evolution, Current Status and Predictions
https://www.cpc.ncep.noaa.gov/products/analysis_monitoring/lanina/enso_evolution-status-fcsts-web.pdf


Saturday, September 21, 2024

AI-controlled apes with apps at seconds to Midnight

by Andrew Glikson


What further evidence do the inhabitants of planet Earth need to have to convince them the liveable climate, the lungs of the Earth, is sharply deteriorating, species are dying, the mere failure of a computer chip or of a human neuron are capable of terminating civilization, that the powers that be are leading to one of the greatest mass extinction in the history of the Earth and that mass migration to Mars is a cynical myth. At the death of détente the powers that be, aimed toward World War III, do not appear to be concerned with the consequences of extreme global warming, clear evidence for their lack of concern for life on Earth.

[ Guernica, mural by Pablo Picasso, from Wikipedia ]

On Monday 26 April 1937, the Basque town of Guernica was bombed by Nazi Germany and Fascist Italy at the request of the Spanish Nationalists under the command of General Francisco Franco during the Spanish Civil War. No painting other than Pablo Picasso’s Guernica more strikingly depicts the massacre of the oncoming fascism – the human death cult reaching a peak in World War II and re-emerging toward World War III, as nuclear fleets and climate extremes aim at life on Earth, as Governments and snake-oil merchants spend $trillions threatening to radioactivate the atmosphere, reinventing the killing fields under false-flags as Goebbels-like agents with blood on their hands deceive the multitude to the tune of canned laughter, women carry dead children, multi-billionaires plan future space shots out of the mouths of the hungry, Olympic cyclists write themselves into history and only the young rebel against the global insanity.


Cycles of death, repeated almost every generation, follow breakups in the international order, women die alongside their men as in the Spanish Civil war, or are left to rebuild their shattered homes.

Over the past few decades the probability of a nuclear war has grown to some 12,121 hair-triggered weapons aimed at all life, that the criminal powers refuse to dismantle, propagating hollow Orwellian speak on the airwaves. But while it is common for the misguided to attribute atrocities to so called “leaders”, including in parliaments, which the people initially elected under false pretences.

The consequences range from fatal imperial wars to global climate calamities. According to Jeffrey D. Sachs (July 16, 2024): “The quest for hegemony has pushed the world to open warfare between the world’s two leading nuclear powers”.

As conveyed by Thucydides Trap, the rise of empires constitutes a major driver of international conflict, from the Persian superpower to the Roman empire. In the modern era, détente could hardly survive while submarine and space weapon systems proliferate and adversaries seek “victory” at the price of millions of lives in World wars. There is no evidence current promoters of the looming nuclear war can be brought to trial in a future round of Nuremberg trials.

Fascism, coined after the Roman fascia, tantamount to military barbarism, represents the hallmark of tribal killing through history, as contrasted with a small percent of peaceful nomadic tribes. The ratio of male deaths in modern wars is far less.

The ultimate control of a future global biosphere by AI-weapon systems can only subject civilization and the living biosphere to an intelligence-free world, hard to conceive less brutal than World wars I, II or the looming World War III.

But blame cannot be exclusively attributed to “leaders”, so-called, who once elected into positions of “power” need to conform to those in control of industry and society. Opinion makers manufacture consent. The mega-rich, tycoons, corporate directors, shareholders and managers of the “fourth estate” paint black as white propagating major untruths, for example making it look as if carbon exports can be distinguished from domestic greenhouse emissions in terms of their effects on the atmosphere.

While responsibility belongs to all of humanity, it is the relatively affluent “first world” governments which generate the oncoming collapse (Jared Diamond, 2005).


A/Prof. Andrew Y Glikson
Earth and climate scientist

Andrew Glikson
Books:
The Asteroid Impact Connection of Planetary Evolution
https://www.springer.com/gp/book/9789400763272
The Archaean: Geological and Geochemical Windows into the Early Earth
https://www.springer.com/gp/book/9783319079073
The Plutocene: Blueprints for a Post-Anthropocene Greenhouse Earth
https://www.springer.com/gp/book/9783319572369
The Event Horizon: Homo Prometheus and the Climate Catastrophe
https://www.springer.com/gp/book/9783030547332
Climate, Fire and Human Evolution: The Deep Time Dimensions of the Anthropocene
https://www.springer.com/gp/book/9783319225111
Evolution of the Atmosphere, Fire and the Anthropocene Climate Event Horizon
https://www.springer.com/gp/book/9789400773318
From Stars to Brains: Milestones in the Planetary Evolution of Life and Intelligence
https://www.springer.com/us/book/9783030106027
Asteroids Impacts, Crustal Evolution and Related Mineral Systems with Special Reference to Australia
https://www.springer.com/us/book/9783319745442
The Fatal Species: From Warlike Primates to Planetary Mass Extinction
https://www.springer.com/gp/book/9783030754679
The Trials of Gaia. Milestones in the evolution of Earth with reference to the Antropocene
https://www.amazon.com.au/Trials-Gaia-Milestones-Evolution-Anthropocene/dp/3031237080


Wednesday, September 11, 2024

Will we be alive in 2025, who will survive, 2025?


The above image, created with monthly mean global temperature anomalies by LOTI Land+Ocean NASA/GISS/GISTEMP v4 data while using a 1903-1924 base, has a trend added based on Jan 2016-Aug 2024 data. The image also shows that anomalies could be 0.99°C higher when using a more genuine pre-industrial base.

The image below featured in an earlier post and was created with an image from the NASA website while using an 1885-1915 base, illustrating the calculation behind this 0.99°C. More details are here.


The image below from Copernicus illustrates that, for more than 14 consecutive months, the temperature anomaly has been high, i.e. about 0.8°C (± 0.3°C) above the 1991-2020 average and much more when compared to a pre-industrial base, with little or no sign of a return to earlier temperatures.


The image below, from an earlier post and created with an image from the NASA website while using a 1903-1924 base, confirms that the monthly temperature anomaly through August 2024 has been more than 1.5°C above this base for each of the past consecutive 14 months. The post adds that anomalies will be even higher when compared to a pre-industrial base. The red line shows a trend produced by the NASA website (2-year Lowess Smoothing).


Potential causes for such a rapid temperature rise include a cataclysmic alignment of the temperature peak of the next El Niño coinciding with a peak in sunspots expected to occur in July 2025.

The black dashed line in the image below, adapted from NOAA, indicates a transition to La Niña in October 2024, persisting through Jan-Mar 2025.


The image below, adapted from NOAA, illustrates that El Niño conditions were present from June 2023 through April 2024, and that ENSO-neutral started in May 2024.


While El Niños typically occur every 3 to 5 years, as NOAA explains, El Niños can occur as frequently as every two years, as happened in 2002, 2004 and 2006, as the above image shows. Moving from the bottom of a La Niña to the peak of a strong El Niño could make a difference of more than 0.5°C.

The danger is that we could move into a new El Niño in 2025, while temperatures remain high due to feedbacks and while sunspots move toward a peak in this cycle, expected to occur in July 2025.

The image below (top part), adapted from NOAA, shows the observed values for the number of sunspots for cycle 25, through August 2024, as well as the values predicted by NOAA (red line).

[ from earlier post, click on images to enlarge ]

The above image (bottom part) shows the observed values for the F10.7cm radio flux for cycle 25, through August 2024, as well as the values predicted by NOAA (red line).

The observed values are much higher than predicted. If this trend continues, the rise in sunspots forcing from early 2020 to July 2025 may well make a difference of more than 0.25°C.

This - in combination with further events, developments and short-term variables - could constitute a cataclysmic alignment that could result in runaway temperature rise by 2026, as an earlier post concluded.

Natural variability is mentioned by the IPCC, but because such events vary from year to year, their impact is smoothed out in climate change calculations that average the temperature rise over the course of decades. Yet, when such events coincide in a cataclysmic alignment, as could be the case within the next few years, the extra rise in temperature from - say - the year 2021 could be over 0.75°C. Note that this is an extra rise, on top of the long-term rise due to activities by people since pre-industrial.

Furthermore, as emissions and temperatures keep rising, such an extra rise could trigger feedbacks that threaten to grow in strength and strike with ever greater ferocity, further accelerating the temperature rise while extreme weather disasters hit numerous regions around the world more frequently over larger areas, with greater intensity and for longer periods.


Such feedbacks include loss of sea ice and permafrost degradation, both terrestrial and on the seafloor of the Arctic Ocean, which looks set to cause huge releases of greenhouse gases. Temperature anomalies are high and Arctic sea ice volume is very low, as illustrated by the compilation of images below, adapted from nullschool, Climate Reanalyzer and the Danish Meteorological Institute.  


Ominously, high methane concentrations (well over 2400 ppb) were recently recorded at the observatory in Utqiagvik (Barrow), Alaska, as illustrated by the image below, adapted from NOAA


Slowing down of ocean currents could cause less heat to move deep into the ocean and more heat to instead accumulate at the surface, while more water vapor would enter the atmosphere, further speeding up the temperature rise, as discussed in earlier posts such as this one and as illustrated by the image below, created with NOAA data.
[ surface precipitable water through August 2024 ]
The compilation image below, with forecasts for September 20, 2024 03 UTC (run 00 UTC) adapted from Copernicus, illustrates gases and biomass-burning aerosols released due to forest fires burning in the Amazon. Formaldehyde and carbon monoxide cause hydroxyl depletion and thus extend methane's lifetime. 


Conflict and socio-economic stress could add further forcing. Heatwaves, fires, famine, drought, floods, crop loss, loss of habitable land and corrupt politicians threaten to cause violent conflicts to erupt around the world, industrial activity to grind to a halt and the temperature to rise above 3°C from pre-industrial, driving humans into extinction. Sadly, politicians and mainstream media fail to inform people about the danger, and once the full horror reveals itself, panic could be added to the problems the world faces.

Dangers associated with high temperatures are discussed in this earlier post. A 2018 study (by Strona & Bradshaw) indicates that most life on Earth will disappear with a 5°C rise. Humans, who depend for their survival on many other species, will likely go extinct with a 3°C rise, as illustrated by the image below, from an earlier post.


Climate Emergency Declaration

The situation is dire and the precautionary principle calls for rapid, comprehensive and effective action to reduce the damage and to improve the situation, as described in this 2022 post, where needed in combination with a Climate Emergency Declaration, as discussed at this group.


Links

• NASA - Gistemp
https://data.giss.nasa.gov/gistemp

• Pre-industrial
https://arctic-news.blogspot.com/p/pre-industrial.html

• Did the climate experience a Regime Change in 2023? 

• Water Vapor Feedback
https://arctic-news.blogspot.com/2024/09/water-vapor-feedback.html

• NOAA - Monthly Temperature Anomalies Versus El Niño
https://www.ncei.noaa.gov/access/monitoring/monthly-report/global/202408/supplemental/page-4

• NOAA - El Niño and La Niña 

• Sunspots
https://arctic-news.blogspot.com/p/sunspots.html

• Cataclysmic Alignment threatens Climate Catastrophe 


Wednesday, September 4, 2024

Water Vapor Feedback


Earth's Energy Imbalance is now about four times as high as it was a decade ago, as illustrated by the above image, by Eliot Jacobson. As a result, feedbacks are starting to kick in with greater ferocity.

Water vapor feedback

One such feedback is the water vapor feedback. The temperature rise results in more evaporation, i.e. more water vapor and heat will enter the atmosphere, much of which will return to the surface in the form of precipitation, but some will remain in the atmosphere, as there will be 7% more water vapor for every 1°C warming. As illustrated by the image below, created with NOAA data, surface precipitable water was 27.181 kg/m² in August 2024, a record high for this month.

[ surface precipitable water through August 2024 ]

How much more water vapor currently is in the atmosphere compared to pre-industrial depends on how much the temperature has risen since pre-industrial. The February 2024 temperature was 1.76°C above 1885-1915, which could be as much as 2.75°C above the pre-industrial temperature. A 2.75°C rise corresponds with almost ⅕ more water vapor in the atmosphere.

More ocean heat and water vapor moving to Arctic

The temperature rise also comes with stronger wind. An earlier post points at a study that found increased kinetic energy in about 76% of the upper 2,000 meters of global oceans, as a result of intensification of surface winds since the 1990s.

Stronger wind speeds up ocean currents, enabling more ocean heat to move to the Arctic, while stronger wind also enables more water vapor to move to the Arctic and more rain to fall closer to the Arctic, along the path of prevailing ocean currents and wind patterns. As a result, both heat and water vapor will increase in the Arctic. 

This will in turn further increase the temperature rise in the Arctic, since water vapor is a potent greenhouse gas, while more water vapor also results in less hydroxyl, thus extending methane's lifetime.

The resulting temperature rise in the Arctic also reduces the snow and ice cover, further amplifying the temperature rise in the Arctic, while the temperature rise and the presence of more open water will also enable more evaporation, resulting in more water vapor in the atmosphere over the Arctic. 

High levels of methane are already present over the Arctic and the water vapor feedback makes things worse. Additionally, more ocean heat entering the Arctic Ocean threatens to further destabilize sediments at the seafloor that contain methane hydrates and cause even more methane to erupt, resulting in huge amounts of methane entering the atmosphere over the Arctic, from the hydrates and also from free gas underneath the hydrates.

[ click on images to enlarge ]
More water vapor and rainfall combined with higher temperatures will also cause more methane releases from lakes, wetlands and permafrost on land in the northern parts of Canada, Europe and Siberia. 

The image on the right shows a forecast by Climate Reanalyzer of high temperature anomalies in the northern parts of Europe on September 7, 2024. 

The image below shows high methane levels forecast by Copernicus at surface level in northern Europe on September 7, 2024, 03 UTC (run 00 UTC). 


As the image below shows, methane concentrations as high as 2400 parts per billion (ppb) were recently recorded at the NOAA observatory in Utqiagvik (Barrow), Alaska.


As Earth's Energy Imbalance keeps rising, an increasing amount of heat accumulates in oceans. The image below, adapted from NOAA, illustrates the huge amount of heat present in the ocean around North America, with sea surface temperatures as high as 33.6°C (92.48°F) recorded on September 6, 2024. The image also shows the Gulf Stream (middle right), the Atlantic ocean current that carries heat from the Gulf of Mexico to the Arctic Ocean. 


The image below, by Brian McNoldy shows that ocean heat content in the Gulf of Mexico was at record high on September 4, 2024.


The temperature rise is hitting the Arctic hard, as illustrated by the image below, created with NASA content.


The temperature rise in the air is most profound at both poles, a phenomenon known as polar amplification, as illustrated by the temperature anomaly map for August 2024 below. 


[ from earlier post ]
Oceans are still absorbing an estimated 91% of the excess heat energy trapped in the Earth's climate system due to human-caused global warming. If just a small part of that heat instead remains in the atmosphere, this could constitute a huge rise in temperature. Heat already stored in the deeper layers of the ocean will eventually be released, committing Earth to at least some additional surface warming in the future.

Polar amplification of the temperature rise causes a relative slowing down of the speed at which heat flows from the Equator to the poles. This impacts ocean currents and wind patterns, resulting in slowing down of the Atlantic meridional overturning circulation (AMOC) and of ocean currents around Antarctica that carry heat to the deep ocean, as well as in deformation of the Jet Stream. 

recent study warns about intensification of global warming due to the slowdown of the overturning circulation. The overturning circulation carries carbon dioxide and heat to the deep ocean, where it is stored and hidden from the atmosphere. As the ocean storage capacity is reduced, more carbon dioxide and heat are left in the atmosphere. This feedback accelerates global warming.
[ from earlier post ]
Warmer oceans also result in stronger stratification, which further contributes to make it harder for heat to reach the deeper parts of oceans. As a result, a larger proportion of heat that was previously entering oceans will instead remain in the atmosphere or accumulate at the ocean surface, and slowing down of the overturning circulation further contributes to this, as discussed above. 

At the same time, overall global wind strength increases as temperatures rise, and as the Jet Stream gets more deformed, this can at times strongly boost the flow of wind and water along prevailing ocean currents, wind patterns and storm tracks that carry heat toward the Poles. Furthermore, polar amplification of the temperature rise results in a relatively stronger rise in water vapor in the air over Antarctica and the Arctic. 


At times, part of this accumulated energy can, in the form of ocean heat and precipitable water, be abruptly transported to the Arctic, along the path of prevailing ocean currents and wind patterns boosted by stronger wind and storms. This is illustrated by the above image that shows unusually high amounts of precipitable water recorded near the North Pole on September 1, 2024, at 04 UTC (20 kg/m² at the green circle). This can be further facilitated by the formation of a freshwater lid at the surface of the North Atlantic that enables more ocean heat to travel underneath this lid to the Arctic Ocean. 


Temperatures remain high

Temperatures remain high, even while a transition to La Niña is expected by Sep-Nov 2024, persisting through Jan-Mar 2025, as illustrated by the image below, adapted from NOAA.


The image below, from an earlier post and adapted from NOAA, illustrates that El Niño conditions were present from June 2023 through April 2024, and that ENSO-neutral started in May 2024. While El Niños typically occur every 3 to 5 years, as NOAA explains, El Niños can occur as frequently as every two years, as happened in 2002, 2004 and 2006, and as illustrated by the image below. The danger is that we could move into a new El Niño in 2025, while temperatures remain high due to feedbacks and while sunspots move toward a peak in this cycle, expected to occur in July 2025.


The image below illustrates that, for 14 consecutive months, the temperature anomaly has exceeded 1.2°C above 1951-1980 or (more aptly) 2°C above pre-industrial, and is rising again, even while El Niño ended April 2024.


Similarly, the image below illustrates that, for more than 14 consecutive months, the temperature anomaly has been high, i.e. about 0.8°C (± 0.3°C) above the 1991-2020 average and much more when compared to a pre-industrial base, with little or no sign of a return to earlier temperatures. On September 2, 2024, the temperature was 0.8°C above 1991-2020, the highest anomaly on record for that day of the year.

[ click on images to enlarge ]

The image below, created with NASA data while using a 1903-1924 custom base, illustrates that the monthly temperature anomaly through August 2024 has been more than 1.5°C above this base for each of the past consecutive 14 months, and even more when compared to a pre-industrial base. The red line shows the trend (2-year Lowess Smoothing) associated with the rapid recent rise.


A huge temperature rise could unfold by 2026, as the joint result of changes in the atmosphere, changes in surface and cloud albedo, changes in wind patterns & ocean currents, and further developments, e.g. in a cataclysmic alignment, a strong El Niño could develop in 2025 which, in combination with higher than expected sunspots, could make a difference of 0.75°C. Sunspots are expected to reach a peak in the current cycle in July 2025. 

Sea ice disappearing fast

Sea ice is disappearing over large parts of the Arctic Ocean, including near the North Pole. 


The above compilation image shows, on the left, that Arctic sea ice volume was at a record low for the time of year on September 5, 2024, as it has been for most of the year. On the right, an image by the University of Bremen showing sea ice concentration on September 5, 2024.


In the above compilation image, the NASA Worldview image on the left shows Arctic sea ice on September 10, 2024.

The Danish Meteorological Institute (DMI) image at the top right is from an earlier date, not yet showing the 2024 minimum, yet it does show that the minimum volume in earlier years was not as far below 5000 km³ as it was in 2024. The 2024 minimum is depicted on the DMI image on the bottom right, showing that Arctic sea ice volume was well below 5000 km³ on September 10, 2024.


In the above image the two DMI images overlap, highlighting that Arctic sea ice volume did reach a record low in 2024. 


Global sea ice extent was 21.04 million km² on September 4, 2024, a record low for the time of year, as feedbacks start kicking in with greater ferocity, including less albedo, latent heat buffer and emissivity, more water vapor, less lower clouds, Jet Stream changes, more emissions, lightning and forest fires, stronger rainfall and heatwaves causing more run-off of heat, and stronger storms that can push ocean heat toward the poles, all contributing to accelerate sea ice loss and the temperature rise, as discussed in earlier posts such as this one

[ for more background, also view the Extinction page ]
A huge temperature rise could occur soon

As a result, several tipping points threaten to be crossed in the Arctic soon, as described in an earlier post, including the latent heat tipping point and a Blue Ocean Event (starting when Arctic sea ice extent will fall below 1 million km²), which would further speed up the temperature rise in the Arctic.

As temperatures keep rising in the Arctic, changes to the Jet Stream look set to intensify, resulting in loss of terrestrial albedo in the Arctic that could equal the albedo loss resulting from sea ice decline.

Further feedbacks include permafrost degradation, both terrestrial and on the seafloor of the Arctic Ocean, which looks set to cause huge releases of greenhouse gases (particularly CO₂, CH₄ and N₂O).

This would in turn also cause more water vapor to enter the atmosphere, further speeding up the temperature rise, especially in the Arctic, where vast amounts of methane are contained in sediments at the seafloor and where there is very little hydroxyl in the air to break down the methane.

Temperatures look set to rise further in the Arctic, due to falling away of sulfate aerosols, as illustrated by the IPCC image below that shows how much temperatures are currently suppressed in the Arctic due to aerosols and thus also shows how much temperatures in the Arctic look set to rise as the aerosol masking effect falls away.


Furthermore, the combined impact of aerosols and nitrogen fertilizers has been underestimated; a recent study concludes that when ammonia, nitric acid and sulfuric acid are present together, they contribute strongly to the formation of cirrus clouds.

At the same time, there could be a temperature rise due to releases of other aerosols that have a net warming impact, such as black and brown carbon, which can increase dramatically as more wood burning, forest fires and urban fires take place, which again would hit the Arctic hard by darkening the surface as they settle on the snow and ice cover, thus speeding up its decline.

The image below, with forecasts for September 9, 2024 03 UTC (run 00 UTC) adapted from Copernicus, illustrates gases and aerosols released due to forest fires burning in the Amazon.


The joint impact could cause the clouds tipping point to get crossed, adding an abrupt further 8°C to the rise, and altogether, a global temperature rise could unfold of more than 18°C above pre-industrial, as illustrated by the image further above on the right, and as also discussed at Extinction. This could in turn cause the water vapor tipping point to get crossed, which means that from then on the increase in water vapor alone would suffice to keep increasing the temperature, in a runaway greenhouse process in which evaporation could cause a global surface temperature rise of several hundred degrees Celsius and make our planet as inhospitable as Venus, as this study concludes and as discussed at this post.

[ click on images to enlarge ]
A 2020 study led by Jorgen Randers concludes that the world is already past a point-of-no-return for global warming, as self-sustained thawing of the permafrost will continue for hundreds of years, even if global society did stop all emissions of man-made greenhouse gases immediately, due to a combination of declining surface albedo (driven by decline of the Arctic snow and ice cover), increasing amounts of water vapor in the atmosphere (driven by higher temperatures), and changes in concentrations of further greenhouse gases in the atmosphere (driven by changes in sinks and sources of carbon dioxide and methane such as thawing permafrost), as illustrated by the image on the right, from an earlier post.

Climate Emergency Declaration

The situation is dire and the precautionary principle calls for rapid, comprehensive and effective action to reduce the damage and to improve the situation, as described in this 2022 post, where needed in combination with a Climate Emergency Declaration, as discussed at this group.


Links

• Earth Energy Imbalance - by Eliot Jacobson

• NOAA - Physical Sciences Laboratory
https://psl.noaa.gov

• NOAA - Global Monitoring Laboratory - Carbon Cycle Gases
https://gml.noaa.gov/dv/iadv/graph.php?code=BRW&program=ccgg&type=ts

• Cataclysmic Alignment threatens Climate Catastrophe
• Sunspots
https://arctic-news.blogspot.com/p/sunspots.html

• Pre-industrial
https://arctic-news.blogspot.com/p/pre-industrial.html

• Ocean Heat Content - by Brian McNoldy
https://bmcnoldy.earth.miami.edu/tropics/ohc

• Recent reduced abyssal overturning and ventilation in the Australian Antarctic Basin - by Kathryn Gunn et al. 
https://www.nature.com/articles/s41558-023-01667-8
Discussed on facebook at: 

• Copernicus - Atmosphere

• NASA - Gistemp

• NASA - Worldview

• Danish Meteorological Institute - Arctic sea ice volume and thickness
https://ocean.dmi.dk/arctic/icethickness/thk.uk.php

• University of Bremen - Arctic sea ice
https://seaice.uni-bremen.de/start

• Arctic Data archive System - National Institute of Polar Research - Japan
https://ads.nipr.ac.jp/vishop

• Will temperatures keep rising fast?
https://arctic-news.blogspot.com/2023/12/will-temperatures-keep-rising-fast.html

• Feedbacks
https://arctic-news.blogspot.com/p/feedbacks.html

• Jet Stream
https://arctic-news.blogspot.com/p/jet-stream.html

• The Clouds Feedback and the Clouds Tipping Point
https://arctic-news.blogspot.com/p/clouds-feedback.html

• Cold freshwater lid on North Atlantic
https://arctic-news.blogspot.com/p/cold-freshwater-lid-on-north-atlantic.html

• Resetting tropospheric OH and CH4 lifetime with ultraviolet H2O absorption - by Michael Prather et al. 
https://www.science.org/doi/abs/10.1126/science.adn0415
Discussed on facebook at: 
https://www.facebook.com/groups/arcticnews/posts/10161571351924679

• Transforming Society
https://arctic-news.blogspot.com/2022/10/transforming-society.html

• Climate Plan
https://arctic-news.blogspot.com/p/climateplan.html

• Climate Emergency Declaration
https://arctic-news.blogspot.com/p/climate-emergency-declaration.html