Sunday, January 29, 2023

The global climate change suicide pact

 by Andrew Glikson

Despite of deceptively-claimed mitigation of greenhouse gas (GHG) emissions in parts of the world, ongoing burning of domestic and exported fossil fuels world-wide continues to change the composition of the atmosphere, enriching it in greenhouse gases by yet another ~2 ppm CO₂ (2022: 418.95 ppm; CH₄: 1915 ppb; N₂0: 337 ppb), reaching levels commensurate with those of the Miocene (23.03 to 5.333 Ma) at rise rates exceeding any in the geological record of the last 66 million years (Glikson, 2020) (Figure 1). 

Figure 1. Global 1880-2021 annual average temperatures (adapted by UCAR from ClimateCentral).

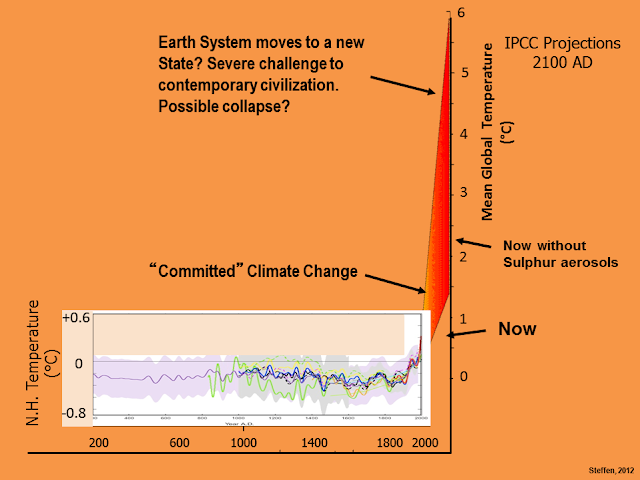
Since 1880 mean global temperatures rose at a rate of 0.08°C per decade, from 1981 by 0.18°C per decade and more when emitted aerosols are accounted for (Hansen et al., in Berwyn, 2022). According to Will Steffen, Australia’s leading climate scientist “there was already a chance we have triggered a global tipping cascade that would take us to a less habitable Hothouse Earth climate, regardless of whether we reduced emissions” (Figure 2).

Figure 2. Global mean temperature profile since 200 AD projected to beyond 2000 AD (Will Steffen)

Over a brief span of less than two centuries (Figure 1) anthropogenic reversal of the carbon cycle induced the emission of some 1.5 10¹² tonnes of CO₂ and an increased release of 150% more CH₄ from the crust, accumulated in sediments for hundreds of million years through photosynthesis and calcification, as well as from permafrost and oceans. Permeation of the atmosphere and the hydrosphere with the toxic residues of ancient plants and organisms, poisoning the biosphere, is leading to the Sixth mass extinction of species in the history of nature.

Following failed attempts to deny climate science, vested business and political interests are proceeding, with the support of many governments, to mine coal, sink oil wells and frack hydrocarbon gas, regardless of the consequences in term of global heating, sea level rise, inundation of islands and coastal zones, collapse of the permafrost, heat waves, floods, ocean acidification, migration of climate zones and dissemination of plastic particles, rendering the future of much of the biosphere uninhabitable.
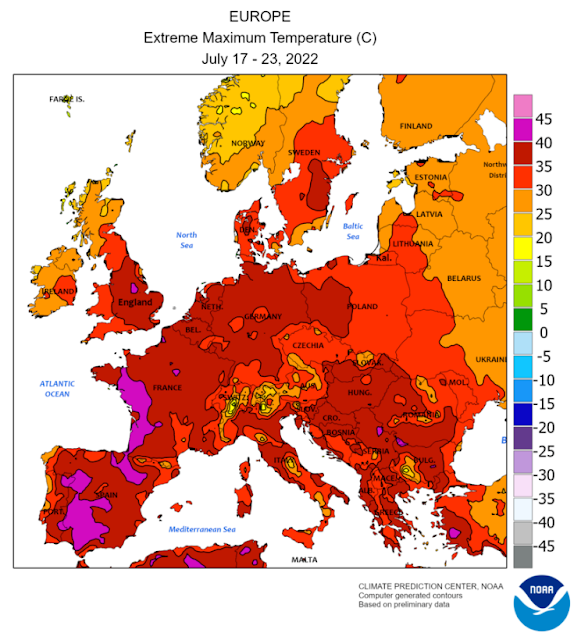
Figure 3. Europe: Maximum extreme temperatures, July 17-23, 2002.

The progression of global warming is unlikely to be linear as the flow of cold ice melt water from Greenland and Antarctica glaciers would cool parts of the ocean and in part the continents (Figure 4), leading toward a stadial-type phenomenon, the classic case of which is symbolized by the Younger dryas cool period 12,900 to 11,700 years ago.

Figure 4. Projected transient stadial cooling events (Hansen et al., 2016)

National and international legal systems appear unable to restrict the saturation of the atmosphere with greenhouse gases, as governments preside over the worst calamity in natural history since the demise of the dinosaurs. Facing heatwaves (Figure 3), fires, floods and sea level rise, those responsible may in part remain oblivious to the magnitude of the consequences, waking up when it is too late.

There was a time when leaders fell on their sword when defeated in battle or lose their core beliefs, nowadays most not even resign their privileged positions to resist the existential danger posed to advanced life, including human civilization, preoccupied as nations are with preparations for nuclear wars.

It is long past time to declare a global climate and nuclear emergency.


Andrew Glikson
A/Prof. Andrew Glikson

Earth and Paleo-climate scientist
School of Biological, Earth and Environmental Sciences
The University of New South Wales,
Kensington NSW 2052 Australia

Books:
The Asteroid Impact Connection of Planetary Evolution
https://www.springer.com/gp/book/9789400763272
The Archaean: Geological and Geochemical Windows into the Early Earth
https://www.springer.com/gp/book/9783319079073
Climate, Fire and Human Evolution: The Deep Time Dimensions of the Anthropocene
https://www.springer.com/gp/book/9783319225111
The Plutocene: Blueprints for a Post-Anthropocene Greenhouse Earth
https://www.springer.com/gp/book/9783319572369
Evolution of the Atmosphere, Fire and the Anthropocene Climate Event Horizon
https://www.springer.com/gp/book/9789400773318
From Stars to Brains: Milestones in the Planetary Evolution of Life and Intelligence
https://www.springer.com/us/book/9783030106027
Asteroids Impacts, Crustal Evolution and Related Mineral Systems with Special Reference to Australia
https://www.springer.com/us/book/9783319745442
The Event Horizon: Homo Prometheus and the Climate Catastrophe
https://www.springer.com/gp/book/9783030547332
The Fatal Species: From Warlike Primates to Planetary Mass Extinction
https://www.springer.com/gp/book/9783030754679


Tuesday, January 3, 2023

A huge temperature rise threatens to unfold soon

A huge temperature rise threatens to unfold, as the already dire situation threatens to turn catastrophic due to the combined impact of a number of developments and feedbacks. 

The image below uses ERA5 data, with two trends added. The blue trend, based on 1940-2022 data, points at 3°C rise by 2044. The purple trend, based on 2008-2022 data, better reflects variables such as El Niño and sunspots, and shows that this could trigger a rise of as much as 3°C by 2025, as further discussed below. Note that anomalies are from 1850-1900, which isn't pre-industrial.


The upcoming El Niño

Temperatures are currently suppressed as we're in the depth of a persistent La Niña event. It is rare for a La Niña event to last as long as the current one does, as illustrated by the NASA image below and discussed in this NASA post. The blue line added in the image highlights an increase in peak ONI (strong El Niños) over the years. 


The above image was created using data up to September 2022. La Niña has since continued, as illustrated by the NOAA image on the right. NOAA adds that the dashed black line indicates that La Niña is expected to transition to ENSO-neutral during January-March 2023.

Chances are that we'll move into the next El Niño in the course of 2023. Moving from the bottom of a La Niña to the peak of a strong El Niño could make a difference of more than half a degree Celsius, as illustrated by the image below.

[ image adapted from NOAA ]
Joint impact of El Niño, sunspots and the volcano eruption near Tonga 

[ click on image to enlarge ]
An analysis in an earlier post warns that the rise in sunspots from May 2020 to July 2025 could make quite a difference, as the upcoming El Niño looks set to coincide with a high number of sunspots.

The current cycle of sunspots is forecast to reach a maximum in July 2025. Recent observations are higher than expected, as illustrated by the images on the right, adapted from NOAA, confirming a study mentioned in the earlier post that warns that the peak of this cycle could rival the top few since records began, which would further increase the difference.

Observed values for December 2022 are already very close to or above the maximum values that NOAA predicts will be reached in July 2025. If this trend continues, the rise in sunspots forcing from May 2020 to July 2025 may well make a difference of more than 0.25°C, a recent analysis found. 

A 2023 study calculates that the submarine volcano eruption near Tonga in January 2022, as also discussed at facebook, will have a warming effect of 0.12 Watts/m² over the next few years.

The joint impact of a strong El Niño, high sunspots and the volcano eruption near Tonga could make a difference of more than 0.87°C. This rise could trigger further developments and feedbacks that altogether could cause a temperature rise from pre-industrial of as much as 18.44°C by 2026, as illustrated by the image at the top and as discussed below.

As illustrated by the image below,  temperature anomalies on land can be very high, especially during El Niño events. In February 2016, during a strong El Niño, the land-only monthly anomaly from 1880-1920 was 2.95°C. Note that anomalies are from 1880-1920, which isn't pre-industrial.


Further developments and feedbacks 

A combination of further developments and feedbacks could cause a huge temperature rise. An example of this is the decline of the cryosphere, i.e. the global snow and ice cover.

Antarctic sea ice extent is currently at a record low for the time of year (see image on the right, adapted from NSIDC). 

Antarctic sea ice extent reached a record low on February 25, 2022, and Antarctic sea ice extent looks set to get even lower this year. The dangerous situation in Antarctica is discussed in more detail in a recent post

The currently very rapid decline in sea ice concentration around Antarctica is also illustrated by the animation of Climate Reanalyzer images on the right, showing Antarctic sea ice on November 16, November 29, December 15, 2022 and January 4, 2023.

Studies in Alaska and Greenland have found that submarine and ambient melting is substantially higher than previously thought.

Global sea ice extent is also at a record low for the time of year, as illustrated by the image below that shows that global sea ice extent was 16.67 million km² on January 5, 2023.


[ click on images to enlarge ]
As illustrated by the image on the right, adapted from NSIDC, Arctic sea ice extent was second lowest for the time of year on January 6, 2023.

Loss of sea ice results in loss of albedo and loss of the latent heat buffer that - when present - consumes ocean heat as the sea ice melts. These combined losses could result in a large additional temperature rise, while there are further contributors to the temperature rise, such as thawing of terrestrial permafrost and associated changes such as deformation of the Jet Stream, additional ocean heat moving into the Arctic from the Atlantic Ocean and the Pacific Ocean, and methane eruptions from the seafloor of the Arctic Ocean.

A 2019 analysis concludes that the latent heat tipping point gets crossed when the sea surface temperature anomaly on the Northern Hemisphere gets higher than 1°C above 20th century's temperature and when there is little or no thick sea ice left. 

The latent heat tipping point in the Arctic was crossed in 2020, while ocean heat has kept rising since, despite La Niña conditions, as illustrated by the images above and below. 


Temperature anomalies were high over the Arctic Ocean in December 2022, as illustrated by the image below. 


Ominously, methane levels are very high over the Arctic, as illustrated by the Copernicus image below and as discussed in section 16 of the methane page and at the Climate Alert group


The image below shows methane recorded by the N20 satellite on January 18, 2023, pm at 487.2 mb reaching a peak of 2624 ppb. 


The animation below is made with images recorded by the Metop-B satellite on Jan.6, 2023 PM, showing methane at the highest end of the scale (magenta color) first (at low altitude) becoming visible predominantly over oceans and at higher latitudes North, and then gradually becoming also visible more spread out over the globe at higher altitude, while reaching its highest mean (of 1925 ppb) and peak (of 2708 ppb) at 399 mb. 


This indicates that methane is rising up from the Arctic Ocean, as also discussed at the methane page and at this post at facebook. 

The image below is from tropicaltidbits.com and shows a forecast for September 2023 of the 2-meter temperature anomaly in degrees Celsius and based on 1984-2009 model climatology. The anomalies are forecast to be very high for the Arctic Ocean, as well as for the Southern Ocean around Antarctica, which spells bad news for sea ice at both hemispheres.


Similarly, the image below shows a forecast for October 2023. 


There are many further developments and feedbacks that could additionally speed up the temperature rise, such as rising greenhouse gases (including water vapor), falling away of the aerosol masking effect, more biomass being burned for energy and an increase in forest and waste fires, as also discussed at the Aerosols page

As an earlier post mentions, the upcoming temperature rise on land on the Northern Hemisphere could be so high that it will cause much traffic, transport and industrial activity to grind to a halt, resulting in a reduction in aerosols that are currently masking the full wrath of global warming.

The image below shows dust as high as 9.1887 τ, i.e. light at 550 nm as a measurement of aerosol optical thickness due to dust aerosols, on January 23, 2023 01:00 UTC (at the green circle).


[ see the Extinction page ]
2023 study concludes that the amount of atmospheric desert dust has increased globally by about 55% since the mid-1800s, resulting in a net masking effect of −0.2 ± 0.5 W m⁻² for dust aerosols alone, more than climate models previously thought.

As discussed in an earlier post, the IPCC in AR6 estimates the aerosol ERF to be −1.3 W m⁻², adding that there has been an increase in the estimated magnitude of the total aerosol ERF relative to AR5. In AR6, the IPCC estimate for liquid water path (LWP, i.e., the vertically integrated cloud water) adjustment is 0.2 W m⁻², but a recent analysis found a forcing from LWP adjustment of −0.76 W m⁻², which would mean that the IPCC estimate of −1.3 W m⁻² should be changed to -2.26 W m⁻². When using a sensitivity of 1°C per W m⁻², this translates into an impact of -2.26°C and that doesn't even include the above-mentioned extra impact of dust. Furthermore, the IPCC's total for aerosols includes a net positive impact for warming aerosols such as black carbon, so the impact of cooling aerosols alone (without warming aerosols) will be even more negative.

The image on the right, from the extinction page, includes a potential rise of 1.9°C by 2026 as the sulfate cooling effect falls away and of 0.6°C due to an increase in warming aerosols by 2026.

In the video below, Guy McPherson discusses our predicament.


Final conclusions and reflections

It's important to avoid using terminology that may cause confusion. The image below shows some terms that may cause confusion (left), and terms that could be considered to be used instead (right).


As an example, it's better to avoid terms such as 'overshoot' and target', as illustrated by the image below.  

It's important to look at the bigger picture and recognize that these developments and feedbacks could jointly cause a temperature rise (from pre-industrial) of as much as 18.44°C by 2026, as discussed at the Extinction page. Also note that humans are likely to go extinct with a rise of 3°C, as illustrated by the image below, from an analysis discussed in an earlier post and underpinned by this post.


Earlier versions of the text in the image below were posted here and here


The situation is dire and threatens to turn catastrophic soon. The right thing to do now is to help avoid or delay the worst from happening, through action as described in the Climate Plan.


Links

• Copernicus temperature

• NOAA National Centers for Environmental Information, State of the Climate: Monthly Global Climate Report for October 2022, retrieved November 16, 2022
https://www.ncei.noaa.gov/access/monitoring/monthly-report/global/2022010/supplemental/page-4

• Tonga volcano eruption raises ‘imminent’ risk of temporary 1.5C breach https://www.carbonbrief.org/tonga-volcano-eruption-raises-imminent-risk-of-temporary-1-5c-breach

• Tonga eruption increases chance of temporary surface temperature anomaly above 1.5 °C - by Stuart Jenkins et al. 
https://www.nature.com/articles/s41558-022-01568-2

• NSIDC - National Snow and Ice Data Center - Charctic Interactive Sea Ice Graph
https://nsidc.org/arcticseaicenews/charctic-interactive-sea-ice-graph

• Climate Reanalyzer
https://climatereanalyzer.org/wx/todays-weather/?var_id=seaice-snowc&ortho=7&wt=1

• Meltwater Intrusions Reveal Mechanisms for Rapid Submarine Melt at a Tidewater Glacier - by Rebecca Jackson et al. (2019)
https://agupubs.onlinelibrary.wiley.com/doi/10.1029/2019GL085335

• Greenland’s Glaciers Might Be Melting 100 Times As Fast As Previously Thought (2022)
https://news.utexas.edu/2022/12/15/greenlands-glaciers-might-be-melting-100-times-as-fast-as-previously-thought

• An Improved and Observationally-Constrained Melt Rate Parameterization for Vertical Ice Fronts of Marine Terminating Glaciers - by Kirstin Schulz et al. (2022)
https://agupubs.onlinelibrary.wiley.com/doi/full/10.1029/2022GL100654

• National Institute of Polar Research, Japan
https://ads.nipr.ac.jp/vishop/#/extent

• NASA - GISS Surface Temperature Analysis (v4) - Global Maps

• NOAA - Climate at a Glance Global Time Series

• Critical Tipping Point Crossed In July 2019
• Another Year of Record Heat for the Oceans - by Lijing Cheng et al. 

• Copernicus - methane

• NOAA - methane MetOp-B satellite

• Methane - section 16. Methane rising from Arctic Ocean seafloor

• Tropicaltidbits.com
https://www.tropicaltidbits.com

• The upcoming El Nino and further events and developments

• Jet Stream

• Cold freshwater lid on North Atlantic

• Pre-industrial
https://arctic-news.blogspot.com/p/pre-industrial.html

• Invisible ship tracks show large cloud sensitivity to aerosol - by Peter Manhausen et al.
https://www.nature.com/articles/s41586-022-05122-0

• Methane keeps rising
https://arctic-news.blogspot.com/2022/10/methane-keeps-rising.html

• Global warming in the pipeline - by James Hansen et al. 
https://export.arxiv.org/ftp/arxiv/papers/2212/2212.04474.pdf

• Latent Heat
https://arctic-news.blogspot.com/p/latent-heat.html

• Extinction
https://arctic-news.blogspot.com/p/extinction.html

• When will we die?
https://arctic-news.blogspot.com/2019/06/when-will-we-die.html

• When will humans go extinct?


Thursday, December 22, 2022

Wild Winter Weather

[ posted earlier at facebook ]
The image on the right shows a forecast of very low temperatures over North America with a temperature of -40 °C / °F highlighted (green circle at center) for December 23, 2022 14:00 UTC. 

As the image shows, temperatures over large parts of North America are forecast to be even lower than the temperature at the North Pole.  

The combination image below illustrates this further, showing temperatures as low as -50.3°C or -58.6°F in Alaska on December 22, 2022 at 17:00 UTC, while at the same time the temperature at the North Pole was -13.6°C or 7.4°F. 


The Jet Stream

The image below shows the Jet Stream (250 hPa) on December 13, 2022, stretched out vertically and reaching the North Pole as well as the South Pole, while sea surface temperature anomalies are as high as 11°C or 19.7°F from 1981-2011 at the green circle. 

The Jet Stream used to circumnavigate the globe within a narrow band from West to East (due to the Coriolis Force), and it used to travel at relatively high speed, fuelled by the temperature difference between the tropics and the poles.

[ posted earlier at facebook ]

The Jet Stream used to circumnavigate the globe within a narrow band from West to East (due to the Coriolis Force), and it used to travel at relatively high speed, fuelled by the temperature difference between the tropics and the poles. 

As the above image shows, the Pacific Ocean is currently cooler at the tropics and warmer further to the north (compared to 1981-2011), which narrows this temperature difference and in turn makes the Jet Stream wavier. Accordingly, the Jet Stream is going up high into the Arctic before descending deep down over North America. 


[ click omn images to enlarge ]
The above image shows Rossby waves, from NOAA. When you see a wave traveling along the surface of water, there are peaks and troughs in the water height. The same happens in the atmosphere with a traveling Rossby wave – as the Rossby wave travels through the atmosphere, the peaks and troughs of the wave produce regions of high and low air pressure.

The image on the right shows air pressure at sea level on December 22, 2022. High sea surface temperatures make air rise, lowering air pressure at the surface to levels as low as 973 hPa over the Pacific. Conversely, a more wavy Jet Stream enables cooler air to flow from the Arctic to North America, raising air pressure at the surface to levels as high as 1056 hPa.

On December 22, 2022, the Jet Stream reached very high speeds over the Pacific, fuelled by high sea surface temperature anomalies. The image on the right shows the Jet Stream moving over the North Pacific at speeds as high as 437 km/h or 271 mph (with a Wind Power Density of 349.2 kW/m², at the green circle). 

The Jet Stream then collides with higher air pressure and moves up into the Arctic, and subsequently descends deep down over North America, carrying along cold air from the Arctic. Deformation of the Jet Stream also results in the formation of circular wind patterns that further accelerate the speed of the Jet Stream. 

The image on the right shows the Jet Stream moving over North America at speeds as high as 366 km/h or 227 mph (green circle). The image also shows high waves in the North Pacific. 

La Niña / El Niño

The low sea surface temperature anomalies in the Pacific Ocean are in line with the current La Niña. 

The fact that such extreme weather events occur while we're in the depth of a persistent La Niña is worrying. The next El Niño could push up temperatures further, which would hit the Arctic most strongly. This would further narrow the difference between temperatures at the Equator and the North Pole, thus making the Jet Stream more wavy, which also enables warm air to move into the Arctic, further accelerating feedbacks in the Arctic.

The image below, from NOAA, indicates that the next El Niño is likely to emerge soon. More about that in the next post. 


Conclusion

The situation is dire and calls for immediate, comprehensive and effective action as described in the Climate Plan


Links

• nullschool

• Jet Stream

• Coriolis Force

• NOAA - What are teleconnections? Connecting Earth's climate patterns via global information superhighways

• Wind Power Density

• Extreme Weather
https://arctic-news.blogspot.com/p/extreme-weather.html

• Feedbacks in the Arctic
https://arctic-news.blogspot.com/p/feedbacks.html

• NOAA - Multivariate ENSO Index Version 2 (MEI.v2)


Friday, December 16, 2022

The short lifespan of technological civilizations and the future of Homo sapiens

by Andrew Glikson

In his book ‘Collapse’ (2011) Jared Diamond portrays the fate of societies which Choose to Fail or Succeed. On a larger scale the Fermi’s paradox suggests that advanced technological civilizations may constitute ephemeral entities in the galaxy, destined to collapse over short periods. Such an interpretation of Fermi’s paradox, corroborated by recent terrestrial history, implies that the apparent absence of radio signals from Milky Way planets and beyond may be attributed to an inherently self-destructive nature of civilizations which reached the ability to propagate radio waves, consistent with Carl Sagan’s views. It can be expected therefore that the number of advanced technological societies in the universe will be proportional to their average lifetime, perhaps lasting no more than a few centuries. Inexplicably, the behavior of Homo “sapiens” reveals the reality of Fermi’s paradox, unless humans can wake up in time.

Since the onset of the Neolithic about ~10,000 years ago open-ended combustion of wood, coal, oil, methane and gas for production of steam power and electricity (Figure 1), and of uranium to generate nuclear power, constrain the life expectancy of industrial civilizations through proliferation of greenhouse gases, alteration of the chemistry of the atmosphere and proliferation of nuclear, chemical and biological weapons, testifying to the relevance of Fermi’s paradox in the 20-21 centuries.

Geological and astronomical studies establish Earth is unique among the terrestrial planets in harboring advanced life forms, including colonial life since as early as ~3.5 billion years ago. Should the fate of Homo sapiens be recorded, history would tell that, while the atmosphere was overheating, oceans acidifying and radioactivity rising, humans never ceased to saturate the atmosphere with greenhouse gases, mine uranium, unleash fatal wars and fire rockets at the planets. All the time indulging in sports games and inundating the airwaves with gratuitous words, false promises, misconstrued assumptions and simple lies ─ betraying their future generations and a multitude of species on the only haven of life known in the solar system.

Fig. 1. A combined night lights image of Earth signifying global civilization. NASA

In a new paper titled ‘Global warming in the pipeline’, Hansen et al. (2022) state: “glacial-to-interglacial global temperature change implies that fast-feedback equilibrium climate sensitivity is at least ~4°C for doubled CO₂ with likely range 3.5-5.5°C. Greenhouse gas (GHG) climate forcing is 4.1 W/m² larger in 2021 than in 1750, equivalent to 2xCO₂ forcing. Global warming in the pipeline is greater than prior estimates. Eventual global warming due to today's GHG forcing alone -- after slow feedbacks operate -- is about 10°C. Human-made aerosols are a major climate forcing, mainly via their effect on clouds ... A hinge-point in global warming occurred in 1970 as increased GHG warming outpaced aerosol cooling, leading to global warming of 0.18°C per decade.

The inevitable consequence is a shift in the position of the Earth’s climate zones, a decline in the Earth’s albedo (a climatologically significant ~0.5 W/m² decrease over two decades), a rise in greenhouse gases at a geologically unprecedented rate of 2-3 ppm/year), acidification of the oceans (by about 26 percent), receding ice sheets, rising sea levels (~20 cm since 1900), changes in vegetation, forests and soils, a shift in state of the climate and mass extinction, with humans are driving around one million species to extinction.

For longer than 50 years few were aware that a rise in atmospheric CO₂ on the scale of ~100 ppm CO₂ at the annual rate of 2 - 3 ppm per year, could lead to the unhabitability of large parts of Earth (The Uninhabitable Earth, by David Wallace-Wells) (Figure 2A). Now we find ourselves surrounded by the consequences ─ hydrocarbon saturation of air and water, runaway global heating, acidification, dissemination of micro-plastics, habitat destruction, radioactive overload, proliferation of chemical weapons ─ In confirmation of the reality of Fermi’s Paradox.
 
But just at the time the world was increasingly overwhelmed by extreme weather events, severe fires and floods, climate scientists were increasingly ignored, replaced by politicians, bureaucrats, economists, strategists and vested interests ignorant of the basic laws of physics and of the principles which control the atmosphere-ocean system. Policies and promises guided by the science have been betrayed and meaningful mitigation and adaptation negated by the opening of new coal mines and gas fields. Cold war strategies violating the United Nation charter were depleting the resources required for mitigation of the looming climate catastrophe. Within a blink of geological eye, at a rate unprecedented since the extinction of the dinosaurs, large regions of Earth were becoming increasingly uninhabitable for a multitude of species, surpassing 350 ppm CO₂ and approaching Miocene (5.3 – 23.0 Ma)-like conditions (Figure 2B). All along humans continued busily developing a veritable doomsday machine near 1300 nuclear warheads-strong threatening release within seconds.
Fig. 2. (A) Upper Holocene temperatures. (B). The Middle Miocene long-term continental (brown) and marine (blue) temperature change. Red arrow points to the present (2022) average global temperature of 13.9°C NOAA.

That humans are capable of committing the most horrendous crimes upon each other, on other species and on nature, including mass exterminations, has been demonstrated during the 20th century by the Nazi concentration camps and by genocidal conflicts such as in Viet Nam, Cambodia, Laos, Rwanda, Yemen, Iraq, Afghanistan, Bosnia, Ukraine ─ the list goes on … 

Fig. 3. Tsar Bomba, exploded above Novaya Zemlya
The ultimate step toward the Fermi’s paradox has been reached following nuclear experiments in New Mexico, Novaya Zemlya (Figure 3), the bombing of Hiroshima and Nagasaki and the rising prospects of a nuclear war, with consequent firestorms, radiation from fallout, a nuclear winter, and electromagnetic pulses looming ever greater. According to a paper by Robock and Toon (2012) ‘Self-assured destruction: The climate impacts of nuclear war’, a thermonuclear war could lead to the end of modern civilization, due to a long-lasting nuclear winter and the destruction of crops. In one model the average temperature of Earth during a nuclear winter, where black smoke from cities and industries rise into the upper stratosphere, lowers global temperatures by 7 – 8° Celsius for several years.

As stated by Hansen et al. (2012): “Burning all fossil fuels would create a different planet than the one that humanity knows. The paleoclimate record and ongoing climate change make it clear that the climate system would be pushed beyond tipping points, setting in motion irreversible changes, including ice sheet disintegration with a continually adjusting shoreline, extermination of a substantial fraction of species on the planet, and increasingly devastating regional climate extremes”.

A nuclear war in the background of carbon saturated atmosphere can only lead to extreme damage to the life support systems of the planet. The propensity of “sapiens” to genocide and ecocide, are hardly masked by the prevailing Orwellian language of politicians in the absence of meaningful action to avert the demise of the biosphere as we know it. Whereas the ultimate consequences of global heating are likely to occur within a century, including temperature polarities including heat waves and regional cooling of ocean regions by ice melt flow from Antarctica and Greenland ice sheets (Gikson 2019), a nuclear war on the scale of the MAD (Mutual Assured Destruction) can erupt on a time scale of minutes …

On July 16, 1945, witnessing the atomic test at the Trinity site, New Mexico, Robert Oppenheimer, the chief nuclear scientist (Figure 4), cited the Hindu scripture of Shiva from the Bhagavad Gita: “Now I am become Death, the destroyer of worlds”. Then, as stated by Albert Einstein: “The splitting of the atom has changed everything, except for man’s way of thinking, and thus we drift into unparalleled catastrophes”.

Andrew Glikson
A/Professor Andrew Glikson

Earth and Paleo-climate scientist
School of Biological, Earth and Environmental Sciences
The University of New South Wales,
Kensington NSW 2052 Australia
16 December 2022

Books:
The Asteroid Impact Connection of Planetary Evolution
https://www.springer.com/gp/book/9789400763272
The Archaean: Geological and Geochemical Windows into the Early Earth
https://www.springer.com/gp/book/9783319079073
Climate, Fire and Human Evolution: The Deep Time Dimensions of the Anthropocene
https://www.springer.com/gp/book/9783319225111
The Plutocene: Blueprints for a Post-Anthropocene Greenhouse Earth
https://www.springer.com/gp/book/9783319572369
Evolution of the Atmosphere, Fire and the Anthropocene Climate Event Horizon
https://www.springer.com/gp/book/9789400773318
From Stars to Brains: Milestones in the Planetary Evolution of Life and Intelligence
https://www.springer.com/us/book/9783030106027
Asteroids Impacts, Crustal Evolution and Related Mineral Systems with Special Reference to Australia
https://www.springer.com/us/book/9783319745442
The Event Horizon: Homo Prometheus and the Climate Catastrophe
https://www.springer.com/gp/book/9783030547332
The Fatal Species: From Warlike Primates to Planetary Mass Extinction
https://www.springer.com/gp/book/9783030754679