As temperatures keep rising, should the IPCC raise the alarm?
Some 1,750 jurisdictions in 30 countries have now declared a climate emergency, according to this post dated July 8, 2020. The United Nations does acknowledge the Climate Emergency, but its description is sourced from the IPCC Global Warming of 1.5°C report that was approved back in 2018. A lot has happened since, as described in many posts at Arctic-news. When a state of emergency is declared, doesn't one expect such a declaration to result in action, complete with updates on the effectiveness of the action?
Described below are some events taking place right now.
Arctic Sea Ice at Record Low for Time of Year
Arctic sea ice looks set to reach an all-time record low in September 2020.
In an earlier post, Paul Beckwith describes a Blue Ocean Event (BOE) and some of the consequences of the changes taking place in the Arctic. A BOE occurs when sea ice extent gets below 1 million km², which is important regarding the amount of sunlight absorbed/reflected in the Arctic (albedo feedback).
Arctic sea ice extent on July 20, 2020, was well below the minimum of the 1979-1990 average (the orange line among the blue lines on the image below).
If it continues on its current trajectory, Arctic sea ice may well be gone altogether in September 2020.
A BOE is one of the many tipping points that threaten to get crossed in the Arctic.
[ click on images to enlarge ]
As illustrated by the image on the right, sea ice is getting very thin, which threatens the latent heat tipping point to be crossed, meaning there is no buffer of sea ice left underneath the surface of the sea ice to absorb ocean heat.
Furthermore, the temperature rise in the Arctic is accelerating and the Arctic Ocean is getting very hot, threatening that the methane hydrates tipping point will get crossed.
The navy.mil animation below run on July 20, 2020, shows the fall in sea ice thickness over 30 days (last 8 frames are forecasts for July 21-28, 2020).
The combination image below illustrates the speed at which Arctic sea ice is disappearing, with sea ice thickness shown in meters from left to right at June 1, June 18, July 1 and July 18, 2020.
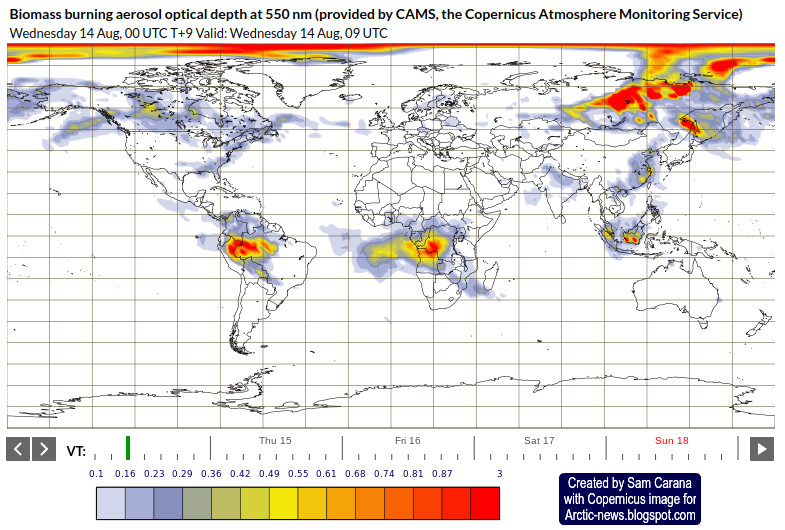
Meanwhile, fires and smoke are visible at a distance of as little as 1970 km or 1224 miles from the North Pole.
The image below shows open water on the edge of the sea ice, north of Greenland and the Canadian Archipelago, where the thickest sea ice used to be located.
Alarming acceleration of heating continues
The image below shows the global temperature rise through to June 2020.
[ click on images to enlarge ]
The red trend supports fears that the 2°C above preindustrial threshold has already been crossed this year, while loss of the aerosol masking effect and an emerging El Niño could trigger a huge further temperature rise.
Global temperature anomalies are typically lower in June (yellow circles) than the annual anomaly. The Copernicus image below shows twelve-month averages of global-mean surface air temperature anomalies relative to 1981-2010.
The shape of current anomalies is very similar to the peak reached around 2016. This is alarming because the peak around 2016 was reached under El Niño conditions, whereas the current temperatures are reached under conditions that are leaning toward La Niña, as illustrated by the images below.
In conclusion, one may wonder how much stronger the temperature rise will be once El Niño conditions do arrive.
[ click on images to enlarge ]
Furthermore, one may wonder how much current temperatures are elevated by a decrease in emissions due to COVID-19 restrictions, which in turn makes one wonder how much higher the temperature will be when the aerosol masking effect will fall away even further as the world phases out coal-fired power plants, bunker oil for shipping, etc. Guy McPherson concludes that a 1°C rise in global-average temperature will occur within a few days or weeks after industrial activity is reduced by as little as 20%.
Very high sea surface temperature anomalies in the Arctic Ocean
Sea surface temperature anomalies in the Arctic Ocean are very high. As discussed in a recent post, sea surface temperatures in the Bering Strait were as much as 15.1°C or 27.2°F hotter than 1981-2011 on June 20, 2020 (in Norton Sound, Alaska, at the green circle).
As the image below shows, the sea surface temperature at green circle used to be 0.3°C (32.6°F). It was 12°C (53.6°F) on July 18, 2020.
Much of the Arctic Ocean is quite shallow, making that the water can warm up very quickly during summer heat peaks and heat can reach the seafloor, which comes with the risk that heat will penetrate cracks in sediments at the seafloor. Melting of ice in such cracks can lead to abrupt destabilization of methane hydrates contained in sediments.
Very high peak methane levels
Ominously, as the 2020 Siberian heatwave continues, very high peak methane levels show up over the Arctic Ocean. The NOAA 20 satellite recorded a peak methane level of 2728 ppb at 399 mb on the afternoon of July 16, 2020.
The MetOp-1 satellite recorded a peak methane level of 2726 ppb on the afternoon of July 16, 2020. Also, a mean methane level of 1897 ppb was recorded at 469 mb and a mean methane level of 1908 ppb at 293 mb.
The situation is dire and calls for immediate, comprehensive and effective action, as described in the Climate Plan.
On November 16, 2019, there was little sea ice between Greenland and Svalbard. For reference, the image below has been added, showing coastlines for the same area.
The image on the right shows that the average air temperature (2 m) on November 15, 2019, was 4°C higher over the Arctic than during 1979-2000.
Ocean heat is rising up from the Arctic Ocean, while a wavy jet stream enables cold air to leave the Arctic and descend over North America and Eurasia. On November 13, 2019, it was warmer in Alaska than in Alabama.
The image below shows temperatures north of 80°N. The red line on the image shows the 2019 daily mean temperature up to November 16, 2019. The temperature is now well above the 1958-2002 mean (green line). The image also shows the freezing point of fresh water (273.15K, 0°C or 32°F, blue line).
The freezing point for salt water is lower, at around -2°C, or 28.4°F, or 271.2°K. In other words, a rise in the salt content of the water alone can make ice melt, i.e. even when the temperature of the water doesn't rise.
The image below shows that Arctic sea ice volume has been at record low levels for the time of year for some time.
As the image below shows, Arctic sea ice extent in the Chukchi Sea is currently very low.
[ image by Zack Labe, uploaded November 13, 2019 ]
Oceans are absorbing more than 90% of global heating, as illustrated by the image below.
Arctic sea ice used to absorb 0.8% of global heating (in 1993 to 2003). Ocean heat keeps flowing into the Arctic Ocean, carried by ocean currents, as illustrated by the image below.
As peak heat arrives in the Arctic Ocean, it melts sea ice from below. In Summer 2019, a critical tipping point was crossed; ocean heat could no longer find further sea ice to melt, as the thick sea ice that hangs underneath the surface had disappeared. A thin layer of sea ice at the surface was all that remained, as air temperatures remained low enough to prevent it from melting from above.
This indicates that the buffer has gone that has until now been consuming ocean heat as part of the melting process. As long as there is sea ice in the water, this sea ice will keep absorbing heat as it melts, so the temperature will not rise at the sea surface. The amount of energy absorbed by melting ice is as much as it takes to heat an equivalent mass of water from zero to 80°C.
The images above and below shows very high sea surface temperature anomalies on the Northern Hemisphere for October 2015 and October 2019. In both cases, anomalies of 1.09°C or 1.96°F above the 20th century average were recorded.
The October 2015 anomaly occurred under El Niño conditions, whereas the equally-high anomaly in October 2019 occurred under El Niño/La Niña-neutral conditions, while another El Niño is likely to come in 2020. In other words, the threat is that even more ocean heat is likely to arrive in the Arctic Ocean in 2020.
The danger is particularly high in October, as Arctic sea ice starts growing in extent at the end of September, thus sealing off the water, meaning that less ocean heat will be able to escape to the atmosphere. This increases the danger that hot water will reach sediments at the Arctic Ocean seafloor and trigger massive methane eruptions.
Concentrations of carbon dioxide (CO₂, 407.8 ppm), methane (CH₄, 1869 ppb) and nitrous oxide (N₂O, 331.1 ppb) in 2018 surged by higher amounts than during the past decade, the WMO said in a recent news release and as illustrated by the image on the right, which shows that CH₄, CO₂ and N₂O levels in the atmosphere in 2018 were, respectively, 259%, 147% and 123% of their pre-industrial (before 1750) levels.
“There is no sign of a slowdown, let alone a decline, in greenhouse gases concentration in the atmosphere despite all the commitments under the Paris Agreement on Climate Change,” said WMO Secretary-General Petteri Taalas.
“It is worth recalling that the last time the Earth experienced a comparable concentration of CO2 was 3-5 million years ago. Back then, the temperature was 2-3°C warmer, sea level was 10-20 meters higher than now,” said Mr Taalas.
Global methane levels are very high. Mean global methane levels were as high as 1914 parts per billion on September 3, 2019, as discussed in a recent post. Peak methane levels as high as 2961 parts per billion were recorded by the MetOp-2 satellite on October 24, 2019, in the afternoon at 469 mb.
The situation is dire and calls for comprehensive and effective action, as described in the Climate Plan.
In July 2019, a critical tipping point was crossed. July sea surface temperatures on the Northern Hemisphere were 1.07°C above what they were during the 20th century, as illustrated by above image which has a trend added that points at 5°C above the 20th century by 2033.
Why is 1°C above 20th century's temperature such a critical tipping point for the sea surface on the Northern Hemisphere? Let's first take a look at where global heating is going.
Oceans are absorbing over 90% of global heating, as illustrated by above image. Due to the high greenhouse gas levels resulting from people's emissions, oceans keep on getting hotter, and given oceans' huge heat-absorbing capacity, it has taken many years before this tipping point was crossed.
In July 2016, the tipping point was touched at 0.99°C. In July 2017, the July temperature anomaly was on the tipping point, at exactly 1°C. In July 2018, the sea surface was a bit cooler, and the tipping point was crossed in July 2019 when the temperature anomaly was 1.07°C above the 20th century average.
Arctic sea ice used to absorb 0.8% of global heating (in 1993 to 2003). Ocean heat keeps flowing into the Arctic Ocean, carried by ocean currents, as illustrated by above image. As peak heat arrives in the Arctic Ocean, it melts sea ice from below.
The image below shows sea surface temperatures on August 13, 2019 (left) and on September 9, 2019 (right). The light blue line forms a line indicating the sea surface temperature there is 0°C. That light blue line has moved pole-ward in September, due to rivers that kept adding warm water and also due to more warmer water entering the Arctic Ocean from the Atlantic Ocean and the Pacific Ocean.
As above image also shows, the sea surface near Svalbard was 20.4°C (or 68.7°F) at the area marked by the green circle on August 13, 2019 (left), and 20.3°C (or 68.5°F) on September 9, 2019 (right), indicating how high the temperature of the water can be underneath the surface, as it moves into the Arctic Ocean. In other words, further ocean heat is still entering the Arctic Ocean.
From mid August 2019, ocean heat could no longer find any sea ice to melt, since the thick sea ice that hangs underneath the surface had already disappeared. A thin layer of sea ice at the surface was all that remained, as air temperatures didn't come down enough to melt it from above.
This indicates that the buffer has gone that has until now been consuming ocean heat as part of the melting process. As long as there is sea ice in the water, this sea ice will keep absorbing heat as it melts, so the temperature will not rise at the sea surface. The amount of energy absorbed by melting ice is as much as it takes to heat an equivalent mass of water from zero to 80°C.
The image below, created with NOAA 2007-2019 June-August sea surface temperature data, shows how extra heating of the sea surface on the Northern Hemisphere from 2012 caused the buffer to disappear and the 1°C tipping point to be crossed in 2019.
Once the buffer is gone, further heat arriving in the Arctic Ocean must go elsewhere.
The image below illustrates the difference in extent between the years, as recorded by ads.nipr.ac.jp. On September 13, 1980, Arctic sea ice extent was 7.77 million km². On September 17, 2019, Arctic sea ice extent was 3.96 million km². On September 16, 2012, extent was 3.18 million million km².
Arctic sea ice will soon be growing in extent, sealing off the water, meaning that less ocean heat will be able to escape to the atmosphere.
This situation comes at a time that methane levels are very high globally. Mean global methane levels were as high as 1911 parts per billion on September 3, 2019, as discussed in a recent post. This post, as well as many earlier posts, also discussed the danger that ocean heat will reach sediments at the seafloor of the Arctic Ocean and cause huge methane releases.
Ominously, methane levels at Barrow, Alaska, were very high recently, as illustrated by above image showing methane levels peaking at over 2500 parts per billion. The satellite image below shows the global situation on the afternoon of September 13, 2019, when peak methane levels as high as 2605 ppb were recorded by the MetOp-1 satellite at 586 mb.
In the videos below, Paul Beckwith discusses the situation.
Record low Arctic sea ice extent for the time of year
Arctic sea ice minimum extent typically occurs about half September. In 2012, minimum extent was reached on September 17, 2012, when extent was 3.387 million km².
On July 28, 2019, Arctic sea ice extent was 6.576 million km². How much extent do you think there will be by September 17, 2019? From July 28, 2019, to September 17, 2019, that's a period of 52 days during which a lot of melting can occur. Could there be a Blue Ocean Event in 2019, with virtually all sea ice disappearing in the Arctic?
Consider this. Extent was 6.926 million km² on September 17, 1989. Extent was 3.387 million km² on September 17, 2012, so 3.539 million km² had disappeared in 23 years. Over those years, more ice extent disappeared than what was left on September 17, 2012.
The question is how much sea ice extent will be left when it will reach its minimum this year, i.e. in September 2019. The red dashed line on the image at the top continues the path of the recent fall in sea ice extent, pointing at zero Arctic sea ice extent in September 2019. Progress is followed at this post.
Zero Arctic sea ice in 2019
Zero Arctic sea ice in 2019 sounds alarming, and there is good reason to be alarmed.
Above map shows temperatures on Greenland on July 31, 2019, with temperatures at one location as high as 23.2°C or 73.8°F and at another location - in the north - as high as 14.2°C or 57.6°F.
The map on the right shows sea surface temperature anomalies compared to 1961-1990 as on July 29, 2019. Note the high anomalies in the areas where the sea ice did disappear during the past few months. The reason for these high anomalies is that the buffer has disappeared that previously had kept consuming heat in the process of melting.
Where that buffer is gone, the heat has to go somewhere else, so it will be absorbed by the water and it will also speed up heating of the atmosphere over the Arctic.
Sea ice melting is accelerating for a number of reasons:
Ocean Heat - Much of the melting of the sea ice occurs from below and is caused by heat arriving in the Arctic Ocean from the Atlantic Ocean and the Pacific Ocean.
Direct Sunlight - Hot air will melt the ice from above and this kind of melting can increase strongly due to changing wind patterns.
Rivers - Heatwaves over land can extend over the Arctic Ocean and they also heat up river water flowing into the Arctic Ocean.
Fires - Changing wind patterns can also increase the intensity and duration of such heatwaves that can also come with fires resulting in huge amounts of greenhouse gas emissions, thus further speeding up the temperature rise, and also resulting in huge emissions of soot that, when settling on sea ice, speeds up melting (see images below).
Numerous feedbacks will further speed up melting. Heating is changing the texture of the sea ice at the top and is making melt pools appear, both of which cause darkening of the surface. Some further feedbacks, i.e. storms and clouds are discussed below in more detail.
Above combination image shows smoke from fires in Siberia getting pushed over the Laptev Sea on August 11, 2019, due to cyclonic winds over the Arctic Ocean. This was also discussed in an earlier post. The image below shows the situation on August 12, 2019.
The image below shows the situation on August 14, 2019.
In the video below, Paul Beckwith discusses the heating impact of albedo loss due to Arctic sea ice loss, including the calculations in a recent paper.
As the Arctic is heating up faster than the rest of the world, it is also more strongly affected by the resulting extreme weather events, such as heatwaves, fires, strong winds, rain and hail storms, and such events can strongly speed up the melting of the sea ice.
All around Greenland, sea ice has now virtually disappeared. This is the more alarming considering that the thickest sea ice was once located north of Greenland. This indicates that the buffer is almost gone.
Why is disappearance of Arctic sea ice so important? Hand in hand with albedo loss as the sea ice disappears, there is loss of the buffer (feedbacks #1, #14 and more). As long as there is sea ice in the water, this sea ice will keep absorbing heat as it melts, so the temperature will not rise at the sea surface. The amount of energy absorbed by melting ice is as much as it takes to heat an equivalent mass of water from zero to 80°C.
Once the sea ice is gone, further heat must go elsewhere. This heat will raise the temperature of the water and will also make the atmosphere heat up faster.
Storms and Clouds
Storms: As temperatures in the Arctic are rising faster than at the Equator, the Jet Stream is changing, making it easier for warm air to enter the Arctic and for cold air to descend over continents that can thus become much colder than the oceans, and this stronger temperature difference fuels storms.
Clouds: More evaporation will occur as the sea ice disappears, thus further heating up the atmosphere (technically know as latent heat of vaporization).
In the video below, Paul Beckwith further discusses Arctic albedo change and clouds.
Disappearance of the sea ice causes more clouds to form over the Arctic. This on the one hand makes that more sunlight gets reflected back into space. On the other hand, this also make that less outward infrared radiation can escape into space. The net effect of more clouds is that they are likely cause further heating of the air over the Arctic Ocean (feedbacks #23 and #25).
More low-altitude clouds will reflect more sunlight back into space, and this occurs most during Summer when there is most sunshine over the Arctic. The image below, a forecast for August 17, 2019, shows rain over the Arctic. Indeed, more clouds in Summer can also mean rain, which can devastate sea ice, as discussed in an earlier post.
Regarding less outward radiation, the IPCC has long warned, e.g. in TAR, about a reduction in outgoing longwave radiation (OLR): "An increase in water vapour reduces the OLR only if it occurs at an altitude where the temperature is lower than the ground temperature, and the impact grows sharply as the temperature difference increases."
While reduction in OLR due to water vapor is occurring all year long, the impact is particularly felt in the Arctic in Winter when the air is much colder than the surface. In other words, less OLR makes Arctic sea ice thinner, especially in Winter.
The inflow of ocean heat into the Arctic Ocean can increase strongly as winds increase in intensity. Storms can push huge amounts of hot, salty water into the Arctic Ocean, as discussed earlier, such as in this post and this post. As also described at the extreme weather page, stronger storms in Winter will push more ocean heat from the Atlantic toward the Arctic Ocean, further contributing to Arctic sea ice thinning in Winter.
Seafloor Methane
As the buffer disappears that until now has consumed huge amounts of heat, the temperature of the water of the Arctic Ocean will rise even more rapidly, with the danger that further heat will reach methane hydrates at the seafloor of the Arctic Ocean, causing them to get destabilized and release huge amounts of methane (feedback #16).
Ominously, high methane levels were recorded at Barrow, Alaska, at the end of July 2019, as above image shows.
And ominously, a mean global methane level as high as 1902 ppb was recorded by the MetOp-1 satellite in the afternoon of July 31, 2019, as above image shows.
As the image on the right shows, mean global levels of methane (CH₄) have risen much faster than carbon dioxide (CO₂) and nitrous oxide (N₂O), in 2017 reaching, respectively, 257%, 146% and 122% their 1750 levels.
Temperature Rise
Huge releases of seafloor methane alone could make marine stratus clouds disappear, as described in an earlier post, and this clouds feedback could cause a further 8°C global temperature rise.
Indeed, a rapid temperature rise of as much as 18°C could result by the year 2026 due to a combination of elements, including albedo changes, loss of sulfate cooling, and methane released from destabilizing hydrates contained in sediments at the seafloor of oceans.
• Contribution of sea ice albedo and insulation effects to Arctic amplification in the EC-Earth Pliocene simulation, by Jianqiu Zheng et al. (2019) https://www.clim-past.net/15/291/2019