Antarctic sea ice is in danger of collapse, for a number of reasons, as discussed in an earlier post.
High Sea Surface Temperatures
The image below, adapted from Copernicus, illustrates that on October 16, 2026, the sea surface temperature (60°S–60°N) was 20.97°C, and 0.77°C above 1991-2020, the highest anomaly on record in a tie with recent days.


The map on the above image (inset bottom) shows global sea surface temperature anomalies on October 15, 2026. Sea surface temperatures look set to remain high or get even higher due to El Niño.
El Niño
 |
| [ sea surface temperature in the Niño 3.4 region ] |
 |
| [ anomaly in the Niño 1+2 region in 2026 ] |
The above image, adapted from Climate Reanalyzer, shows that the sea surface temperature was 30.05°C in the Niño 3.4 region on October 17, 2026, a +3.44°C anomaly versus 1982-2010.
The map (inset at the top of the above image) shows sea surface temperature anomalies versus 1991-2020 on October 17, 2026, around the globe, with the Niño 3.4 region highlighted. The Niño 3.4 region is most indicative of El Niño strength.
The image below shows the sea surface temperature anomaly vs 1951-1980 in the Niño 3.4 region over time, with the dotted line indicating anomalies may exceed 4°C above this base in 2026.

The combination image below, adapted from ECMWF, shows El Niño forecasts from October 1, 2026, for the Niño1+2 region (left) and the Niño3 region (right).

The image below, adapted from NOAA, illustrates that the El Niño's peak strength is forecast to occur late 2026.

Antarctic sea ice is already very low. The most rapid loss of Antarctic sea ice typically takes place in November and December, so this year this coincides with a Monster El Niño at its peak strength. The danger is that an Antarctic Blue Ocean Event may occur soon, as early as late 2026, i.e. well before February when Antarctic minimum sea ice typically occurs.
Earth's Energy Imbalance
Earth's Energy Imbalance keeps increasing, as illustrated by the image below, by Leon Simons.

Southern Ocean's sea surface becoming more saline
The image below, adapted from Climate Reanalyzer, illustrates that the monthly total column precipitable water anomaly in September 2026 was the highest on record.

On September 28, 2026, the surface air temperature in the tropics was 26.41°C, the highest temperature on record for that day and 1.33°C higher than 1979-2000, as illustrated by the image below, adapted from Climate Reanalyzer. The map (inset bottom) shows surface air temperature anomalies versus 1991-2020 on that day, with the tropics highlighted.


The image below, adapted from Climate Reanalyzer, shows precipitable water standardized anomalies on October 5, 2026.

The images below, adapted from Climate Reanalyzer, shows a forecast of precipitable water standardized anomalies for October 6, 2026.

These atmospheric rivers result in snow falling over Antarctica and thickening of the snow layer there. Evaporation of freshwater from the Southern Ocean has contributed to the sea surface of the Southern Ocean becoming more saline over the past decade, which makes it easier for the sea ice to melt, as discussed in an earlier post.
Sea level rise, sea ice loss and eruption of methane
As the sea surface heats up, several feedbacks are amplifying each other, such as ocean stratification, sea ice decline and sea level rise. At first glance, sea ice decline may not seem to contribute to sea level rise. However, its indirect contribution can be huge. Sea level rise is dominated by ocean thermal expansion (38%) and mass loss from melting glaciers (41%, IPCC AR6 data) and decline of ice sheets on land.
Ocean thermal expansion
Firstly, loss of sea ice indirectly contributes to sea level rise, since sea ice loss comes with albedo loss, resulting in higher temperatures that cause thermal expansion. Oceans absorb more than 90% of the extra heat resulting from Earth's Energy Imbalance. As water absorbs heat, its molecules gain energy, move faster, and spread further apart.
In a 2014 analysis, researchers led by Krisina Pistone calculate that albedo decrease resulting from Arctic sea ice decline between 1979 and 2011 correspond to an additional 6.4 W/m² of solar energy input into the Arctic Ocean region since 1979. Averaged over the globe, this albedo decrease corresponds to a forcing that is 25% as large as that due to the change in CO₂ during this period.
As the sea surface heats up, several feedbacks are amplifying each other, such as ocean stratification, sea ice decline and sea level rise. At first glance, sea ice decline may not seem to contribute to sea level rise. However, its indirect contribution can be huge. Sea level rise is dominated by ocean thermal expansion (38%) and mass loss from melting glaciers (41%, IPCC AR6 data) and decline of ice sheets on land.
Ocean thermal expansion
Firstly, loss of sea ice indirectly contributes to sea level rise, since sea ice loss comes with albedo loss, resulting in higher temperatures that cause thermal expansion. Oceans absorb more than 90% of the extra heat resulting from Earth's Energy Imbalance. As water absorbs heat, its molecules gain energy, move faster, and spread further apart.
In a 2014 analysis, researchers led by Krisina Pistone calculate that albedo decrease resulting from Arctic sea ice decline between 1979 and 2011 correspond to an additional 6.4 W/m² of solar energy input into the Arctic Ocean region since 1979. Averaged over the globe, this albedo decrease corresponds to a forcing that is 25% as large as that due to the change in CO₂ during this period.
Ice acting as a glue
Secondly, sea ice decline also has an impact on glaciers and ice sheets on land. The Thwaites glacier accounts for some 4% of sea level rise and this could double when taking into account grounding-zone processes. Both the Thwaites glacier and the adjacent sea ice act as a physical buffer, glue or plug holding back ice in the broader West Antarctic Ice Sheet. Sea level rise and increased ocean heat result in more heat reaching and melting parts of the West Antarctic Ice Sheet from above and from below, thus further speeding up the sea level rise. Sea ice loss also contributes to destabilization of land ice by resulting in more wave action and ocean heat reaching parts of the ice sheet, causing more melting from below.
Loss of latent heat buffer
Thirdly, with the disappearance of sea ice, the latent heat buffer disappears that would previously consume huge amounts of ocean heat in the process of sea ice melting. Loss of this buffer result in more heat remaining in the ocean, which can destabilize sediments at the seafloor that contain huge amounts of methane. The danger of methane erupting from the seabed near Antarctica was earlier discussed in this post. Melting of ice sheets can also result in isostatic rebound and lead to destabilization of sediments containing huge amounts of methane in the form of hydrates. Wild weather swings could also cause destabilization of sediments and subsequent methane eruptions, as warned about in this 2014 post and this 2025 post.
Why is this important?
The 2005 Hurricane Katrina caused 80% of New Orleans to be flooded, with some parts under 15 feet (4.6 m) of water. The compound effects of sea level rise, high tide and storm surge can be devastating, especially when infrastructure is not built with such dangers in mind. The 2007 article Ten Dangers of Global Warming warns how seemingly unrelated developments can combine, compound and make things progressively worse, with dangers feeding into and reinforcing each other, causing collapse of buildings, infrastructure, industries and of the economic and financial system, adding that - to some extent - a carbon-based currency could take over the role of money locally.
What could be done about it?

Similarly, fees could be imposed on sales of livestock products and nitrogen fertilizers made with fossil fuel, with revenues used to fund rebates on local purchases of vegan-organic food, biochar kilns, rock crushing machinery, etc. The currency could be expressed in volume or weight of locally-produced biochar, in recognition of the importance of the Biochar Economy, of which an early description was given in this 2011 post and later in this 2014 post.
Low Antarctic sea ice
The combination image below shows Antarctica sea ice concentration by the University of Bremen (left) and NSIDC (center) and Antarctic sea ice thickness (right) on October 11, 2026. The orange line on the image at the center shows the median ice edge 1981-2010.
 |
| [ click on images to enlarge ] |
On October 2, 2026, Antarctic sea ice extent was 16.796 million km², the lowest extent on record for the day. Extent has been falling since reaching its maximum on September 15, 2026, as illustrated by the image below, adapted from NSIDC.

Antarctic sea ice extent has fallen recently, and was 16.73 million km² on October 1, 2026, a record low for the time of year.
 |
| [ click on images to enlarge ] |
Antarctic sea ice can be expected to keep falling strongly over the next few months, due to the change in seasons and as El Niño gains in strength.
On October 3, 2026, Antarctic sea ice extent was 1.81 million km² lower than 1981-2010, the lowest extent and anomaly on record for that day and a deviation of -4.61σ. The blue band in the middle indicates one standard deviation from the 1981-2010 average.

On October 15, 2026, Antarctic sea ice area was 1.92 million km² lower than 1981-2010, the lowest anomaly on record for that day and a deviation of -5.31σ. The blue band in the middle indicates one standard deviation from the 1981-2010 average.

 |
Minimum Antarctic sea ice is typically reached in February, but the 2026 El Niño may cause an Antarctic Blue Ocean Event to occur early, as early as late 2026. As said, the 2026 El Niño is forecast to reach its greatest strength late 2026, while the 2026 El Niño is also forecast to become the strongest El Niño on record.
September 2026 sea surface temperature
The image below shows that the September 2026 ocean temperature was 1.10°C higher than 1901-2000, the highest anomaly on record. The added trend reflects El Niño peaking late 2026, contributing to an Antarctic Blue Ocean Event followed by an Arctic Blue Ocean Event.

The image below shows NASA ocean temperature anomalies versus 1880-1920.

Surface temperature

 |
| [ from the Extinction page ] |
Huge temperature rise
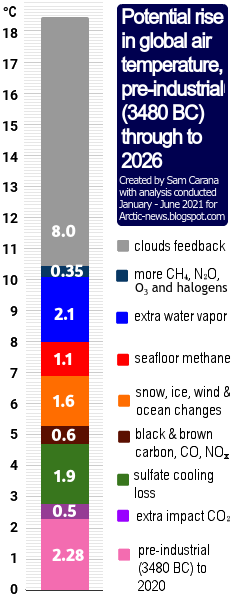
Disappearance of Antarctic sea ice would be a horrendous climate disaster, increasing the likelihood of a subsequent Arctic Blue Ocean Event. The danger is that multiple feedbacks associated with sea ice loss, such as albedo loss, will strongly speed up the temperature rise, as described at Double Blue Ocean Event and the Antarctica page.
Eruptions of methane from the seafloor could, on their own, cause the 1200 ppm CO₂e cloud feedback tipping point to be crossed, which in turn can cause global temperatures to rise by 8°C, as discussed in this earlier post.
Temperatures looks set to rise further due to the falling away of sulfate aerosols, while there could be a additional temperature rises due to releases of other aerosols that have a net warming impact, such as black and brown carbon, which can increase dramatically as more wood burning and forest fires take place as industrial activity collapses.
Conclusion
The situation is dire and unacceptably dangerous, and the precautionary principle necessitates the danger to be acknowledged, while facilitating rapid, comprehensive and effective action to reduce the damage and to improve the outlook, where needed in combination with a Climate Emergency Declaration, as described in posts such as in this 2022 post and this 2025 post, and as discussed in the Climate Plan group.

The ClimatePlan by Sam Carana calls for implementation of sets of feebates, with fees imposed on sales of polluting products and the revenues from those fees used to fund rebates on cleaner alternatives. Sets of feebates are best implemented ASAP, separately and preferably locally, with disputes handled by Local People's Courts where randomly-chosen local residents deliver verdicts on whether policies confirm the weight of best-available science. Where needed, Climate Emergency Declarations can support progress.
Links
• Copernicus
• Copernicus
https://pulse.climate.copernicus.eu
• Climate Reanalyzer
https://climatereanalyzer.org
• ECMWF - European Centre for Medium-Range Weather Forecasts
https://charts.ecmwf.int
• NOAA - National Centers for Environmental Information - Global Time Series
• Climate Reanalyzer
https://climatereanalyzer.org
• ECMWF - European Centre for Medium-Range Weather Forecasts
https://charts.ecmwf.int
• NOAA - National Centers for Environmental Information - Global Time Series
https://www.ncei.noaa.gov/access/monitoring/climate-at-a-glance/global/time-series/globe/ocean/tavg/1/0/1850-2026
• NASA - GISS Surface Temperature Analysis (v4) - Analysis Graphs and Plots - custom plotter
https://data.giss.nasa.gov/gistemp/graphs_v4/customize.html
• NSIDC - National Snow and Ice Data Center - CIRES at the University of Colorado Boulder
https://nsidc.org
• Arctic and Antarctic Data archive System - National Institute of Polar Research - Academic Japan
https://ads.nipr.ac.jp/vishop/#/extent
• Kevin Pluck - sea ice visuals
https://seaice.visuals.earth
• Levi Cowan - tropicaltidbits.com
https://www.tropicaltidbits.com
• Leon Simons - Earth's Energy Imbalance
https://bsky.app/profile/leonsimons.com/post/3mwy3xgypts2y
• Nullschool
https://earth.nullschool.net
• Teleconnections: Atmospheric river carrying moisture to Antarctica
• NASA - GISS Surface Temperature Analysis (v4) - Analysis Graphs and Plots - custom plotter
https://data.giss.nasa.gov/gistemp/graphs_v4/customize.html
• NSIDC - National Snow and Ice Data Center - CIRES at the University of Colorado Boulder
https://nsidc.org
• Arctic and Antarctic Data archive System - National Institute of Polar Research - Academic Japan
https://ads.nipr.ac.jp/vishop/#/extent
• Kevin Pluck - sea ice visuals
https://seaice.visuals.earth
• Levi Cowan - tropicaltidbits.com
https://www.tropicaltidbits.com
• Leon Simons - Earth's Energy Imbalance
https://bsky.app/profile/leonsimons.com/post/3mwy3xgypts2y
• Nullschool
https://earth.nullschool.net
• Teleconnections: Atmospheric river carrying moisture to Antarctica
https://arctic-news.blogspot.com/2026/09/teleconnections-atmospheric-river-carrying-moisture-to-antarctica.html
• Sea-level contribution from Thwaites Glacier doubles in an observation-constrained ice-sheet model - by Mattia Poinelli et al.
https://www.nature.com/articles/s41561-019-0510-8
• Sea-level contribution from Thwaites Glacier doubles in an observation-constrained ice-sheet model - by Mattia Poinelli et al.
https://www.nature.com/articles/s41561-019-0510-8
discussed on facebook at
https://www.facebook.com/groups/arcticnews/posts/10164871312359679
• The Biochar Economy
https://www.facebook.com/groups/arcticnews/posts/10164871312359679
• The Biochar Economy
https://www.facebook.com/groups/biochar/permalink/234998409882683
https://geo-engineering.blogspot.com/2011/09/biochar-economy.html
https://biochareconomy.blogspot.com/2014/08/biochar-builds-real-assets.html
https://geo-engineering.blogspot.com/2011/09/biochar-economy.html
https://biochareconomy.blogspot.com/2014/08/biochar-builds-real-assets.html
• The Biochar group on facebook, created by Sam Carana May 29, 2011
https://www.facebook.com/groups/biochar
• Double Blue Ocean Event 2026-2027? - update June 2026
https://arctic-news.blogspot.com/2026/06/double-blue-ocean-event-2026-2027-update.html
• Double Blue Ocean Event (2026)
https://arctic-news.blogspot.com/p/double-blue-ocean-event.html
• Antarctic sea ice increasingly in danger (2026)
https://arctic-news.blogspot.com/2026/08/antarctic-sea-ice-increasingly-in-danger.html
• A Tale of Two Poles (2026)
https://arctic-news.blogspot.com/p/a-tale-of-two-poles.html
• Antarctica (2026)
https://arctic-news.blogspot.com/p/antarctica.html
• When Will We Die? (2019)
https://arctic-news.blogspot.com/2019/06/when-will-we-die.html
• Extinction (2016)
https://arctic-news.blogspot.com/p/extinction.html
• Transforming Society (2022)
https://arctic-news.blogspot.com/2022/10/transforming-society.html
• Climate Plan (2019)
https://arctic-news.blogspot.com/p/climateplan.html
• The Climate Plan by Sam Carana (2026)
https://www.facebook.com/groups/biochar
• Double Blue Ocean Event 2026-2027? - update June 2026
https://arctic-news.blogspot.com/2026/06/double-blue-ocean-event-2026-2027-update.html
• Double Blue Ocean Event (2026)
https://arctic-news.blogspot.com/p/double-blue-ocean-event.html
• Antarctic sea ice increasingly in danger (2026)
https://arctic-news.blogspot.com/2026/08/antarctic-sea-ice-increasingly-in-danger.html
• A Tale of Two Poles (2026)
https://arctic-news.blogspot.com/p/a-tale-of-two-poles.html
• Antarctica (2026)
https://arctic-news.blogspot.com/p/antarctica.html
• When Will We Die? (2019)
https://arctic-news.blogspot.com/2019/06/when-will-we-die.html
• Extinction (2016)
https://arctic-news.blogspot.com/p/extinction.html
• Transforming Society (2022)
https://arctic-news.blogspot.com/2022/10/transforming-society.html
• Climate Plan (2019)
https://arctic-news.blogspot.com/p/climateplan.html
• The Climate Plan by Sam Carana (2026)
• Climate Emergency Declaration (2023)
https://arctic-news.blogspot.com/p/climate-emergency-declaration.html
https://arctic-news.blogspot.com/p/climate-emergency-declaration.html


