Sunday, April 7, 2024

Oppenheimer’s legacy – Portents of a nuclear war on a burning planet

The MADNESS of NUCLEAR and CLIMATE HORROR
by Andrew Glikson

The 24-hour media news cycle clouds the minds of people, perpetrators and hapless victims alike, to the future dimension, whether that of future generations or of the natural world itself.


During the 20-21ˢᵗ centuries, as mean global temperature keeps rising toward 4°C, a failed brain neuron or a damaged computer chip can trigger a nuclear catastrophe, while the 24-hour media news cycle can blind humanity to the future. The conditions emerge where the world is largely taken over by the banality of evil, insane mass murders, fake news and artificial intelligence, lately camouflaged by glitzy Oscar-winning orgies attended by billionaires and celebrity actors, such as at the launch of the film Oppenheimer, where the 140 thousand incinerated victims and hibakusha survivors of the Hiroshima atomic bomb are completely ignored

The film, populated by nuclear scientists, decorated military officers and replete with romantic affairs, makes little reference to the looming road to a nuclear abyss herald by the clock of the atomic scientists. Thus “Oppenheimer does little to challenge the long history of glorifying the work of white men, and risks perpetuating the persistent, often reductive, portrayals of Japanese victims in Hiroshima and Nagasaki.

The world arsenal of 12,500 nuclear warheads, enough to terminate many advanced species on Earth, is hardly mentioned in the film, dominated by the world of good vs evil proclaimed by priests of god’s chosen nations, while the doomsday machine on which civilization spends $trillions out of the mouth of starving children.

It is a statistical impossibility that this arsenal may not be triggered, at least in part, by accident or design, such as has nearly-happened. The bloodsheds in Ukraine herald the onset of a rules-free world where anything is allowable, ultimately toward global death in the name of freedom.

Perched in front of fluorescent screens, oblivious to the unthinkable, the collective is mesmerized by the obscene untruths of the global media, portraying tribal massacres alternating with funeral insurance advertisements, national hubris and vacuous amusement.

How long would it take, if ever, for people to learn that the last thing politicians would tell them is the entire truth, even if they are aware of it.

Sane voices such as of Noam Chomsky and John Pilger are no longer heard.

It is not clear to what extent it worries too many people that the oncoming climate catastrophe and mass extinction of species have become statistically inevitable, as the idea that near -200,000 years of evolution may be eliminated belongs to the unthinkable. The idea may hardly enter into the minds of most decision makers, politicians and strategists.

The 24-hour media news cycle renders peoples’ minds oblivious to the future, whether of their offspring or of the natural world itself.

The biggest lie, conscious or unconscious, used by authorities which are supposed to protect life, is when they use the term “Future” as they repeatedly do, the very future they are betraying by what they are doing and by what they currently are not.


A/Prof. Andrew Y Glikson
Earth and climate scientist

Andrew Glikson
Books:
The Asteroid Impact Connection of Planetary Evolution
https://www.springer.com/gp/book/9789400763272
The Archaean: Geological and Geochemical Windows into the Early Earth
https://www.springer.com/gp/book/9783319079073
The Plutocene: Blueprints for a Post-Anthropocene Greenhouse Earth
https://www.springer.com/gp/book/9783319572369
The Event Horizon: Homo Prometheus and the Climate Catastrophe
https://www.springer.com/gp/book/9783030547332
Climate, Fire and Human Evolution: The Deep Time Dimensions of the Anthropocene
https://www.springer.com/gp/book/9783319225111
Evolution of the Atmosphere, Fire and the Anthropocene Climate Event Horizon
https://www.springer.com/gp/book/9789400773318
From Stars to Brains: Milestones in the Planetary Evolution of Life and Intelligence
https://www.springer.com/us/book/9783030106027
Asteroids Impacts, Crustal Evolution and Related Mineral Systems with Special Reference to Australia
https://www.springer.com/us/book/9783319745442
The Fatal Species: From Warlike Primates to Planetary Mass Extinction
https://www.springer.com/gp/book/9783030754679
The Trials of Gaia. Milestones in the evolution of Earth with reference to the Antropocene
https://www.amazon.com.au/Trials-Gaia-Milestones-Evolution-Anthropocene/dp/3031237080


Friday, March 22, 2024

Atlantic ocean heat threatens to unleash methane eruptions

The image below shows that the monthly Atlantic surface temperature anomaly in February 2024 was 1.176°C when compared to a 1951-1980 base.

[ click on images to enlarge ]

The image below shows that the monthly Atlantic surface temperature anomaly in February 2024 was 1.435°C when compared to a 1901-2000 base. 


The difference illustrates the importance of selecting a base to calculate anomalies from. The anomaly indicates how much heat has accumulated in the Atlantic, and it is even larger for February 2024 when using a genuinely pre-industrial base, as discussed earlier.

The images also highlight the potential for the slowing down of the Atlantic meridional overturning circulation (AMOC) to contribute to more heat accumulating at the surface of the Atlantic Ocean.

As temperatures rise, many feedbacks are kicking in with greater ferocity, including increased stratification of oceans, loss of sea ice, loss of reflectivity of clouds and increased freshwater due to stronger melting of sea ice and glacial ice, due to heavier runoff from land and rivers and due to changes in ocean circulation.

While this may look to cause less ocean heat to reach the Arctic Ocean at the moment, the result is that a huge amount of ocean heat is accumulating in the North Atlantic that threatens to abruptly move into the Arctic Ocean. The danger is that an influx of ocean heat can cause large amounts of methane to erupt from the seafloor of the Arctic Ocean. 

The inset on the top image illustrates that, as people's emissions raise the temperature, this rise can strengthen wind, evaporation, ocean currents and rainfall locally, resulting in greater potential for a lid to form and spread at the surface of the North Atlantic. As temperatures rise and winds strengthen, more evaporation can occur in one place and more rain can then fall further down the path of the Gulf Stream, i.e. an ocean current that extends into the Arctic Ocean, as part of AMOC. This rain further contributes to the freshwater accumulation at the surface of the North Atlantic.

In the video below, Guy McPherson discusses a recent study by Marilena Oltmanns et al. on some of these issues.


This page further discusses formation of a cool freshwater lid at the surface of the North Atlantic and the contribution to this of Jet Stream changes. The image below shows that the Jet Stream reached speeds as high as 455 km/h or 283 mph north of Washington on February 18, 2024 03:00 UTC, with Instantaneous Wind Power Density as high as 387.5 kW/m².

From earlier post Blue Ocean Event 2024?

A huge amount of ocean heat is accumulating in the North Atlantic and threatens to abruptly move into the Arctic Ocean. The danger is that, due to strong wind along the path of the Gulf Stream, huge amounts of ocean heat will abruptly get pushed into the Arctic Ocean, with the influx of ocean heat causing destabilization of hydrates contained in sediments at the seafloor of the Arctic Ocean, resulting in eruptions of huge amounts of methane. 

Strong hurricanes can significantly add to the danger. More hurricanes are forecast for the 2024 Atlantic hurricane season than during 1950-2020, as illustrated by the image below. 


Many of the dangers have been discussed before, e.g. the danger that sea currents in the Arctic Ocean will change direction, in this 2017 post

Arctic sea ice thickness warning

The compilation image below shows Arctic sea ice on March 28, 2024. The satellite image (left) may indicate extensive sea ice, but clouds can obscure things. The other image (right) indicates that sea ice in a large area from the Laptev Sea down to the North Pole may be very thin.


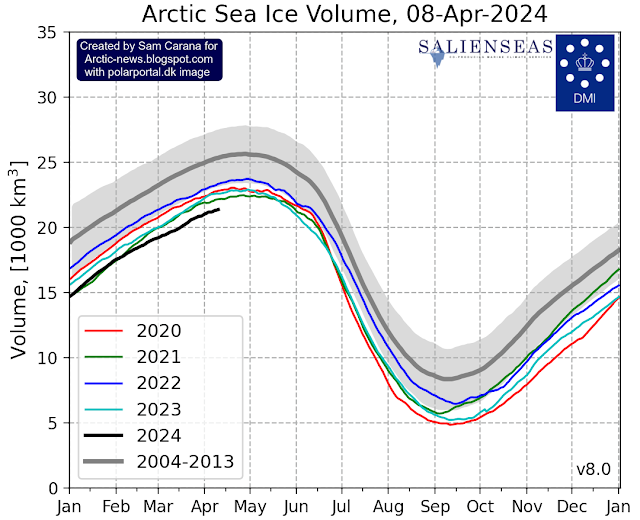
The image below illustrates the decline of Arctic sea ice volume over the years.


The images above and below show that Arctic sea ice volume has recently been the lowest on record for the time of year.


Given that Arctic sea ice currently is still relatively extensive, this low volume indicates that sea ice is indeed very thin, which must be caused by ocean heat melting sea ice from below, since little or no sunshine is yet reaching the Arctic at the moment and air temperatures are still far below freezing point, so where ocean heat may be melting sea ice away from below, a thin layer of ice will quickly be reestablished at the surface. 

This situation looks set to dramatically change over the next few months, as air temperatures will rise and as more ocean heat will reach the Arctic Ocean. Moreover, as illustrated by the map below, much of the thicker sea ice is located off the east coast of Greenland. This sea ice and the purple-colored sea ice can be expected to melt away quickly with the upcoming rise in temperatures over the next few months.


Climate Emergency Declaration

The situation is dire and the precautionary principle calls for rapid, comprehensive and effective action to reduce the damage and to improve the situation, as described in this 2022 post, where needed in combination with a Climate Emergency Declaration, as discussed at this group.


Links

• Climate Reanalyzer

• Pre-industrial
https://arctic-news.blogspot.com/p/pre-industrial.html

• Cold freshwater lid on North Atlantic
https://arctic-news.blogspot.com/p/cold-freshwater-lid-on-north-atlantic.html

• European summer weather linked to North Atlantic freshwater anomalies in preceding years - by Marilena Oltmanns et al.
https://wcd.copernicus.org/articles/5/109/2024/wcd-5-109-2024-discussion.html
discussed at facebook at: 
https://www.facebook.com/groups/arcticnews/posts/10161330866254679

• Science Snippets: Arctic Sea Ice Affects European Summers, Marine Life, and All Life on Earth - by Guy McPherson
https://www.youtube.com/watch?v=X09vtWNDuDw

• nullschool 
https://earth.nullschool.net

• Jet Stream
https://arctic-news.blogspot.com/p/jet-stream.html

• Extended range forecast of Atlantic seasonal hurricane activity and landfall strike probability for 2024 - by Philip Klotzbach et al.
https://tropical.colostate.edu/forecasting.html
discussed on facebook at:
https://www.facebook.com/groups/arcticnews/posts/10161346323759679

• Arctic Ocean Feedbacks
https://arctic-news.blogspot.com/2017/01/arctic-ocean-feedbacks.html

• NASA Worldview satellite images
https://worldview.earthdata.nasa.gov

• University of Bremen - Arctic sea ice
https://seaice.uni-bremen.de/start

• Danish Meteorological Institute - Arctic sea ice volume and thickness


Monday, March 18, 2024

Tragedy set to unfold in Tropics (update)

The temperature in the Tropics (23.5°S-23.5°N, 0-360°E) reached a new record high on March 13, 2024. The image below shows the situation over the years through March 13, 2024, when the average daily surface air temperature was 26.9°C and 1.4°C above 1979-2000 (black line is 2024).


The previous record high temperature was reached on April 24, 2016, when it was 26.8°C, and 1°C above 1979-2000 (grey line is 2016). 

The annual maximum temperature in the Tropics is typically reached in April, but very high temperatures were also reached in early May 2023 (orange line is 2023), so the temperature this year may well rise even higher over the next two months.

Meanwhile, we're still in El Niño, according to NOAA and as illustrated by the image on the right.

The image below shows the monthly temperature anomalies over the past few years through February 2024. 


Note that the anomalies in the two above images are calculated from different bases. When calculated from a pre-industrial base, anomalies will be higher.

These high temperatures threaten to cause widespread loss of life of people, livestock and wildlife, crop failure and ecosystem collapse in the tropics.

Climate Emergency Declaration

The situation is dire and the precautionary principle calls for rapid, comprehensive and effective action to reduce the damage and to improve the situation, as described in this 2022 post, where needed in combination with a Climate Emergency Declaration, as discussed at this group.


Links

• Climate Reanalyzer
https://climatereanalyzer.org

• Pre-industrial
https://arctic-news.blogspot.com/p/pre-industrial.html

• Extinction
https://arctic-news.blogspot.com/p/extinction.html

• Climate Plan
https://arctic-news.blogspot.com/p/climateplan.html

• Climate Emergency Declaration
https://arctic-news.blogspot.com/p/climate-emergency-declaration.html

Earlier versions of this post are discussed at facebook at:

Friday, March 15, 2024

CO2 rise is accelerating

On March 15, 2024, the daily average carbon dioxide (CO₂) at Mauna Loa, Hawaii, was 427.93 parts per million (ppm), as illustrated by the image below, adapted from NOAA. 

This is the highest daily in situ average in the NOAA record at Mauna Loa, which is the more remarkable since the annual CO₂ maximum is typically reached in May, so even higher values are likely to be reached over the next few months. 

The image below, adapted from NOAA, shows 31 days of CO₂ at Mauna Loa, Hawaii. The image shows that a daily mean CO₂ of 427.93 ppm was recorded on March 15, 2024, and that many of the hourly averages that were recorded in April 2024 were higher than 430 ppm.

The image below, adapted from the Scripps Institution of Oceanography, shows that CO₂ at Mauna Loa was 427.80 ppm on March 14, 2024. The background shows six months of CO₂ ending March 15, 2024. 

The image below, adapted from NOAA, shows that the monthly mean CO₂ at Mauna Loa in March 2024 was 425.38 ppm, a growth of 4.39 ppm compared to March 2023. 

The image below, adapted from NOAA, shows that the annual CO₂ growth at Mauna Loa in 2023 was 3.36 ppm, the highest annual growth on record.

Temperature rise

The February 2024 global surface temperature is 1.75°C or 3.15°F when compared to a base of 1886-1915, i.e. a 30-year period centered around the year 1900, as illustrated by the image below. The image shows part (from 1980) of a graph based on NASA Land+Ocean data from January 1880 through February 2024, with the black squares showing the raw monthly data. 

The rise is as large as 2.74°C or 3.132°F when compared to a pre-industrial base and when also taking into account ocean air temperatures and higher polar anomalies, as indicated in the bright yellow inset on the image below. 

Lowess smoothing (red line, 1 year window) highlights variability between years and the huge rise that has occurred recently, which is partly caused by variability such as associated with El Niño. 

The red line also highlights the potential for an even larger rise to come soon, as feedbacks and further developments start to kick in with greater ferocity, contributing to non-linear and abrupt temperature rise, as discussed in earlier posts such as this one and this one

The use of an early date for a pre-industrial base is discussed at the pre-industrial page and is supported by recent analysis of sponges collected in the Caribbean, illustrated by the image below.

[ from earlier post ]

Other recent research debunks the idea that Earth’s surface (across land and sea) has experienced really hot temperatures over the last two billion years. Instead, it shows that Earth has had a relatively stable and mild climate. This makes the threat of a huge temperature rise over the next few years even more menacing. 

The temperature is rising most rapidly in the Arctic. Loss of sea ice threatens to accelerate the temperature rise in the Arctic even more, and cause destabilization of methane hydrates at the bottom of the Arctic Ocean and thawing of permafrost on land, resulting in massive releases of greenhouse gases, further acceleration of the temperature rise and widespread extinction of species (including humans) as early as in the year 2026.

Clouds Tipping Point

The image below illustrates that a polynomial trend (red) can better capture the acceleration in the rise in CO₂ concentration in the atmosphere than a linear trend (blue). 

The red polynomial trend also illustrates how rising CO₂ can cause the clouds tipping point at 1200 ppm to be crossed before 2100, i.e. earlier than anticipated in IPCC models (inset).

Moreover, the clouds tipping point could be crossed much earlier when also taking into account methane. Monthly methane was about 1960 parts per billion (ppb) recently at Mauna Loa, Hawaii, as illustrated by the image below.


A methane concentration of 1960 ppb corresponds, at a Global Warming Potential (GWP) of 200, with a carbon dioxide equivalent (CO₂e) of 392 ppm. Together with the above daily average CO₂ concentration of 427.93 ppm this adds up to a joint CO₂e of 819.93 ppm, i.e. only 380.07 ppm away from the clouds tipping point (at 1200 ppm CO₂e) that on its own could raise the global temperature by 8°C.

This 380.07 ppm CO₂e could be added almost immediately by a burst of seafloor methane less than the size of the methane that is currently in the atmosphere (about 5 Gt). There is plenty of potential for such an abrupt release, given the rising ocean heat and the vast amounts of methane present in vulnerable sediments at the seafloor of the Arctic Ocean, as discussed in earlier posts such as this one.

Furthermore, nitrous oxide is also rising and there are additional elements that could further speed up the temperatures rise, as discussed at the Extinction page, which shows that, altogether, there is the potential for a temperature rise of well over 18°C by 2026.

A 2018 study (by Strona & Bradshaw) indicates that most life on Earth will disappear with a 5°C rise. Humans, who depend for their survival on many other species, will likely go extinct with a 3°C rise, as illustrated by the image below, from an earlier post.


Environmental crimes

The accelerating growth in carbon dioxide indicates that politicians have failed and are failing to take adequate action. 

Current laws punish people for the most trivial things, while leaving the largest crime one can imagine unpunished: planetary omnicide!

[ from earlier post ]

The image below is from the post Planetwide Ecocide - The Crime Against Life on Earth, by Andrew Glikson


If we accept that crimes against humanity include climate crimes, then politicians who inadequately act on the unfolding climate catastrophe are committing crimes against humanity and they should be brought before the International Criminal Court in The Hague, the Netherlands.

[ image from earlier post ]

Meanwhile, Belgium has recognised ecocide as international crime and the EU Parliament has voted to criminalize the most serious cases of ecosystem destruction. 

Climate Emergency Declaration

The situation is dire and the precautionary principle calls for rapid, comprehensive and effective action to reduce the damage and to improve the situation, as described in this 2022 post, where needed in combination with a Climate Emergency Declaration, as discussed at this group.


Links

• NOAA - Carbon Cycle Gases - Mauna Loa, Hawaii, United States
https://gml.noaa.gov/dv/iadv/graph.php?code=MLO&program=ccgg&type=ts

• Scripps Institution of Oceanography
https://keelingcurve.ucsd.edu

• NOAA - Weekly average CO2 at Mauna Loa 
https://gml.noaa.gov/ccgg/trends/weekly.html

• NOAA - annual mean carbon dioxide growth rates for Mauna Loa
https://gml.noaa.gov/ccgg/trends/gr.html

• NOAA - greenhouse gases at Mauna Loa 

• Belgium becomes first in EU to recognise ecocide as international crime 
https://www.facebook.com/groups/climateplan/posts/8012665172096853

• ‘Revolutionary’: EU Parliament votes to criminalise most serious cases of ecosystem destruction 

• How long do we have?
https://arctic-news.blogspot.com/2019/04/how-long-do-we-have.html


• Blue Ocean Event 2024?

• Potential temperature trends

• Co-extinctions annihilate planetary life during extreme environmental change, by Giovanni Strona and Corey Bradshaw (2018)
https://www.nature.com/articles/s41598-018-35068-1

• NASA GISTEMP - Temperature analysis Plots
https://data.giss.nasa.gov/gistemp/graphs_v4/customize.html

• Tragedy set to unfold in tropics 
https://arctic-news.blogspot.com/2024/02/tragedy-set-to-unfold-in-tropics.html

• 300 years of sclerosponge thermometry shows global warming has exceeded 1.5 °C - by Malcolm McCulloch et al. (2024)
https://www.nature.com/articles/s41558-023-01919-7
discussed at facebook at: 
https://www.facebook.com/groups/arcticnews/posts/10161250170389679

• Oxygen isotope ensemble reveals Earth’s seawater, temperature, and carbon cycle history - by Terry Isson et al.