Thursday, October 26, 2023

A climate of the unthinkable on a burning Earth

by Andrew Glikson

“The climate is an angry beast and we are poking at it with sticks” - Wallace Smith Broecker

Having turned a deaf ear to the basic laws of nature, ignoring the essential lessons from climate science, the powers that be have no idea, nor do they appear to care about, the rate and scale of the calamity life on Earth is facing.

Global civilization having effectively replaced the United Nations with the United States and other super powers, having built a veritable nuclear doomsday machine, enhancing the military-industrial complex and atmosphere-poisoning fossil fuel corporations, preoccupied with arming proxy states, allowing regional blood baths to enhance the arms trade, the powers that be are allowing the demise of human civilization as well a myriad of intelligent and beautiful animal and bird species.

Global temperature (relative to 1880-1920 mean for each month) for the 1997-98, 2015-16 and 2023-24
El Ninos. The impact of El Nino on global temperature usually peaks early in the year (El Nino Peak
Year) following the year in which the El Nino originated. Credit: James Hansen et al. (Oct. 2023)

Nowadays major untruths are propagated by a media subservient to the powers that be.
  • With the CO₂ level reaching 418.51 ppm at a rate of ~2.5 ppm/year and methane CH₄ level reaching 1917.1 ppb at a rate of near-12 ppb per year, greenhouse gas rises are exceeding any in recent geological history, representing the most severe atmospheric crisis since the asteroid impact which killed the dinosaurs 66 million years ago. Oblivious to the physical laws on which climate science is based and to the time factor of the impending climate crisis, setting artificial targets such as “1.5°C by 2030” or “2°C by 2050”, the powers that be may not be aware of what life on planet Earth is facing.
  • As if proposed limits on domestic pollution are meaningful to the arrest of global warming despite continuing mining, export and combustion of fossil fuels, greenhouse gases disperse through the atmosphere regardless of where the fossil fuel is burnt. As conveys by McNeill: “The government denies responsibility for emissions created by the vast amounts of coal and gas Australia exports overseas as one of the world’s largest fossil fuel producers, and has flatly ruled out any discussion on banning new fossil fuel projects”.
  • While ongoing combustion of fossil fuels is raising greenhouse gas concentration at a rate unprecedented in the geological record, current global heating being a self-amplifying process, the utilization of clean energy: solar, wind, hydropower and thermal power cannot by itself stem global warming, now rising above 420 ppm CO₂, well above the 180-280 ppm range of the preceding glacial-interglacial cycles. Such a high CO₂ level, compared to that which existed in the Miocene before 5.3 million years ago when mean global temperature was about ~4°C, has risen within the last century at a rate to which fauna and flora can hardly adjust.
Global energy-related greenhouse gas emissions 2000-2022, adapted from EIA ]

Cover-up, censorship and suppression of environmental and climate science in governments, industry and universities occur in countries professing freedom of information policies. One of the latest revelations is the story of Dana Bergstrom.

Nowadays, as bombs keep falling, children are dying, heads of governments jet around the world genuflecting to each other, signing arms deals, uttering honey words, while the corporate media discusses their official dinner menus, they reach no solutions for the worsening humanitarian crises, nor for the future of life on Earth.


A/Prof. Andrew Y Glikson
Earth and Paleo-climate scientist


Andrew Glikson
Books:
The Asteroid Impact Connection of Planetary Evolution
https://www.springer.com/gp/book/9789400763272
The Archaean: Geological and Geochemical Windows into the Early Earth
https://www.springer.com/gp/book/9783319079073
The Plutocene: Blueprints for a Post-Anthropocene Greenhouse Earth
https://www.springer.com/gp/book/9783319572369
The Event Horizon: Homo Prometheus and the Climate Catastrophe
https://www.springer.com/gp/book/9783030547332
Climate, Fire and Human Evolution: The Deep Time Dimensions of the Anthropocene
https://www.springer.com/gp/book/9783319225111
Evolution of the Atmosphere, Fire and the Anthropocene Climate Event Horizon
https://www.springer.com/gp/book/9789400773318
From Stars to Brains: Milestones in the Planetary Evolution of Life and Intelligence
https://www.springer.com/us/book/9783030106027
Asteroids Impacts, Crustal Evolution and Related Mineral Systems with Special Reference to Australia
https://www.springer.com/us/book/9783319745442
The Fatal Species: From Warlike Primates to Planetary Mass Extinction
https://www.springer.com/gp/book/9783030754679
The Trials of Gaia. Milestones in the evolution of Earth with reference to the Antropocene
https://www.amazon.com.au/Trials-Gaia-Milestones-Evolution-Anthropocene/dp/3031237080


Friday, October 13, 2023

Temperature rise - September 2023 and beyond

The above image, adapted from NASA and the image below, adapted from Climate Reanalyzer and using the same baseline, illustrate the September 2023 temperature anomaly.


September 2023 was the month with the highest temperature anomaly on record. What contributed to this?

El Niño
 

The temperature rose about 0.5°C from November 2022 to March 2023, and this occurred at a time when we were not even in an El Niño yet, as illustrated by the above image, from an earlier post. Below is an updated image, from January 1950 to September 2023, adapted from NOAA

[ click on images to enlarge ]
[ click on images to enlarge ]
The current El Niño is still strengthening, as illustrated by the image on the right, adapted from IRI.

Further contributors

There are further reasons why the temperature can be expected to keep rising beyond September 2023.

The number of sunspots has been higher than predicted and looks set to keep rising above predicted levels until July 2025, as discussed here.

The eruption of the submarine volcano near Tonga in January 2022 caused a lot of water vapor to reach high up into the atmosphere and this may still contribute to the temperature rise, as discussed here.

Aerosols that have a cooling effect, such as dust and sulfates (SO₄), are also important. As fossil fuel is burned, sulfates are co-emitted. Since they pollute the air, measures have been taken and are being taken to reduce them, e.g. in shipping, and this has pushed up the temperature rise. Meanwhile, cooling aerosols such as sulfates are still high. As illustrated by the image below, adapted from nullschool.net, SO₄ was as high as 8.621 τ at the green circle on October 6, 2023, at 07:00 UTC. In future, SO₄ could fall dramatically, e.g. in case of a sudden economic collapse, reducing the aerosol masking effect rapidly and abruptly causing a substantial rise in temperature.


After little change in the Antarctic sea ice extent graph for decades, extent loss was dramatic in 2022 and even more dramatic in 2023, as less and less sunlight was getting reflected back into space and instead was getting absorbed by the water of the Southern Ocean, as illustrated by the image below, adapted from NSIDC.
Sea ice retreat comes with loss of albedo, i.e. loss of the amount of sunlight reflected back into space, resulting in more heat getting absorbed in the Southern Ocean, making it a self-reinforcing feedback loop. Clouds constitute another self-reinforcing feedback loop; a warmer Southern Ocean comes with fewer bright clouds, further reducing albedo, as discussed here and here. For decades, there still were many lower clouds over the Southern Ocean, reflecting much sunlight back into space, but these lower clouds have been decreasing over time, further speeding up the amount of sunlight getting absorbed by the water of the Southern Ocean, and this 'pattern effect' could make a huge difference globally, as a recent study points out. Emissivity is a further factor; open oceans are less efficient than sea ice when it comes to emitting in the far-infrared region of the spectrum (feedback #23 on the feedbacks page). 


The above image was created by Zach Labe with NSIDC data (Arctic + Antarctic) for each year from 1979 to 2023 (satellite-era; NSIDC, DMSP SSM/I-SSMIS). The image illustrates that global sea ice extent  recently reached the largest anomaly in the satellite record. Anomalies are calculated using a 5-day running mean from a climatological baseline of 1981-2010. 2016 is shown with a yellow line. 2023 is shown using a red line (updated 10/16/2023).

In the video below, Paul Beckwith discusses the importance of loss of sea ice at around -60° (South).


As said, there are many factors behind the temperature increase around latitude -60° (South). As Paul mentions, this latitude receives a lot of sunlight around the year. Therefore, it is not surprising that, as oceans continue to heat up, there is huge loss of sea ice at this latitude, as well as loss of lower clouds, while open oceans are additionally less efficient than sea ice when it comes to emitting in the far-infrared region of the spectrum. The image below, adapted from NASA, shows a white band around -60° (South), indicating that the Southern Ocean has long been colder there than elsewhere, but has recently started to catch up with the global temperature rise.


The above image also illustrates that anomalies are highest in the Arctic, narrowing the temperature difference between the Arctic and the Tropics, with the air flow slowing down accordingly. 

[ image adapted from Copernicus ]
This in turn changes the Jet Stream and the Polar Vortex, resulting in blocking patterns that can, in combination with rising temperatures, strongly increase the frequency, intensity, duration and area coverage of extreme weather events such as storms and lightning, heatwaves and forest fires.

Forest fires in Canada have been releasing massive amounts of emissions that push up the temperature, including greenhouse gases such as carbon dioxide, warming aerosols such as black carbon & brown carbon and NMVOC (non-methane volatile organic carbon) and carbon monoxide that reduce the availability of hydroxyl, resulting in more methane and ozone in the atmosphere. 

[ NH sea surface temperature anomaly ]
At the same time, slowing down of the Atlantic Meridional Ocean Current (AMOC) can result in more ocean heat accumulating at the surface of the North Atlantic, as illustrated by the image on the right, from an earlier post.

As temperatures rise, increased meltwater runoff from Greenland and more icebergs moving south, in combination with stronger ocean stratification and stronger storms over the North Atlantic, can also cause a freshwater lid to form at the surface of North Atlantic that can at times enable a lot of hot water to get pushed abruptly underneath this lid toward the Arctic Ocean. The danger is that more heat will reach the seafloor and destabilize methane hydrates contained in sediments at the seafloor of the Arctic ocean. 

Ominously, very high methane levels continue to be recorded at Barrow, Alaska, as illustrated by the image below, adapted from NOAA.

The next few months will be critical as Arctic sea ice is sealing off the Arctic Ocean from the atmosphere, trapping heat underneath the ice and making it harder for ocean heat to get transferred from the Arctic Ocean to the atmosphere above the Arctic. Furthermore, sea ice is very thin, reducing the latent heat buffer that could otherwise have consumed ocean heat. 

The next danger is that the thin Arctic sea ice will rapidly retreat early next year as a warming Arctic Ocean will transfer more heat to the atmosphere over the Arctic, resulting in more rain and more clouds in the atmosphere over the Arctic, speeding up sea ice loss and further pushing up the temperature rise over the Arctic, as discussed at the feedbacks page, which also discusses how less Arctic sea ice can push up temperatures through the emissivity feedback. As temperatures rise over the Arctic, permafrost on land also threatens to thaw faster, threatening to cause huge releases of greenhouse gases, including carbon dioxide, methane and nitrous oxide. 


Meanwhile, emissions of greenhouse gases keep rising, further pushing up the temperature, as illustrated by the image below, from an earlier post.
  
Global energy-related greenhouse gas emissions 2000-2022, adapted from EIA ]
In the video below, Guy McPherson describes how temperature rise, loss of habitat and meltdown of nuclear power facilities each could result in rapid extinction of humans and many other species.


There are numerous further feedbacks that can accelerate the temperature rise and tipping points that can get crossed and cause even more abrupt rise of the temperature. One of these is the clouds tipping point that in itself can cause a temperature rise of 8°C, as discussed here.

Further feedbacks are also discussed at the Extinction page.  One further feedback is water vapor. A warmer atmosphere holds more water vapor, at a rate of 7% for each Degree Celsius the temperature rises. As temperatures keep rising, ever more water vapor will be sucked up by the atmosphere. This will also cause more droughts, reducing the ability of land to sustain vegetation and provide soil cooling through shading and through evaporation and formation of lower clouds, as discussed here. More water vapor in the atmosphere will also speed up the temperature rise because water vapor is a potent greenhouse gas.

The fact that such tipping points and feedbacks occur as greenhouse gas levels reach certain levels and as the temperature rise makes it critical to assess how fast greenhouse gas levels could rise and by how much the temperature has already risen. 

NASA data up through September 2023

The image below, adapted from NASA, shows that the September 2023 NASA Land+Ocean temperature was 1.78°C higher than it was in September 1923. The anomaly is 1.74°C when compared to a base centered around the year 1900 (1885-1915). The 1.74°C anomaly can be adjusted by 0.99°C to reflect a pre-industrial base, air temperature and higher polar anomalies (as shown in the box on the bottom right of the image), adding up to a potential anomaly of 2.73°C. 

[ click on images to enlarge ]
Indeed, earlier analysis such as discussed here, points out that the temperature may already have risen by more than 2°C (compared to pre-industrial) in 2015, when politicians pledged at the Paris Agreement to take action to combat the temperature rise to prevent this from happening. 

Blue: Polynomial trend based on Jan.1880-Sep.2023 data. 
Magenta: Polynomial trend based on Jan.2010-Sep.2023 data.
The above image is created with NASA Land+Ocean monthly mean global temperature anomalies vs 1885-1915, adjusted by 0.99°C to reflect ocean air temperature, higher polar anomalies and a pre-industrial base, and has trends added.  

Alarms bells have been sounding loud and clear for a long time, as discussed in posts such as this one, warning that the temperature could rise by more than 3°C by 2026. The above magenta graph shows how this could occur as early as next year (end 2024).

[ image from earlier post ]
[ image from the Extinction page ]
The above image illustrates the latent heat tipping point - estimated to correspond with a sea surface temperature anomaly of 1°C above the long term average (1901-1930 on the above image) - to get crossed and the seafloor methane tipping point - estimated to correspond with a sea surface temperature anomaly of 1.35°C - to get reached, as discussed in earlier posts such as this one, .

A Blue Ocean Event could occur as the latent heat and seafloor methane tipping points get crossed, and the ocean temperature keeps rising, as huge amounts of methane get released in the Arctic, as ever more heat keeps reaching and destabilizing methane hydrates contained in sediments at the seafloor of the Arctic Ocean, as discussed in many earlier posts such as this one.

Seafloor methane is one of many elements that could jointly cause a temperature rise of over 10°C, in the process causing the clouds tipping point to get crossed that can push up the temperature rise by a further 8°C, as illustrated by the image on the right, from the extinction page.

Conclusion

The precautionary principle should prevail and the looming dangers should prompt people into demanding comprehensive and effective action to reduce the damage and to improve the situation. 

To combat rising temperatures, a transformation of society should be undertaken, along the lines of this 2022 post in combination with a declaration of a climate emergency.


Links

• NASA - global maps

• NOAA - ENSO and Temperature bars

• The International Research Institute for Climate and Society, Columbia University Climate School
https://iri.columbia.edu/our-expertise/climate/forecasts/enso/current/?enso_tab=enso-sst_table

• Nullschool.net

• NSIDC - sea ice graph

• Zach Labe - Global sea ice - extent, concentration, etc.

• NASA - zonal means
https://data.giss.nasa.gov/gistemp/zonal_means

• Copernicus - Northern Hemisphere wildfires: A summer of extremes
https://atmosphere.copernicus.eu/northern-hemisphere-wildfires-summer-extremes

• NOAA - Barrow Atmospheric Baseline Observatory, United States
https://gml.noaa.gov/dv/iadv/graph.php?code=BRW&program=ccgg&type=ts

• Paul Beckwith - Accelerated Global Warming from Antarctic Sea Ice Collapse: Albedo, Latitude, Snow Cover on Ice…
https://www.youtube.com/watch?v=-5P1W4TrczQ

• Guy McPherson - College of Complexes Presentation (with Improved Audio) 

• NASA custom plots
https://data.giss.nasa.gov/gistemp/graphs_v4/customize.html

• Transforming Society


Sunday, September 24, 2023

September 2023, highest anomaly on record?


The above image shows the temperature in 2023 as a bold black line, up to September 22, 2023, with the temperature reaching an anomaly of 1.12°C above the 1979-2000 mean for that day.


The above image shows the temperature anomaly from the 1979-2000 mean. In blue are the years 1979-2022 and in black is the year 2023 up to September 25, 2023. A trend is added in pink based on 2023 data. 

[ click on images to enlarge ]
Note that 1979-2000 isn't pre-industrial, the anomaly from pre-industrial is significantly higher. 

It looks like September 2023 will be the month with the highest temperature anomaly on record and the year 2023 will be the hottest year on record. 

The question is whether temperatures will keep rising. The current El Niño is still strengthening, as illustrated by the image on the right, adapted from IRI, and there is more to be taken into account. 


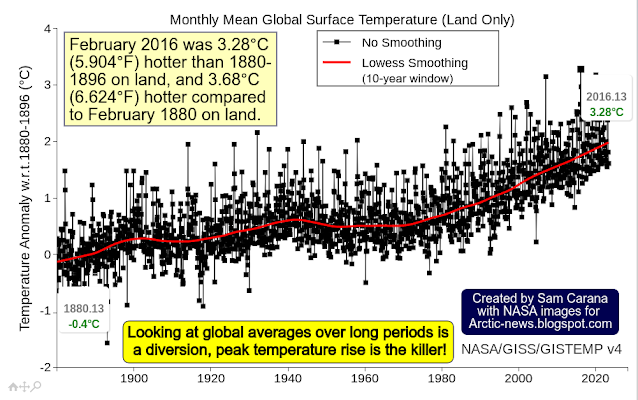
Until now, February 2016 has been the hottest month on record. The above image, from an earlier post, shows that February 2016 was 3.28°C (5.904°F) hotter than 1880-1896 on land, and 3.68°C (6.624°F) hotter compared to February 1880 on land. Note that 1880-1896 is not pre-industrial either and that sustained anomalies higher than 3°C are likely to drive humans into extinction. The image adds a poignant note: Looking at global averages over long periods is a diversion, peak temperature rise is the killer!

The situation raises questions. How much has the temperature risen? Will the temperature keep rising? What can be done about it? How can these questions best be answered?

The Paris Agreement mandate


During the UN Climate Change Conference scheduled to be held from November 30 to December 12, 2023, in Dubai, United Arab Emirates, the first Global Stocktake of the implementation of the Paris Agreement will be concluded.

The 2015 Paris Agreement mandate: Holding the increase in the global average temperature to well below 2°C above pre-industrial levels and pursuing efforts to limit the temperature increase to 1.5°C above pre-industrial levels by undertaking rapid reductions in emissions in accordance with best available science.

Many assume that the temperature rise will only threaten to cross 1.5°C above pre-industrial in the second half of this century and that by that time action will have stopped the temperature from rising, with the idea that an increase in carbon sequestration could make up for remaining emissions and avoid dangerous climate change. 

The question is whether such assumptions and decisions are indeed based on best available science, as opposed to political whim. Indeed, politicians are vulnerable to collusion with lobbyists feeding suggestions that there was a carbon budget to divide among polluters to enable polluters to keep polluting for decades to come. Local People's Courts can best rule on such questions, after taking a closer look at points such as the following: 

  • Rise from pre-industrial - While many politicians keep pushing the idea that 1.5°C above pre-industrial hasn't been crossed yet, we may already have crossed 2°C above pre-industrial, as discussed in this analysis.

  • Policy choices - emission reductions are best achieved early, rather than late. Yet, many politicians keep supporting fuel (fossil fuel and biofuels) and envisage burning of fuel to continue well beyond 2050 (combined with BECCS). Instead, when taking into account damage to health and the environment, and the danger of runaway temperature rise, it should be clear that better policies must be implemented soon, such as local feebates, to support better methods and technologies such as biochar, heat pumps and eVTOL air taxis. 

  • Rising emissions - Politicians claim that merely stating to aim for net-zero emissions will suffice to reduce emissions, whereas the evidence shows that energy-related greenhouse gas emissions have started to grow again, following minor Covid lockdown-related reductions in 2020, as illustrated by the image below, from an earlier post
[ Global energy-related greenhouse gas emissions 2000-2022, adapted from EIA ]
  • Carbon sink loss - Carbon sinks have long been taking carbon out of the atmosphere, but they are struggling and many may turn from sinks into sources and instead add carbon to the atmosphere. In 2023, nearly 2bn tons of carbon is estimated to have already gone up into the atmosphere in Canada up to now due to forest fires, far exceeding annual emissions tied to Canada’s economy (i.e. 670m tons). As temperatures rise, trees become more vulnerable to diseases and insects such as bark beetles. A 2020 study shows that at higher temperatures, respiration rates continue to rise in contrast to sharply declining rates of photosynthesis. Under business-as-usual emissions, this divergence elicits a near halving of the land sink strength by as early as 2040. As temperatures rise, soils and vegetation will lose moisture to the atmosphere. The Land Evaporation Tipping Point can get crossed locally when water is no longer available locally for further evapotranspiration from the soil and vegetation, with the rise in land surface temperatures accelerating and vegetation decaying accordingly. Higher temperatures result in more extreme weather events, such as fires, droughts, storms, flooding and erosion, that can all contribute to further decrease the terrestrial carbon sink. The ocean is also struggling as a carbon sink, in part because increased river runoff and meltwater lowers alkalinity levels. Furthermore, warmer water holds less oxygen and is becoming more stratified and thus less able to supply nutrients to help plankton grow and store carbon

  • Hydroxyl loss - There is a danger that hydroxyl, the main way that methane gets broken down in the atmosphere, is declining or getting overwhelmed by the rise in methane, as described here.

  • Heat sink loss - This recent study and this one warn that AMOC (the Atlantic meridional overturning circulation) is slowing down faster than expected. A recent post warns that this can contribute to more hot water accumulating in the North Atlantic, as opposed to moving to greater depth. The post also warns that, as temperatures rise, less heat gets stored in oceans, because stratification increases and more heat can get transferred from oceans to the atmosphere as sea ice disappears. There also are indications that, over time, proportionally more heat is remaining in the atmosphere, while less heat gets stored on land. All this results in a hotter atmosphere. 
     
  • Albedo loss - Loss of sea ice, loss of snow cover and warming oceans causing fewer bright clouds combine to reflect less sunlight back into space, as discussed here and here
  • [ Two out of numerous feedbacks ]
    Feedbacks - Important also is the accelerating rate of change. In many respects, we're in uncharted territory and changes are occurring faster than ever in Earth's history, which should be reason for caution and even more reason to plan ahead!

    The danger is growing that feedbacks are kicking in with ever greater ferocity, i.e. non-linear change. The image on the right, from an earlier post, illustrates how two self-reinforcing feedback loops can contribute to accelerate the Arctic temperature rise.

    [ click on images to enlarge ]
  • [ see the Extinction page ]
    Tipping Points - An even more dramatic form of non-linear change occurs when tipping points get crossed, and the consequences can be catastrophic for the entire world.

    The above image, from an earlier post, illustrates the danger that, as the latent heat and seafloor methane tipping points get crossed, the ocean temperature will keep rising as huge amounts of methane get released in the Arctic.

    It is essential to assess the danger of events and developments such as heat reaching and destabilizing methane hydrates contained in sediments at the seafloor of the Arctic Ocean, as discussed in many earlier posts such as this one.

    Seafloor methane is one of many elements that could jointly cause a temperature rise of over 10°C, in the process causing the clouds tipping point to get crossed that can push up the temperature rise by a further 8°C, as illustrated by the image on the right, from the extinction page

    Ominously, very high methane levels continue to be recorded at Barrow, Alaska, as illustrated by the NOAA image below.

Conclusion

Alarms bells have sounded loud and clear, such as here, warning that the temperature rise could be more than 3°C as early as in 2026. The precautionary principle should prevail and the looming dangers should prompt people into demanding comprehensive and effective action to reduce the damage and to improve the situation. To combat rising temperatures, a transformation of society should be undertaken, along the lines of this 2022 post in combination with a declaration of a climate emergency.


Links

• Climate Reanalyzer

• The International Research Institute for Climate and Society, Columbia University Climate School 

• Paris Agreement

• International Energy Agency (IEA) - Global energy-related greenhouse gas emissions 2000-2022

• NOAA - Barrow Atmospheric Baseline Observatory, United States
https://gml.noaa.gov/dv/iadv/graph.php?code=BRW&program=ccgg&type=ts

• Transforming Society
https://arctic-news.blogspot.com/2022/10/transforming-society.html

• Climate Plan
https://arctic-news.blogspot.com/p/climateplan.html

• Climate Emergency Declaration
https://arctic-news.blogspot.com/p/climate-emergency-declaration.html


Monday, September 18, 2023

A climate of Insanity

by Andrew Glikson

As the emission of greenhouse gases continues, new fossil fuel projects are subsidized, global warming accelerates, bushfires and floods engulf the planet, climate science is ignored, climate change projections are kept away from the public eye, nations invest in killer submarines rather than water spraying aircraft and other fire-fighting equipment, politicians talk about clean coal, radioactive waters are spilled into the ocean, nuclear weapons are readied for a MAD scenario, the media reports sugar-coated semi or untruths, politicians routinely betray their original pledges and playboy billionaires fire rockets at space with plans to settle on Mars.

Inherent in the nature of insanity is the fact that those inflicted by it are unaware of their mental state, nor are crowds of people or for that matter political parties, and business elites, leading populations to catastrophe, from the scale of Jonestown all the way to Auschwitz and Berlin to Vietnam, Iraq and Afghanistan.

Which has now reached a planet-wide scale. According to NASA former chief climate scientist James Hansen, the global temperature in the current El Niño is exceeding the previous El-Niño (2015-16) temperature rise rate of 0.18°C per decade, reflecting the current increase of the Earth Energy Imbalance (EEI) and accelerated heating. The change is in part due to reductions of the cooling effect of human-emitted aerosols (Figure 1). 

Figure 1. Global temperature (relative to 1880-1920 mean for each month) during the El Niño origin year for the 1997-98, 2015-16 and 2023-24 El Niños. The impact of El Niño on global temperature usually peaks early in the year following the year when the El Niño originated. Hansen et al., 2023.

Despite consequent acidification of the oceans, atmospheric geoengineering using sulphur aerosols, reflecting solar radiation, is touted as a last defence from extreme temperature rise. To date, no effective method has been applied to a drawdown of greenhouse gases on a scale required to compensate for the emissions and rise in atmospheric CO₂ (Figure 2). 
Figure 2. Source: https://ourworldindata.org/fossil-fuels#global-fossil-fuel-consumption

Energy-related greenhouse gas emissions have started to grow again, following minor Covid lockdown-related reductions in 2020 (Figure 3).
Figure 3. Global energy-related greenhouse gas emissions 2000-2022, adapted from EIA.

A rise to a mean global temperature to 3°C and 4°C this century is projected by the IPCCPossibly even before such temperatures are reached, the flow of cold ice melt water from Greenland and Antarctica could lead to transient regional to global temperature reversals (Hansen et al., 1998; Bronselaer et al. 2018). These authors state: “Meltwater from the Antarctic Ice Sheet is projected to cause up to one metre of sea-level rise by 2100 under the highest greenhouse gas concentration trajectory (RCP8.5) considered by the Intergovernmental Panel on Climate Change (IPCC). However, the effects of meltwater from the ice sheets and ice shelves of Antarctica are not included in the widely used CMIP5 climate models, which introduces bias into IPCC climate projections.” (Figure 4)

Figure 4. (a) Model surface air temperature (°C) change in 2055–2060 relative to 1880–1920 for modified
             forcings representint the rise of temperatures in the tropics and decline in subpolar latitudes.
           (b) Surface air temperature (°C) relative to 1880-1920 for several ice melt scenarios, representing stadial
        (cooling) episodes related to the effects of ice melt (Hansen et al., 2016) and associated changes.

According to Hansen et al. (2012) “Burning all fossil fuels would create a different planet than the one that humanity knows. The paleoclimate record and ongoing climate change make it clear that the climate system would be pushed beyond tipping points, setting in motion irreversible changes, including ice sheet disintegration with a continually adjusting shoreline, extermination of a substantial fraction of species on the planet, and increasingly devastating regional climate extremes”.

The habitability of Earth and the future of life are issues that are to a large extent avoided by the largely privately-owned corporate media and even by state media, occupied as they are by advertisements, sports contests, fashion parades, cooking shows and popular frenzies such as recently generated by the kissing of a football cup winner.

Is there a way out for humanity and much of nature?

If the multiple $trillions spent by Sapiens on the military and war were directed to environmental defence, including drawdown of atmospheric greenhouse gases, the possibility exists?


A/Prof. Andrew Y Glikson
Earth and Paleo-climate scientist

Andrew Glikson
Books:
The Asteroid Impact Connection of Planetary Evolution
https://www.springer.com/gp/book/9789400763272
The Archaean: Geological and Geochemical Windows into the Early Earth
https://www.springer.com/gp/book/9783319079073
The Plutocene: Blueprints for a Post-Anthropocene Greenhouse Earth
https://www.springer.com/gp/book/9783319572369
The Event Horizon: Homo Prometheus and the Climate Catastrophe
https://www.springer.com/gp/book/9783030547332
Climate, Fire and Human Evolution: The Deep Time Dimensions of the Anthropocene
https://www.springer.com/gp/book/9783319225111
Evolution of the Atmosphere, Fire and the Anthropocene Climate Event Horizon
https://www.springer.com/gp/book/9789400773318
From Stars to Brains: Milestones in the Planetary Evolution of Life and Intelligence
https://www.springer.com/us/book/9783030106027
Asteroids Impacts, Crustal Evolution and Related Mineral Systems with Special Reference to Australia
https://www.springer.com/us/book/9783319745442
The Fatal Species: From Warlike Primates to Planetary Mass Extinction
https://www.springer.com/gp/book/9783030754679
The Trials of Gaia. Milestones in the evolution of Earth with reference to the Antropocene
https://www.amazon.com.au/Trials-Gaia-Milestones-Evolution-Anthropocene/dp/3031237080