Showing posts with label latent heat. Show all posts

Monday, May 13, 2024

Temperature rise may soon accelerate even more


The April 2024 temperature was 1.32°C higher than 1951-1980, as illustrated by the above image, created with NASA content. Local anomalies are as high as 6.2°C.


The April 2024 temperature was 1.62°C higher than 1900-1930, as illustrated by the above image, created with NASA content. The red line highlights acceleration of the temperature rise (Lowess Smoothing). 

The image below, created with NOAA content, uses a LOESS filter (green line) to highlight the recent acceleration in the temperature rise of the ocean. In this case, the temperature anomaly is calculated versus a 1901-2000 base. 

[ click on images to enlarge ]

The temperature anomaly is even higher when calculated from a pre-industrial base. The image below, created with NASA content, shows that the February 2024 temperature was 1.76°C above 1885-1915, and potentially 2.75°C above pre-industrial (bright yellow inset right). 

[ from earlier post ]

The image below, created with NASA content, shows Land+Ocean monthly mean global temperature anomalies versus a 1900-1923 custom base, further adjusted by 0.99°C to reflect ocean air temperatures, higher polar anomalies and a pre-industrial base. 

[ from earlier post ]
The above image shows a magenta trend that points at the temperature crossing 3°C above pre-industrial later this year (2024). What could be behind such a steep rise? 

Have Feedbacks taken over? 

In April 2024, El Niño conditions were still dominant. Sea surface temperatures have been extremely high recently. The correlation between El Niño and temperature anomalies (from 1901-2000) is illustrated by the image below, created with NOAA content.

[ click on images to enlarge ]

As illustrated by the image below, created with NOAA content, El Niño conditions are no longer dominant. Instead, neutral conditions now prevail and La Niña conditions may develop as early as June-August 2024 (49% chance) or one month later, i.e. July-September (69% chance). 


The extremely high recent temperatures and the trends depicted in the images further above raise the question as to what the underlying driver is, given that we're no longer in an El Niño. Indeed, the question is whether feedbacks have taken over as the main driver causing the temperature rise to further accelerate. 

As mentioned above, the February 2024 temperature could be as much as 2.75°C higher than pre-industrial. The extinction page points out that a 2.75°C rise corresponds with almost ⅕ more water vapor in the atmosphere. This increase in water vapor in the atmosphere is a self-reinforcing feedback loop, since water vapor is a powerful greenhouse gas, further accelerating the temperature rise.

There is no single feedback that could cause the recent steep rise of temperatures and its acceleration, instead there are numerous non-linear, self-amplifying feedback loops that can all contribute, interact and start to kick in with greater ferocity, amplifying and further accelerating the rise. 

Such feedbacks do include more water vapor, as said, as well as stronger wind, waves and storms, more ocean stratification, faster loss of sea ice, faster loss of reflectivity of clouds and more freshwater accumulating at the surface of oceans, due to stronger ice melting, due to heavier runoff from land and rivers and due to changes in wind patterns and ocean currents and circulation.

Furthermore, developments such as rising emissions from industry, transport, land use, forest fires and waste fires, ocean acidification and reductions in sulfur emissions over the past few years all contribute to further acceleration of the temperature rise. 

Two tipping points threaten to get crossed

The danger is huge and the risks are absolutely unacceptable. Current global temperature anomalies are extremely high, as illustrated by the image below, created with a screenshot from Climate Reanalyzer, showing anomalies from 1991-2000. 


The temperature rise is hitting the Arctic harder than elsewhere, as illustrated by the images created with NASA content below and at the top. 


Contributing to these high temperatures in the Arctic are high temperatures of the North Atlantic Ocean, which are now rising rapidly, in line with seasonal changes, as illustrated by the image below, created with Climate Reanalyzer content. 


The above image shows that the North Atlantic sea surface temperature was 21.5°C on May 14, 2024. High North Atlantic sea surface temperatures spell bad news for the Arctic, as much ocean heat gets pushed toward the Arctic from the North Atlantic. North Atlantic sea surface temperatures are now getting pushed up strongly from their annual minimum, in line with seasonal changes. Ominously, a peak of 25.4°C was reached in August 2023, i.e. almost 4°C higher than the current temperature. The question is how high the North Atlantic temperature will reach this year. 

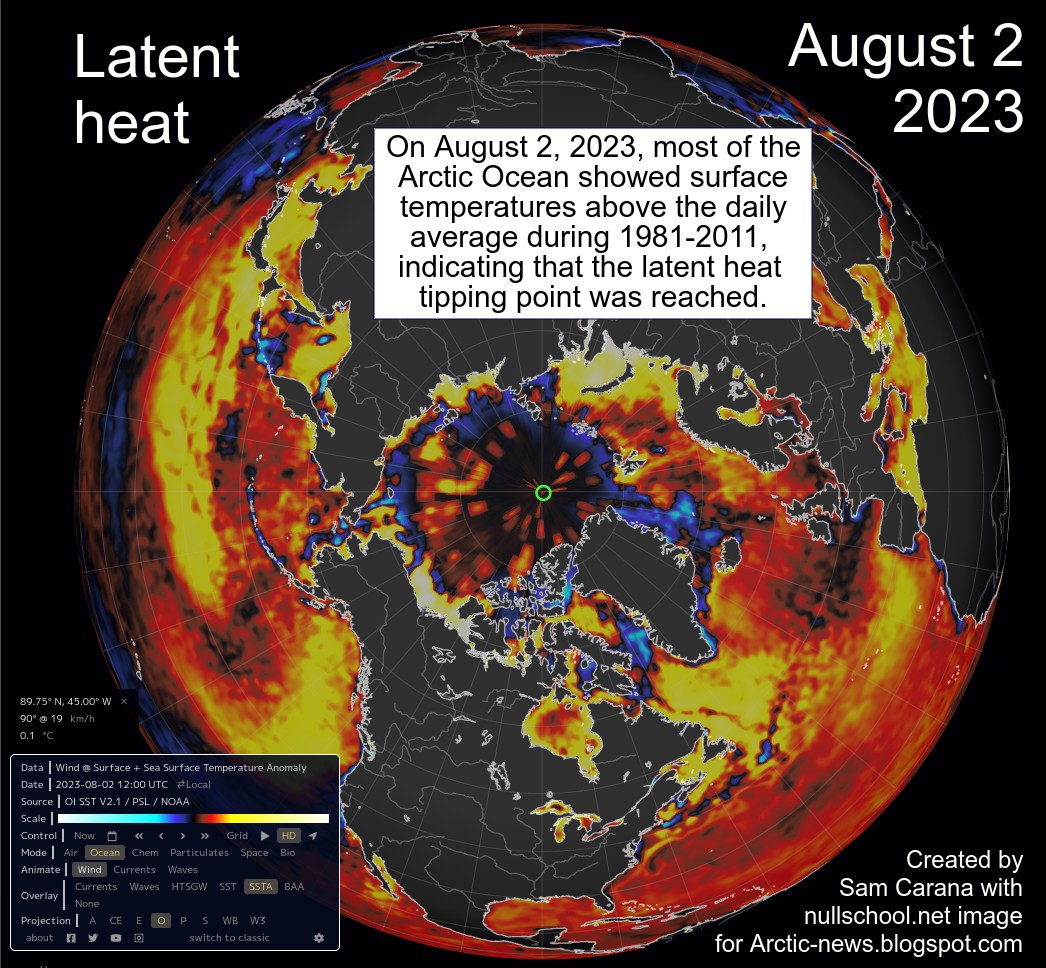
One tipping point that threatens to get crossed is loss of Arctic sea ice. Loss of Arctic sea ice comes with albedo change, which constitutes a huge self-reinforcing feedback loop, i.e. the more sea ice disappears, the more sunlight gets absorbed by the Arctic Ocean, further accelerating sea ice melting, while less sunlight gets reflected back into space.

[ Albedo change, from the Albedo page ]

Next to the albedo loss, there is loss of the latent heat buffer constituted by the sea ice. Latent heat is energy associated with a phase change, in this case the energy consumed as solid ice turns into liquid water (i.e. melts). During a phase change, the temperature remains constant. Sea ice acts as a buffer that absorbs heat, while keeping the temperature at about zero degrees Celsius. As long as there is sea ice in the water, this sea ice will keep absorbing heat, so the temperature doesn't rise at the sea surface.

As long as air temperatures over the Arctic are below freezing, sea ice can persist at the surface, maintaining sea ice extent, which may give the false impression that sea ice was healthy, whereas in fact sea ice has steadily been declining in thickness, as illustrated by the image below, created with Danish Meteorological Institute content, that shows that Arctic sea ice recently reached its lowest annual maximum on record, as also discussed in earlier posts such as this one.  


The amount of energy absorbed by melting ice is as much as it takes to heat up an equivalent mass of water from zero to 80°C. Loss of the latent heat buffer therefore constitutes a tipping point, i.e. once crossed, the Arctic Ocean will heat up at an accelerating pace. 


The above map, created with Danish Meteorological Institute content, shows that much of the thicker sea ice is located away from the North Pole, such as off the east coast of Greenland. This sea ice is likely to melt away quickly as more sunlight starts reaching the Northern Hemisphere and temperatures rise in line with seasonal changes.

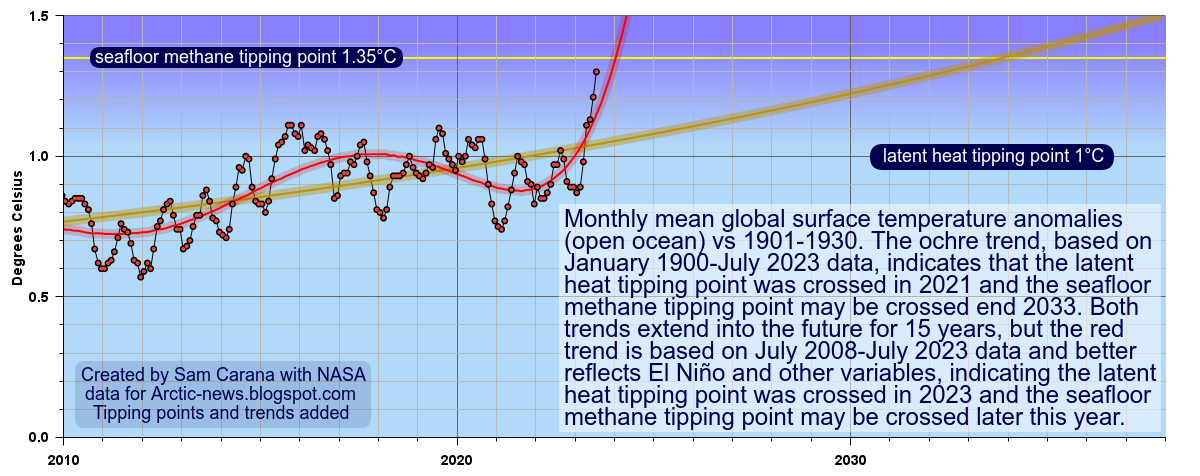
Seafloor methane constitutes a second tipping point. When methane escapes from hydrates that get destabilized by rising temperatures, the methane will expand to 160 times its previous volume and enter the atmosphere with force. Without the buffer constituted by thicker sea ice, an influx of ocean heat could cause large-scale destabilization of hydrates contained in sediments at the seafloor of the Arctic Ocean, resulting in eruptions of huge amounts of methane.

[ from earlier post ]
[ image from the Extinction page ]
On the above image, estimates for these two tipping points are added to Northern Hemisphere Ocean Temperature anomalies vs 1901-2000, created with NOAA data. Furthermore, two trends are added. The magenta trend is based on January 1880-January 2024 data and warns that the Seafloor Methane Tipping Point may be crossed in 2025. The red trend, which is based on January 2010-January 2024 data and better reflects variables such as El Niño, warns that the Seafloor Methane Tipping Point may be crossed in 2024.

Crossing of the latent heat tipping point and the seafloor methane tipping point results in ever more heat reaching and accumulating in the Arctic ocean, destabilizing methane hydrates contained in sediments at the seafloor of the Arctic Ocean, as discussed in many earlier posts such as this one.

Self-amplifying feedbacks and developments as discussed above, as well as crossing of these two tipping points, could all contribute to cause a temperature rise of over 10°C, in the process causing the clouds tipping point to get crossed that can push up the temperature rise by a further 8°C.

Altogether, the temperature rise may exceed 18°C from pre-industrial by as early as 2026, as illustrated by the image on the right, from the extinction page.

Climate Emergency Declaration

The situation is dire and the precautionary principle calls for rapid, comprehensive and effective action to reduce the damage and to improve the situation, as described in this 2022 post, where needed in combination with a Climate Emergency Declaration, as discussed at the Climate Emergency group.


Links

• NASA - datasets and images
https://data.giss.nasa.gov

• Climate Reanalyzer
https://climatereanalyzer.org
https://pulse.climate.copernicus.eu

• NOAA - National Centers for Environment Information
https://www.ncei.noaa.gov

• NOAA - Climate Prediction Center / National Centers for Environmental Prediction
https://www.cpc.ncep.noaa.gov

• Pre-industrial
https://arctic-news.blogspot.com/p/pre-industrial.html

• Extinction
https://arctic-news.blogspot.com/p/extinction.html

• Moistening Atmosphere

• Jet Stream
https://arctic-news.blogspot.com/p/jet-stream.html

• Danish Meteorological Institute - Arctic sea ice thickness and volume
https://ocean.dmi.dk/arctic/icethickness/thk.uk.php

• Cold freshwater lid on North Atlantic
https://arctic-news.blogspot.com/p/cold-freshwater-lid-on-north-atlantic.html

• Arctic Ocean Feedbacks
https://arctic-news.blogspot.com/2017/01/arctic-ocean-feedbacks.html

• Arctic sea ice set for steep decline
https://arctic-news.blogspot.com/2024/03/arctic-sea-ice-set-for-steep-decline.html

• Did the climate experience a Regime Change in 2023?

• Arctic sea ice under threat

• Blue Ocean Event 2024?

• Transforming Society
https://arctic-news.blogspot.com/2022/10/transforming-society.html

• Climate Plan
https://arctic-news.blogspot.com/p/climateplan.html

• Climate Emergency Declaration
https://arctic-news.blogspot.com/p/climate-emergency-declaration.html


Friday, February 2, 2024

Blue Ocean Event 2024?

How likely is an Arctic Blue Ocean Event (BOE) to occur in 2024 or even a Double BOE? The image below is alarming. 


The highest daily sea surface temperatures on record (going back to 1981) were reached in February 2024, even higher than the peaks in 2023. Even higher temperatures may be reached over soon, in March 2024 and April 2024.

As the above image shows, the highest temperatures for the year are typically reached in March. This was the case for the previous years on record, except for 2023 when the current El Niño started to emerge and when the highest peak for the year occurred in August. According to NOAA, the majority of models indicate that this El Niño will persist through March-May 2024. 

Antarctic sea ice extent typically reaches an annual minimum end February, while Arctic sea ice extent typically reaches an annual minimum in September, after a steep decline resulting from more sunlight reaching higher latitudes North and ocean heat reaching a second peak in August.   

Ominously, daily surface air temperatures in the Southern Hemisphere exceeded 17°C recently, something that never happened before in the record going back to 1981. Antarctic sea ice extent typically reaches an annual minimum end February. Loss of sea ice acts as a self-reinforcing feedback loop, accelerating the temperature rise. The daily surface air temperature in the Southern Hemisphere was 17.005°C on Feb 1, 2024, following a peak of 17.01°C on Jan 31, 2024.


Higher temperatures can cause sea ice to melt, even out of season

As illustrated by the image below, adapted from Pidwirny, sunlight does not reach the North Pole until the March Equinox. From that time on, insolation rises steeply. Around the June Solstice, more sunlight reaches the North Pole than anywhere else on Earth. In the image below, insolation is calculated taking into account the combined effects of angle of incidence and day length duration. 

The conclusion is that ocean heat is the main reason why melting of Arctic sea ice can occur early in the year. More specifically, the narrowing of the temperature difference between the Arctic and the Tropics can at times cause strong wind to be present along the path of the Gulf Stream. Rising ocean heat combined with strong wind can cause heat to move abruptly toward the Arctic Ocean, causing sea ice to fall in extent. 

Such an event is illustrated by the image below, adapted from NSIDC. The image shows a drop in sea ice extent at the end of January 2024 (blue), a time of year when Arctic sea ice is still expected to increase in extent and to keep increasing in extent for some time to come (grey). In this case, strong wind may have caused a huge amount of ocean heat that is present in the North Atlantic to move abruptly toward the Arctic Ocean, as discussed in an earlier post

For the time of year, Arctic sea ice extent is currently still extensive, compared to earlier years, which is a reflection of more water vapor in the atmosphere and more precipitation. While sea ice extent is relatively large, sea ice volume is among the lowest of all years on record for the time of year, as illustrated by the image below. 

This indicates that Arctic sea ice is very thin. Ominously, the image below indicates that there is a huge area near the North Pole with very thin sea ice. 


Furthermore, much of the thicker sea ice is located off the east coast of Greenland, which means that this sea ice is likely to melt away quickly as more sunlight starts reaching the Northern Hemisphere and temperatures rise in line with seasonal changes (see the insolation image further above).


The North Atlantic sea surface temperature was 20.4°C on February 15, 2024, i.e. 0.6°C higher than on February 15, 2023.

High North Atlantic sea surface temperatures spell bad news for the Arctic, as much ocean heat gets pushed toward the Arctic from the North Atlantic. 

North Atlantic sea surface temperatures are just starting to heat up from their annual minimum and can be expected to rise strongly, in line with seasonal changes. 

[ click on images to enlarge ]
Ominously, a peak temperature of 25.4°C was reached on Aug.31, 2023, much higher than the peak in any of the preceding years dating back to 1981.

During the six months between the September Equinox and the March Equinox (see image further above), no sunlight is reaching the North Pole. 

Nonetheless, temperature anomalies in the Arctic are already extremely high, due to ocean heat that has entered the Arctic Ocean from the North Atlantic, as illustrated by the two maps on the right and the two maps on the right further below.

Northern Hemisphere Sea Surface Temperature Anomalies were as much as 12.6°C or 22.7°F higher than 1981-2011 on February 15, 2024, locarion marked by the green circle on the image below.


Feedbacks 

Slowing down of AMOC and cooling due to heavier melting of Greenland's ice is causing less ocean heat to reach the Arctic Ocean, while a huge amount of ocean heat is accumulating in the North Atlantic, as it did in 2023. A large part of this heat in the North Atlantic can also be present underneath the sea surface.

These developments occur at the same time as ocean stratification increases (as temperatures rise, see above images), as more freshwater enters the ocean (as a result of more meltwater and of runoff from land and from rivers), and as more evaporation takes place and more rain falls further down the path of the Gulf Stream, all of which can contribute to formation and growth of a cold, freshwater lid at the surface of the North Atlantic.

cold freshwater lid on North Atlantic ]

Furthermore, storms can get stronger as temperatures rise and as changes take place to the Jet Stream. Strong wind can temporarily speed up currents that carry huge amounts of ocean heat with them toward the Arctic Ocean, as discussed in earlier posts such as this one. Much of the ocean heat in the North Atlantic can therefore be pushed abruptly underneath this freshwater lid and flow into the Arctic Ocean. The image below shows that the Jet Stream reached speeds as high as 455 km/h or 283 mph north of Washington on February 18, 2024 03:00 UTC, with Instantaneous Wind Power Density as high as 387.5 kW/m².


The image below shows wind speed at 250 hPa on a background of sea surface temperature anomalies versus 1981-2011. 


The danger is that, due to strong wind along the path of the Gulf Stream, huge amounts of ocean heat will abruptly get pushed into the Arctic Ocean, with the influx of ocean heat causing destabilization of hydrates contained in sediments at the seafloor of the Arctic Ocean, resulting in eruptions of huge amounts of methane.

Changes to the Jet Stream and ocean heat accumulating in the North Atlantic Ocean are both consequences of the overall temperature rise. A distorted Jet Stream can cause an abrupt influx of ocean heat into the Arctic Ocean.

Such additional ocean heat, combined with a steep rise in insolation hitting the Arctic in April and May, may suffice to cause a Blue Ocean Event (BOE) to occur in 2024.

[ click on images to enlarge ]
The far North has the highest temperature anomalies, they can as high as 7.04°C, as the image on the right shows.

A BOE occurs when virtually all sea ice disappears and less than 1 million km² of sea ice remains. As the sea ice disappears, the surface color changes from white (sea ice) to blue (ocean) resulting in far more sunlight getting absorbed by the Arctic Ocean, instead of getting reflected back into space as was previously the case.

Albedo change constitutes a huge self-reinforcing feedback loop, i.e. the more sea ice disappears, the more sunlight gets absorbed by the Arctic Ocean, further accelerating sea ice melting. 

[ Albedo change, from the Albedo page ]

Next to the albedo loss, there is loss of the latent heat buffer constituted by the sea ice. Latent heat is energy associated with a phase change, such as the energy consumed when solid ice turns into water (i.e. melts). During a phase change, the temperature remains constant. Sea ice acts as a buffer that absorbs heat, while keeping the temperature at about zero degrees Celsius. As long as there is sea ice in the water, this sea ice will keep absorbing heat, so the temperature doesn't rise at the sea surface.

The amount of energy absorbed by melting ice is as much as it takes to heat up an equivalent mass of water from zero to 80°C. 

Without the buffer constituted by thicker sea ice, an influx of ocean heat could destabilize hydrates contained in sediments at the seafloor of the Arctic Ocean, resulting in eruptions of huge amounts of methane.

[ click on images to enlarge ]
The above image illustrates these tipping points and Northern Hemisphere Ocean Temperature anomalies vs 1901-2000, created with NOAA data. Trends and tipping point estimates are added. The magenta trend is based on Jan.1880-Jan.2024 data and warns that the Seafloor Methane Tipping Point may be crossed in 2025. The red trend is based on Jan.2010-Jan.2024 data and better reflects variables such as El Niño, and it warns that the Seafloor Methane Tipping Point may be crossed in 2024. 


The above image, adapted from tropicaltidbits.com, shows a forecast for November 2024 of the 2-meter temperature anomaly in degrees Celsius, based on 1984-2009 model climatology. The anomalies are forecast to be very high for the Arctic Ocean.

Many additional feedbacks are active, such as changes to the Jet Stream and slowing down of AMOC, and they could speed up the crossing of such tipping points, as also discussed at the feedbacks page. The danger is that a cascade of events will unfold like a domino effect, leading to extinction of most species, including humans, as the image below warns. 

[ from earlier post - click on images to enlarge ]

Greenhouse gases rising

Meanwhile, concentrations of greenhouse gases keeps rising, as illustrated by the image below. 

The average daily carbon dioxide (CO₂) at Mauna Loa, Hawaii, was 426.21 ppm (parts per million) on February 4, 2024. The weekly average was 425.83 ppm. 

Critical is the rate of change, in particular the rapid rise in temperatures and greenhouse gas concentrations. To find higher CO₂ concentrations, one has to go back millions of years. 


A recent study concludes that: 
- A doubling of CO₂ is predicted to warm the planet a whopping 5°C to 8°C.
- The last time atmospheric CO₂ consistently reached today’s human-driven levels of 420 ppm was 14 million years ago.
- The hottest period was about 50 million years ago, when temperatures were as much as 12°C higher than today.

Climate Emergency Declaration

The situation is dire and the precautionary principle calls for rapid, comprehensive and effective action to reduce the damage and to improve the situation, as described in this 2022 post, where needed in combination with a Climate Emergency Declaration, as discussed at this group.


Links

• Blue Ocean Event
https://arctic-news.blogspot.com/p/blue-ocean-event.html

• Climate Reanalyzer - Daily Sea Surface Temperature, World (60°S-60°N)
https://climatereanalyzer.org/clim/sst_daily

• Pidwirny, M. "Earth-Sun Relationships and Insolation". Fundamentals of Physical Geography, 2nd Edition (2006)
http://www.physicalgeography.net/fundamentals/6i.html

• NOAA - ENSO: Recent Evolution, Current Status and Predictions
https://www.cpc.ncep.noaa.gov/products/analysis_monitoring/lanina/enso_evolution-status-fcsts-web.pdf 

• NSIDC - Arctic sea ice extent
https://nsidc.org/arcticseaicenews/charctic-interactive-sea-ice-graph

• Danish Meteorological Institute - Arctic sea ice volume and thickness
https://ocean.dmi.dk/arctic/icethickness/thk.uk.php

• University of Bremen - Arctic sea ice

• Scripps Institution of Oceanography at UC San Diego.

• Toward a Cenozoic history of atmospheric CO₂ - by The Cenozoic CO₂ Proxy Integration Project (CenCO₂PIP) Consortium


Tuesday, August 15, 2023

Two Tipping Points

The image below, adapted from Climate Reanalyzer, shows that the World Sea Surface Temperature (60°South - 60°North) was at a record high of 21.1°C or 69.98°F for the third day in a row on August 23, 2023. As the image also shows, sea surface temperatures over the past few months have been much higher for the time of year than in any other year on record. 

The image below shows why this recent sea surface temperature rise is so worrying. The image below is based on NASA data for monthly mean global surface temperature anomalies (open ocean) vs 1901-1930. The ochre trend, based on January 1900-July 2023 data, indicates that the latent heat tipping point was crossed in 2021 and the seafloor methane tipping point may be crossed by the end of 2033. Both trends extend into the future for 15 years, but the red trend is based on July 2008-July 2023 data and better reflects El Niño and other variables, and this red trend indicates that the latent heat tipping point was crossed in 2023 and the seafloor methane tipping point may be crossed later this year.

[ click on images to enlarge ]

Sea ice constitutes a latent heat buffer, consuming incoming heat as it melts. While the ice is melting, all energy (at 334 J/g) goes into changing ice into water and the temperature remains at 0°C (273.15K or 32 °F). Once all ice has turned into water, all subsequent energy goes into heating up the water, and will do so at 4.18 J/g for every 1°C the temperature of the water rises. 

[ sea ice thickness, from earlier post ]
Loss of this buffer is linked to subsequent destabilization of methane hydrates. So, there are two tipping points that are linked, and the latent heat tipping point gets crossed in the Arctic before the seafloor methane tipping point gets reached.

The situation is particularly precarious in the Arctic, as the North Atlantic Ocean is very hot and the Gulf Stream keeps pushing hot water toward the Arctic Ocean, while Arctic sea ice has become very thin. The image on the right, from Uni of Bremen, shows that on July 25, 2023, there was virtually no Arctic sea ice left that was more than 30 cm thick. 

The latent heat tipping point is the point where Arctic sea ice loss is such that further incoming ocean heat that was previously consumed as Arctic sea ice melted, instead gets absorbed by the Arctic Ocean. 

[ sea surface temperature anomaly ]
The image on the right, adapted from nullschool.net, shows that on August 2, 2023, most of the Arctic Ocean was showing surface temperatures above the daily average during 1981-2011, indicating that the latent heat tipping point was reached. The latent heat tipping point is estimated to correspond with an ocean temperature anomaly of 1°C above the long term average, 1901-1930 on the above image.

The image underneath, also from nullschool.net, shows the situation on August 20, 2023, when temperatures at the North Pole had been above zero for more than a day and temperatures were forecast to go below zero only twice briefly afterwards, for the period up to August 24, 2023 19:00 UTC (which is as far as the forecast went at the time. 

[ surface temperature ]
This is a further indication that the latent heat tipping point has been reached and that no more heat can be consumed by sea ice melting.

How much sea ice is left? What does the sea ice look like, near the North Pole? Satellite images can give a good impression, but clouds can obscure the view. A clearer view can be obtained by comparing images over several days. 

An animation can reveal how much, or rather how little sea ice is left, and to what extent water of the Arctic Ocean is visible. 

[ Satellite view, click on images to enlarge ]
The animation on the right is made with four NASA Worldview images, showing the situation on August 11, 15, 16 and 19, 2023. 

The second tipping point, the seafloor methane tipping point, occurs as more heat reaches the seafloor where it destabilizes hydrates contained in sediments at the seafloor.

This tipping point comes with multiple self-reinforcing feedback loops, such as explosive growth in methane volume setting off further destabilization, rapid rise of Arctic temperatures, loss of permafrost and loss of albedo, and release of further greenhouse gases.

Crossing of the seafloor methane tipping point will occur later than crossing of the latent heat tipping point, so the seafloor methane tipping point is estimated to correspond with a higher ocean temperature anomaly.

The current situation is particularly precarious in the Arctic, as the North Atlantic Ocean is very hot and the Gulf Stream keeps pushing hot water toward the Arctic Ocean, while Arctic sea ice has become very thin (image right) and the latent heat tipping point has been crossed.

As the temperature of the Arctic Ocean keeps rising, more heat can reach sediments located at the seafloor, since much of the Arctic Ocean is very shallow and sediments at the seafloor of the Arctic Ocean can contain vast amounts of methane.

The danger is that further heat will destabilize hydrates in these sediments, leading to explosive eruptions of methane, as its volume increases 160 to 180-fold when leaving the hydrates, and resulting in huge eruptions of methane both from the destabilizing hydrates and from methane that is present in the form of free gas underneath the hydrates.

[ from earlier post, click on images to enlarge ]

The above image, from an earlier post, illustrates that warnings have been given before about the danger of these two tipping points getting crossed in the Arctic. In the above image, the trends are based on annual sea surface temperature data for the Northern Hemisphere. The seafloor methane tipping point is estimated to get crossed when the ocean temperature anomaly on the Northern Hemisphere goes beyond 1.35°C above its long term average.

The Argo Float 7900549 compilation image below illustrates that the highest water temperatures in the Arctic Ocean can occur at a depth of approximately 100 meters. The image shows temperatures as high as 5°C at that altitude.


Stronger winds along the path of the Gulf Stream can at times speed up sea currents that travel underneath the surface. As a result, huge amounts of hot, salty water can travel from the Atlantic Ocean into the Arctic Ocean, abruptly pushing up temperatures and salinity levels at the bottom of the Arctic Ocean, which in many places is very shallow.


The above image shows details of Argo float 9701007, further illustrating the danger that heat can reach the seafloor. North of Norway, where the water is less than 400 m deep, temperatures higher than 5°C show up throughout the vertical water column, up to August 10, 2023, when temperatures above 11°C were recorded close to the sea surface. The colored inset also shows that greater mixing down of heat occurred from October to December 2022, as the sea ice started to return and seal off the surface, preventing heat transfer from ocean to atmosphere, as also discussed at FAQ #11.

Below is another image adapted from Climate Reanalyzer, showing that the sea surface temperature of the North Atlantic Ocean has for months been much higher for the time of year than it was in previous years on record. Eight causes behind this have been discussed in an earlier post. The image below shows the situation on August 28, 2023, with the North Atlantic sea surface temperature reaching a record high of 25.34°C or 77.61°F. 


The image below, adapted from NOAA, shows how the Gulf Stream is pushing ocean heat toward the Arctic Ocean, while sea surface temperatures show up as high as 33.6°C or 92.48°F on August 17, 2023. 


[ 2022 animation ]
Studies, some of them dating back more than two decades, show that over the shallow East Siberian Arctic Shelf (ESAS) winds at times can mix the water column from the top to the bottom. A 2005 study of the ESAS led by Igor Semiletov recorded water temperatures at the seafloor, in September 2000, of 4.7°C at 20m depth at one location and 2.11°C at 41m depth at another location, with salinity levels of 29.7‰ and of 31.7‰, respectively.

A deformed Jet Stream, in combination with a cyclone, could similarly result in strong winds abruptly pushing a huge amount of heat through the Bering Strait into the Arctic Ocean. 

The animation on the right shows how remnants of Typhoon Merbok were forecast to enter the Arctic Ocean through the Bering Strait from September 17 to 19, 2022.

The image below, adapted from Climate Reanalyzer, shows that the (2-meter) air temperature in the Arctic was 3.79°C on August 25, 2023, a record high for the time of year and 2.08°C higher than the 1979-2011 mean for that day.


The image below illustrates how incoming ocean heat that previously was consumed in the process of melting of the sea ice, is now causing the water of the Arctic Ocean to heat up, with more heat reaching the seafloor of the Arctic Ocean, which has seas that in many places are very shallow.

[ Latent heat loss, feedback #14 on the Feedbacks page ]
Further adding to the danger is that destabilization of methane hydrates can cause huge amounts of methane to erupt with great force in the form of plumes. Consequently, little of the methane can be broken down in the water by microbes, while there is very little hydroxyl in the atmosphere over the Arctic Ocean to break down the methane that enters the atmosphere.

Ominously, some very high methane levels were recorded recently at Barrow, Alaska, as illustrated by the NOAA images below.

The most recent monthly methane average recorded at Barrow, Alaska, is above 2080 parts per billion.

In the video below, Guy McPherson describes the dire situation.


Climate Emergency Declaration

A catastrophe of unimaginable proportions is unfolding. Life is disappearing from Earth and runaway heating could destroy all life. At 5°C heating, most life on Earth will have disappeared. When looking only at near-term human extinction, 3°C will likely suffice.

The situation is dire and is getting more dire every day, which calls for a Climate Emergency Declaration and implementation of comprehensive and effective action, as described in the Climate Plan with an update at Transforming Society.


Links

• Climate Reanalyzer - daily sea surface temperature
https://climatereanalyzer.org/clim/sst_daily

• Climate Reanalyzer - daily 2-meter air temperature
https://climatereanalyzer.org/clim/t2_daily

• NASA - GISS Surface Temperature Analysis
https://earth.nullschool.net

• NOAA - Barrow Atmospheric Baseline Observatory, United States
https://gml.noaa.gov/dv/iadv/graph.php?code=BRW&program=ccgg&type=ts

• Argo Float
https://fleetmonitoring.euro-argo.eu

• Remnants of Typhoon Merbok forecast to enter the Arctic Ocean through the Bering Strait from September 17 to 19, 2022.
Discussed at https://www.facebook.com/SamCarana/posts/10166948876390161, from:
https://arctic-news.blogspot.com/p/cold-freshwater-lid-on-north-atlantic.html

• The East Siberian Sea as a transition zone between Pacific-derived waters and Arctic shelf waters - by Igor Semiletov et al. (2005)
https://agupubs.onlinelibrary.wiley.com/doi/10.1029/2005GL022490

• Sea surface temperature at record high
https://arctic-news.blogspot.com/2023/03/sea-surface-temperature-at-record-high.html

• Record high North Atlantic sea surface temperature