Climate Plan

PAGES AT ARCTIC-NEWS BLOG

Thursday, December 22, 2022

Wild Winter Weather

[ posted earlier at facebook ]
The image on the right shows a forecast of very low temperatures over North America with a temperature of -40 °C / °F highlighted (green circle at center) for December 23, 2022 14:00 UTC. 

As the image shows, temperatures over large parts of North America are forecast to be even lower than the temperature at the North Pole.  

The combination image below illustrates this further, showing temperatures as low as -50.3°C or -58.6°F in Alaska on December 22, 2022 at 17:00 UTC, while at the same time the temperature at the North Pole was -13.6°C or 7.4°F. 


The Jet Stream

The image below shows the Jet Stream (250 hPa) on December 13, 2022, stretched out vertically and reaching the North Pole as well as the South Pole, while sea surface temperature anomalies are as high as 11°C or 19.7°F from 1981-2011 at the green circle. 

The Jet Stream used to circumnavigate the globe within a narrow band from West to East (due to the Coriolis Force), and it used to travel at relatively high speed, fuelled by the temperature difference between the tropics and the poles.

[ posted earlier at facebook ]

The Jet Stream used to circumnavigate the globe within a narrow band from West to East (due to the Coriolis Force), and it used to travel at relatively high speed, fuelled by the temperature difference between the tropics and the poles. 

As the above image shows, the Pacific Ocean is currently cooler at the tropics and warmer further to the north (compared to 1981-2011), which narrows this temperature difference and in turn makes the Jet Stream wavier. Accordingly, the Jet Stream is going up high into the Arctic before descending deep down over North America. 


[ click omn images to enlarge ]
The above image shows Rossby waves, from NOAA. When you see a wave traveling along the surface of water, there are peaks and troughs in the water height. The same happens in the atmosphere with a traveling Rossby wave – as the Rossby wave travels through the atmosphere, the peaks and troughs of the wave produce regions of high and low air pressure.

The image on the right shows air pressure at sea level on December 22, 2022. High sea surface temperatures make air rise, lowering air pressure at the surface to levels as low as 973 hPa over the Pacific. Conversely, a more wavy Jet Stream enables cooler air to flow from the Arctic to North America, raising air pressure at the surface to levels as high as 1056 hPa.

On December 22, 2022, the Jet Stream reached very high speeds over the Pacific, fuelled by high sea surface temperature anomalies. The image on the right shows the Jet Stream moving over the North Pacific at speeds as high as 437 km/h or 271 mph (with a Wind Power Density of 349.2 kW/m², at the green circle). 

The Jet Stream then collides with higher air pressure and moves up into the Arctic, and subsequently descends deep down over North America, carrying along cold air from the Arctic. Deformation of the Jet Stream also results in the formation of circular wind patterns that further accelerate the speed of the Jet Stream. 

The image on the right shows the Jet Stream moving over North America at speeds as high as 366 km/h or 227 mph (green circle). The image also shows high waves in the North Pacific. 

La Niña / El Niño

The low sea surface temperature anomalies in the Pacific Ocean are in line with the current La Niña. 

The fact that such extreme weather events occur while we're in the depth of a persistent La Niña is worrying. The next El Niño could push up temperatures further, which would hit the Arctic most strongly. This would further narrow the difference between temperatures at the Equator and the North Pole, thus making the Jet Stream more wavy, which also enables warm air to move into the Arctic, further accelerating feedbacks in the Arctic.

The image below, from NOAA, indicates that the next El Niño is likely to emerge soon. More about that in the next post. 


Conclusion

The situation is dire and calls for immediate, comprehensive and effective action as described in the Climate Plan


Links

• nullschool

• Jet Stream

• Coriolis Force

• NOAA - What are teleconnections? Connecting Earth's climate patterns via global information superhighways

• Wind Power Density

• Extreme Weather
https://arctic-news.blogspot.com/p/extreme-weather.html

• Feedbacks in the Arctic
https://arctic-news.blogspot.com/p/feedbacks.html

• NOAA - Multivariate ENSO Index Version 2 (MEI.v2)


Friday, December 16, 2022

The short lifespan of technological civilizations and the future of Homo sapiens

by Andrew Glikson

In his book ‘Collapse’ (2011) Jared Diamond portrays the fate of societies which Choose to Fail or Succeed. On a larger scale the Fermi’s paradox suggests that advanced technological civilizations may constitute ephemeral entities in the galaxy, destined to collapse over short periods. Such an interpretation of Fermi’s paradox, corroborated by recent terrestrial history, implies that the apparent absence of radio signals from Milky Way planets and beyond may be attributed to an inherently self-destructive nature of civilizations which reached the ability to propagate radio waves, consistent with Carl Sagan’s views. It can be expected therefore that the number of advanced technological societies in the universe will be proportional to their average lifetime, perhaps lasting no more than a few centuries. Inexplicably, the behavior of Homo “sapiens” reveals the reality of Fermi’s paradox, unless humans can wake up in time.

Since the onset of the Neolithic about ~10,000 years ago open-ended combustion of wood, coal, oil, methane and gas for production of steam power and electricity (Figure 1), and of uranium to generate nuclear power, constrain the life expectancy of industrial civilizations through proliferation of greenhouse gases, alteration of the chemistry of the atmosphere and proliferation of nuclear, chemical and biological weapons, testifying to the relevance of Fermi’s paradox in the 20-21 centuries.

Geological and astronomical studies establish Earth is unique among the terrestrial planets in harboring advanced life forms, including colonial life since as early as ~3.5 billion years ago. Should the fate of Homo sapiens be recorded, history would tell that, while the atmosphere was overheating, oceans acidifying and radioactivity rising, humans never ceased to saturate the atmosphere with greenhouse gases, mine uranium, unleash fatal wars and fire rockets at the planets. All the time indulging in sports games and inundating the airwaves with gratuitous words, false promises, misconstrued assumptions and simple lies ─ betraying their future generations and a multitude of species on the only haven of life known in the solar system.

Fig. 1. A combined night lights image of Earth signifying global civilization. NASA

In a new paper titled ‘Global warming in the pipeline’, Hansen et al. (2022) state: “glacial-to-interglacial global temperature change implies that fast-feedback equilibrium climate sensitivity is at least ~4°C for doubled CO₂ with likely range 3.5-5.5°C. Greenhouse gas (GHG) climate forcing is 4.1 W/m² larger in 2021 than in 1750, equivalent to 2xCO₂ forcing. Global warming in the pipeline is greater than prior estimates. Eventual global warming due to today's GHG forcing alone -- after slow feedbacks operate -- is about 10°C. Human-made aerosols are a major climate forcing, mainly via their effect on clouds ... A hinge-point in global warming occurred in 1970 as increased GHG warming outpaced aerosol cooling, leading to global warming of 0.18°C per decade.

The inevitable consequence is a shift in the position of the Earth’s climate zones, a decline in the Earth’s albedo (a climatologically significant ~0.5 W/m² decrease over two decades), a rise in greenhouse gases at a geologically unprecedented rate of 2-3 ppm/year), acidification of the oceans (by about 26 percent), receding ice sheets, rising sea levels (~20 cm since 1900), changes in vegetation, forests and soils, a shift in state of the climate and mass extinction, with humans are driving around one million species to extinction.

For longer than 50 years few were aware that a rise in atmospheric CO₂ on the scale of ~100 ppm CO₂ at the annual rate of 2 - 3 ppm per year, could lead to the unhabitability of large parts of Earth (The Uninhabitable Earth, by David Wallace-Wells) (Figure 2A). Now we find ourselves surrounded by the consequences ─ hydrocarbon saturation of air and water, runaway global heating, acidification, dissemination of micro-plastics, habitat destruction, radioactive overload, proliferation of chemical weapons ─ In confirmation of the reality of Fermi’s Paradox.
 
But just at the time the world was increasingly overwhelmed by extreme weather events, severe fires and floods, climate scientists were increasingly ignored, replaced by politicians, bureaucrats, economists, strategists and vested interests ignorant of the basic laws of physics and of the principles which control the atmosphere-ocean system. Policies and promises guided by the science have been betrayed and meaningful mitigation and adaptation negated by the opening of new coal mines and gas fields. Cold war strategies violating the United Nation charter were depleting the resources required for mitigation of the looming climate catastrophe. Within a blink of geological eye, at a rate unprecedented since the extinction of the dinosaurs, large regions of Earth were becoming increasingly uninhabitable for a multitude of species, surpassing 350 ppm CO₂ and approaching Miocene (5.3 – 23.0 Ma)-like conditions (Figure 2B). All along humans continued busily developing a veritable doomsday machine near 1300 nuclear warheads-strong threatening release within seconds.
Fig. 2. (A) Upper Holocene temperatures. (B). The Middle Miocene long-term continental (brown) and marine (blue) temperature change. Red arrow points to the present (2022) average global temperature of 13.9°C NOAA.

That humans are capable of committing the most horrendous crimes upon each other, on other species and on nature, including mass exterminations, has been demonstrated during the 20th century by the Nazi concentration camps and by genocidal conflicts such as in Viet Nam, Cambodia, Laos, Rwanda, Yemen, Iraq, Afghanistan, Bosnia, Ukraine ─ the list goes on … 

Fig. 3. Tsar Bomba, exploded above Novaya Zemlya
The ultimate step toward the Fermi’s paradox has been reached following nuclear experiments in New Mexico, Novaya Zemlya (Figure 3), the bombing of Hiroshima and Nagasaki and the rising prospects of a nuclear war, with consequent firestorms, radiation from fallout, a nuclear winter, and electromagnetic pulses looming ever greater. According to a paper by Robock and Toon (2012) ‘Self-assured destruction: The climate impacts of nuclear war’, a thermonuclear war could lead to the end of modern civilization, due to a long-lasting nuclear winter and the destruction of crops. In one model the average temperature of Earth during a nuclear winter, where black smoke from cities and industries rise into the upper stratosphere, lowers global temperatures by 7 – 8° Celsius for several years.

As stated by Hansen et al. (2012): “Burning all fossil fuels would create a different planet than the one that humanity knows. The paleoclimate record and ongoing climate change make it clear that the climate system would be pushed beyond tipping points, setting in motion irreversible changes, including ice sheet disintegration with a continually adjusting shoreline, extermination of a substantial fraction of species on the planet, and increasingly devastating regional climate extremes”.

A nuclear war in the background of carbon saturated atmosphere can only lead to extreme damage to the life support systems of the planet. The propensity of “sapiens” to genocide and ecocide, are hardly masked by the prevailing Orwellian language of politicians in the absence of meaningful action to avert the demise of the biosphere as we know it. Whereas the ultimate consequences of global heating are likely to occur within a century, including temperature polarities including heat waves and regional cooling of ocean regions by ice melt flow from Antarctica and Greenland ice sheets (Gikson 2019), a nuclear war on the scale of the MAD (Mutual Assured Destruction) can erupt on a time scale of minutes …

On July 16, 1945, witnessing the atomic test at the Trinity site, New Mexico, Robert Oppenheimer, the chief nuclear scientist (Figure 4), cited the Hindu scripture of Shiva from the Bhagavad Gita: “Now I am become Death, the destroyer of worlds”. Then, as stated by Albert Einstein: “The splitting of the atom has changed everything, except for man’s way of thinking, and thus we drift into unparalleled catastrophes”.

Andrew Glikson
A/Professor Andrew Glikson

Earth and Paleo-climate scientist
School of Biological, Earth and Environmental Sciences
The University of New South Wales,
Kensington NSW 2052 Australia
16 December 2022

Books:
The Asteroid Impact Connection of Planetary Evolution
https://www.springer.com/gp/book/9789400763272
The Archaean: Geological and Geochemical Windows into the Early Earth
https://www.springer.com/gp/book/9783319079073
Climate, Fire and Human Evolution: The Deep Time Dimensions of the Anthropocene
https://www.springer.com/gp/book/9783319225111
The Plutocene: Blueprints for a Post-Anthropocene Greenhouse Earth
https://www.springer.com/gp/book/9783319572369
Evolution of the Atmosphere, Fire and the Anthropocene Climate Event Horizon
https://www.springer.com/gp/book/9789400773318
From Stars to Brains: Milestones in the Planetary Evolution of Life and Intelligence
https://www.springer.com/us/book/9783030106027
Asteroids Impacts, Crustal Evolution and Related Mineral Systems with Special Reference to Australia
https://www.springer.com/us/book/9783319745442
The Event Horizon: Homo Prometheus and the Climate Catastrophe
https://www.springer.com/gp/book/9783030547332
The Fatal Species: From Warlike Primates to Planetary Mass Extinction
https://www.springer.com/gp/book/9783030754679


Thursday, December 15, 2022

Antarctic sea ice in rapid decline


Earlier this year, on February 25, Antarctic sea ice extent was at an all-time record low of 1.924 million km², as the above image shows. Throughout the year, Antarctic sea ice extent has been low. On December 14, 2022, Antarctic sea ice was merely 9.864 million km² in extent. Only in 2016 was Antarctic sea ice extent lower at that time of year, and - importantly - 2016 was a strong El Niño year.

The NOAA image on the right indicates that, while we're still in the depths of a persistent La Niña, the next El Niño looks set to strike soon.

Meanwhile, ocean heat content keeps rising due to high levels of greenhouse gases, as illustrated by the image on the right. 

Rising ocean heat causes sea ice to melt from below, resulting in less sea ice, which in turn means that less sunlight gets reflected back into space and more sunlight gets absorbed as heat in the ocean, making it a self-reinforcing feedback loop that further speeds up sea ice loss. 

The currently very rapid decline in sea ice concentration around Antarctica is illustrated by the animation of Climate Reanalyzer images on the right, showing Antarctic sea ice on November 16, November 29 and December 15, 2022.

In 2012, a research team led by Jemma Wadham studied Antarctica, concluding that an amount of 21,000 Gt or billion tonnes or petagram (1Pg equals 10¹⁵g) of organic carbon is buried beneath the Antarctic Ice Sheet, as discussed in an earlier post

The potential amount of methane hydrate and free methane gas beneath the Antarctic Ice Sheet could be up to 400 billion tonnes. 

The predicted shallow depth of these potential reserves also makes them more susceptible to climate forcing than other methane hydrate reserves on Earth, describes the news release

“We are sleepwalking into a catastrophe for humanity. We need to take notice right now. It is already happening. This is not a wait-and-see situation anymore," Jemma Wadham said more recently.

The animation on the right shows the thickness of Antarctic sea ice up to December 14, 2022, with 8 days of forecasts added.  

On December 29, 2022, Antarctic sea ice extent was at a record low for the time of the year, at 5.527 million km² (see image on the right). 

Recently, a study discovered a process that can contribute to the melting of ice shelves in the Antarctic, as discussed at the ArcticNews group

Ominously, high concentrations of methane have been recorded over Antarctica recently. The image below shows methane as recorded by the Metop-B satellite on November 28, 2022 pm at 399 mb. 

Global sea ice extent was also at a record low for the time of year on December 29, 2022, at 17.53 million km², as illustrated by the image below, by the National Institute of Polar Research, Japan


The situation is dire and the right thing to do now is to help avoid or delay the worst from happening, through action as described in the Climate Plan.


Links

• NSIDC - Interactive sea ice graph
https://nsidc.org/arcticseaicenews/charctic-interactive-sea-ice-graph

• NOAA - ENSO: Recent Evolution, Current Status and Predictions
https://www.cpc.ncep.noaa.gov/products/analysis_monitoring/lanina/enso_evolution-status-fcsts-web.pdf

• NOAA - ocean heat content
https://www.ncei.noaa.gov/access/global-ocean-heat-content/index.html

• Climate Reanalyzer sea ice concentration
https://climatereanalyzer.org/wx/todays-weather/?var_id=seaice-snowc&ortho=7&wt=1

• Naval Research Laboratory - Antarctic sea ice 
https://www7320.nrlssc.navy.mil/GLBhycomcice1-12/antarc.html

• Potential methane reservoirs beneath Antarctica - Press release University of Bristol (2012)
https://www.bristol.ac.uk/news/2012/8742.html

• Potential methane reservoirs beneath Antarctica - by Jemma Wadham et al. (2012)
https://www.nature.com/articles/nature11374

• A new frontier in climate change science: connections between ice sheets, carbon and food webs

• Ocean variability beneath Thwaites Eastern Ice Shelf driven by the Pine Island Bay Gyre strength - by Tiago Dotto et al.
https://www.nature.com/articles/s41467-022-35499-5

• Metop-B satellite readings

• National Institute of Polar Research, Japan
• Climate Plan
https://arctic-news.blogspot.com/p/climateplan.html


Sunday, December 11, 2022

Politicians for sale

Are politicians for sale? 

How can it be measured whether politicians are for sale and to what extent this occurs? 

One measure of how much looters and polluters are buying politicians could be this: How fast is methane accelerating? 

Rise in methane and rise in temperature

The rise in methane is vitally important, given methane's potential to rapidly push up temperatures. 

Arguably the most important metric related to climate change is surface temperature on land, as illustrated by the image below from an earlier post. The image was created with a July 16, 2022 screenshot from NASA customized analysis plots and shows that the February 2016 (land only) anomaly from 1886-1915 was 2.94°C or 5.292°F.


Extinction

Land-only anomalies are important. After all, most people live on land, where temperatures are rising even faster than they are rising globally, and humans will likely go extinct with a rise of 3°C above pre-industrial, as illustrated by the image below, from an analysis in earlier post.


Note that in the above plot, anomalies are measured versus 1886-1915, which isn't pre-industrial. The image raises questions as to what the temperature rise would look like when using a much earlier base, and how much temperatures could rise over the next few years.

What can be done about it?

The next question is: What can be done about it? To avoid politicians getting bought by looters and polluters, action on climate change is best implemented locally, with Local People's Courts ensuring that implementation is science-based.


Conclusions

The situation is dire and the right thing to do now is to help avoid or delay the worst from happening, through action as described in the Climate Plan and posts at Arctic-news.blogspot.com


Links

• Human Extinction by 2025? 

• NASA customized analysis plots 

• When will we die? 
https://arctic-news.blogspot.com/2019/06/when-will-we-die.html

• Pre-industrial 


Monday, December 5, 2022

Arctic Ocean overheating

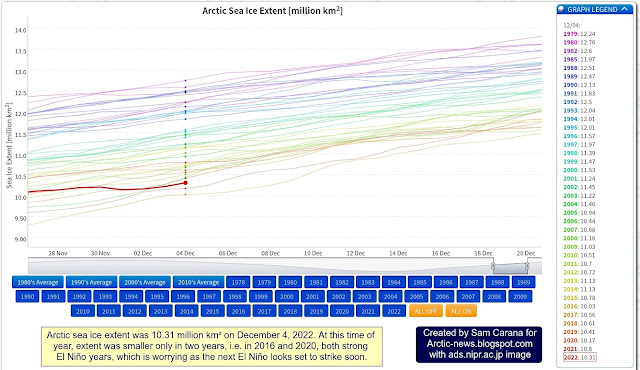
Arctic sea ice extent was 10.31 million km² on December 4, 2022. At this time of year, extent was smaller only in two years, i.e. in 2016 and 2020, both strong El Niño years. With the next El Niño, Arctic sea ice extent looks set to reach record lows. 


The NOAA image on the right indicates that, while we're still in the depths of a persistent La Niña, the next El Niño looks set to strike soon.

The image below shows high sea surface temperature anomalies near the Bering Strait on December 2, 2022, with a "hot blob" in the North Pacific Ocean where sea surface temperature anomalies are reaching as high as 7°C or 12.6°F from 1981-2011. The Jet Stream is stretched out vertically from pole to pole, enabling hot air to enter the Arctic from the Pacific Ocean and from the Atlantic Ocean.


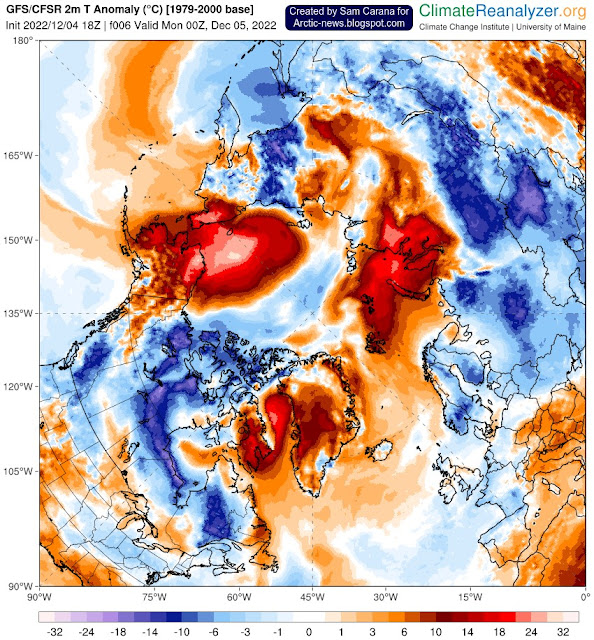
The image below shows a forecast for December 5, 2022, of 2m temperature anomalies versus 1979-2000, with anomalies over parts of the Arctic Ocean near the top end of the scale.


On December 6, 2022, the Arctic was 6.63°C or 11.93°F warmer compared to 1979-2000, as illustrated by the image below. 


The image below shows the daily average Arctic air temperature (2m) from 1979 up to December 6, 2022.


Given that we're still in the depth of a persistent La Niña, these currently very high air temperature anomalies indicate that ocean temperatures are very high and that ocean heat is heating up the air over the Arctic. 

Additionally, ocean heat is melting the sea ice from below. 

Accordingly, Arctic sea ice has barely increased in thickness over the past 30 days, as illustrated by the navy.mil animation on the right.

This leaves only a very short time for Arctic sea ice to grow back in thickness before the melting season starts again, which means that there will be little or no latent heat buffer to consume heat when the melting season starts. 

Furthermore, rising temperatures and changes to the Jet Stream contribute to formation of a freshwater lid at the sea surface at higher latitudes, resulting in further heating up of the Arctic Ocean. 

As a result, more heat threatens to penetrate sediments at the seafloor of the Arctic Ocean that contain vast amounts of methane in hydrates and free gas, and result in abrupt release of huge amounts of methane, dramatically pushing up temperatures globally. 

[ The Buffer has gone, feedback #14 on the Feedbacks page ]

The situation is dire and the right thing to do now is to help avoid or delay the worst from happening, through action as described in the Climate Plan.


Links

• Vishop sea ice extent
https://ads.nipr.ac.jp/vishop/#/extent

• NOAA ENSO: Recent Evolution, Current Status and Predictions
https://www.cpc.ncep.noaa.gov/products/analysis_monitoring/lanina/enso_evolution-status-fcsts-web.pdf

• nullschool.net
https://earth.nullschool.net

• Climate Reanalyzer
https://climatereanalyzer.org

• Naval Research Laboratory - HYCOM Consortium for Data-Assimilative Ocean Modeling
https://www7320.nrlssc.navy.mil/GLBhycomcice1-12/arctic.html

• Albedo, latent heat, insolation and more

• Cold freshwater lid on North Atlantic

Saturday, November 12, 2022

There is no Carbon Budget

[ Sam Carana: "There is no carbon budget!" ]

In the above image, the atmosphere is presented as a "bucket" filling with greenhouse gas pollution from fossil fuel use from 1870 to 2020. The image depicts the idea that there is some carbon budget left, before 1.5°C above pre-industrial will be reached. The Global Carbon Project has just issued an update of what it refers to as the Global Carbon Budget

[ adapted from Global Carbon Budget 2022 ]
The Global Carbon Project insists that there still is some carbon budget left, even as global fossil fuel C₂O emissions in 2021 were higher than 2020, and are projected to be higher again in 2022 than 2021, as illustrated by the image on the right.

Arctic-news has long said that the suggestion of a carbon budget is part of a narrative that polluters seek to spread, i.e. that there was some budget left to be divided among polluters, as if polluters could safely continue to pollute for years to come before thresholds would be reached that could make life uncomfortable, such as a rise of 1.5°C above pre-industrial. 

For starters, an earlier analysis warns that the 1.5°C threshold may have been crossed long ago. The situation looks set to soon become even more catastrophic. The upcoming El Niño could make a difference of more than 0.5°C over the next few years. Additionally, there will be a growing impact of sunspots, forecast to peak in July 2025. 

Arctic-news has long warned about rising temperatures, not only due to high greenhouse gas levels, but also due to a number of events and developments including a rise of up to 1.6°C due to loss of Arctic sea ice and permafrost, and associated changes, a rise of up to 1.9°C due to a decrease in cooling aerosols, and a rise of up to 0.6°C due to an increase in warming aerosols and gases as a result of more biomass and waste burning and forest fires.

More recent posts also warn that the rise could cause the clouds tipping point at 1200 ppm CO₂e to be crossed. Accordingly, the total temperature rise could be as high as 18.44°C from pre-industrial by 2026. Keep in mind that humans are likely to go extinct with a rise of 3°C, as discussed in an earlier post.

[ image from quotes, text from 2013 post ]
So, there is no carbon budget left. There is just a huge amount of carbon to be removed from the atmosphere and oceans, a "debt" that polluters would rather be forgotten or passed on to future generations.

This "debt" has been growing since well before the industrial revolution started. Long ago, people should have started to reduce emissions and remove greenhouse gases, as well as take further action to improve the situation, and Arctic-news has long said that comprehensive and effective action must be taken without delay.

The IPCC has betrayed the very scientific basis it was supposed to reflect

The IPCC keeps insisting that there was a carbon budget, and this goes hand in hand with peddling the notion that the temperature rise was still less than 1.5°C. As discussed in an earlier analysis, the temperature has been rising for thousands of years and may have crossed the 1.5°C mark long ago.

Furthermore, the Paris Agreement instructs the IPCC to specify pathways to limit the rise to 1.5°C. In its arrogance, the IPCC on the one hand keeps insisting that 1.5°C has not been crossed, while on the other hand bluntly refusing to specify credible pathways to keep it that way. The untenability of this attitude is illustrated by a recent UN news release Climate change: No 'credible pathway' to 1.5C limit, UNEP warns.

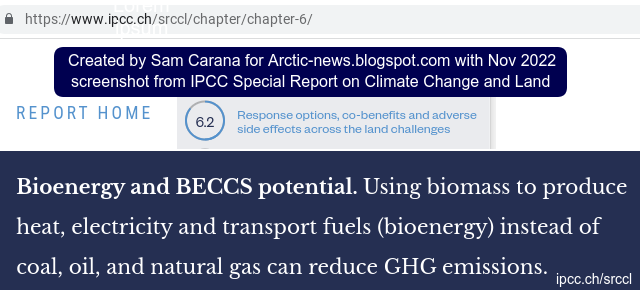
Many studies point at ways improvements could be facilitated, such as by support for solar panels, wind turbines, heat pumps, biochar, vegan-organic food, air taxis, etc. This analysis and this earlier post agree and also conclude that local feebates work best and that it is preferable for decision-making regarding their implementation to be delegated to local communities. The IPCC on the one hand refuses to contemplate policy instruments, yet on the other hand it keeps peddling pet projects pushed by polluters, such as cap-and-trade, nuclear power, CCS, bioenergy and BECCS (bioenergy with carbon capture and storage), as illustrated by the image below. 

[ IPCC keeps peddling pet projects pushed by polluters ]

The IPCC keeps downplaying the potential for a huge temperature rise

The IPCC keeps downplaying developments that could lead to a huge temperature rise. Such developments include:

• Rising greenhouse levels due to more emissions by people and collapse of the biosphere, and due to more emissions from forest, peatlands and waste fires;

• Collapse of the cryosphere, including decline of permafrost, glaciers and sea ice loss and latent heat buffer loss resulting in more clouds over the Arctic, more ocean heat moving into the Arctic Ocean and associated seafloor methane releases;

• Loss of cloud reflectivity and the potential for CO₂e levels to cross the clouds tipping point;

• Loss of the aerosol masking effect;

• More water vapor in the atmosphere in line with rising temperatures and as a result from loss of sea ice.

Altogether, these developments have the potential to raise the temperature by 18.44°C from pre-industrial, as discussed at the extinction page

One of the most harmful ways in which the IPCC has been downplaying the potential for temperatures to rise is by using a too low Global Warming Potential (GWP) for methane. 

This is illustrated by the image on the right, from an earlier post. In the IPCC special report Climate Change and Land a GWP for methane is used of 28 over 100 years to assess the impact of AFOLU (agriculture, forestry, and other land use) versus the impact of fossil fuel, etc. The image illustrates the difference in impact when a GWP for methane of 171 over a few years is used instead.

The IPCC seeks to justify its use of a GWP of 28 by focusing on a pulse of methane over 100 years. The impact of such a pulse declines over the years, since the lifetime of methane is only 11.8 years. However, using a pulse to calculate the impact of the total methane in the atmosphere isn't appropriate, because methane doesn't just disappear, but is constantly replenished, or rather is more than replenished, as illustrated by the image further below. Because of this and because of the potentially huge temperature rise within a few years, it makes more sense to calculate the impact of methane over a short period. Over one year, methane's GWP is 200, as discussed at this page. A GWP of 200 is used in the image below (right axis). 

[ from earlier post ]
Very threatening is a rise in methane that kept following the trend depicted in the above image, created with WMO 2015-2021 global annual surface mean methane abundances, with an added trend that points at a potential mean global abundance of methane of more than 700 ppm (parts per million) CO₂e by the end of 2026. The image warns that, if such a trend kept continuing, the clouds tipping point could be crossed as a result of the forcing of methane alone.
The above NOAA image shows a methane monthly average for November 2022 of more than 1950 parts per billion (ppb) at Mauna Loa, Hawaii.  

Conclusions

The situation is dire and the right thing to do now is to help avoid or delay the worst from happening, through action as described in the Climate Plan and at the recent post Transforming Society.

Links

• Global Carbon Project - Global Carbon Budget 2022 
https://www.globalcarbonproject.org/carbonbudget/index.htm

• The upcoming El Nino and further events and developments (2022) 
https://arctic-news.blogspot.com/2022/11/the-upcoming-el-nino-and-further-events-and-developments.html

• Arctic Methane Monster (2013)
https://arctic-news.blogspot.com/2013/09/arctic-methane-monster.html

• The Clouds Feedback and the Clouds Tipping Point
https://arctic-news.blogspot.com/p/clouds-feedback.html

• Methane levels threaten to skyrocket (2014) 
https://arctic-news.blogspot.com/2014/09/methane-levels-threaten-to-skyrocket.html

• Pre-industrial
https://arctic-news.blogspot.com/p/pre-industrial.html

• Sunspots
https://arctic-news.blogspot.com/p/sunspots.html

• Extinction
https://arctic-news.blogspot.com/p/extinction.html

• NOAA - Global Monitoring Laboratory
https://gml.noaa.gov/dv/iadv

• Methane Keeps rising
https://arctic-news.blogspot.com/2022/10/methane-keeps-rising.html

• When will we die? 
https://arctic-news.blogspot.com/2019/06/when-will-we-die.html

• IPCC - Special Report on Climate Change and Land
https://www.ipcc.ch/srccl

• Climate change: No ‘credible pathway’ to 1.5C limit, UNEP warns 
https://news.un.org/en/story/2022/10/1129912

• Human Extinction by 2025? 
https://arctic-news.blogspot.com/2022/07/human-extinction-by-2025.html

• Climate Plan
https://arctic-news.blogspot.com/p/climateplan.html

• Transforming Society (2022)
https://arctic-news.blogspot.com/2022/10/transforming-society.html


Tuesday, November 8, 2022

The upcoming El Nino and further events and developments

The upcoming El Niño


The above image shows a forecast for August 2023 of the sea surface temperature anomaly in degrees Celsius, from tropicaltidbits.com. The forecast shows temperatures that are higher than average (based on 1984-2009 model climatology) for the tropical Pacific region indicative of an El Niño event. 


By contrast, the above forecast for November 2022 shows temperatures in the tropical Pacific region that are much lower than average, indicating that we're still in the depths of a persistent La Niña. 


By comparison, the above nullschool.net image shows the sea surface temperature anomaly for August 15, 2022, i.e. less than three months ago, when sea surface temperature anomalies in the tropical Pacific region were similar to what they are now, while anomalies in the Arctic were much higher than they are now.

Moving from the bottom of the current La Niña to the peak of a strong El Niño could make a difference of more than half a degree Celsius, as indicated by the image below, adapted from NOAA


The NOAA image on the right confirms that we're still in the depths of a persistent La Niña. NOAA predicts a transition out of La Niña from now on. Note that the NOAA forecast goes up to June/July/August 2023. 

Sunspots

The upcoming El Niño looks set to coincide with a peak in sunspots. The peak in sunspots looks set to reach a higher than expected maximum impact around July 2025. An analysis in an earlier post concludes that the rise in sunspots from May 2020 to July 2025 could make a difference of some 0.15°C.

Accordingly, the impact of the upcoming El Niño could make a difference of more than 0.5°C over the next few years. In addition, there will be a growing impact of sunspots, forecast to peak in July 2025. 

Methane keeps rising at accelerating pace

Furthermore, there are a number of events and developments that could additionally speed up the temperature rise, including greenhouse gas emissions that keep rising. Methane is particularly important, due to its high potency as a greenhouse gas, and its abundance has also been growing at accelerating pace over the past few years. 


The above image, adapted from Copernicus, shows a forecast for November 14, 2022, 03 UTC at 500 hPa, with high levels of methane showing up over the Arctic.


The above image shows a peak methane level of 2687 ppb (parts per billion) recorded by the NOAA-20 satellite at 399.1 mb on November 3, 2022 AM.


The above image shows that recent methane daily averages at Mauna Loa, Hawaii, are between 1900 ppb and 2000 ppb (recent monthly average is above 1950 ppb). 


The above image shows that recent methane daily averages at Barrow, Alaska are even higher, between 2000 ppb and 2100 ppb. 

[ from earlier post ]
Very threatening is a rise in methane that kept following the trend depicted in the above image, created with WMO 2015-2021 global annual surface mean methane abundances, with an added trend that points at a potential mean global abundance of methane of more than 700 ppm (parts per million) CO₂e by the end of 2026. The image warns that, if such a trend kept continuing, the clouds tipping point could be crossed as a result of the forcing of methane alone.  

Further events and developments that could speed up the temperature rise

The rise in methane is alarming and further greenhouse gases also keep rising, such as nitrous oxide, water vapor and carbon dioxide, due to high emissions by people and due to feedbacks that are kicking in, such as forest and waste fires, flooding and further extreme weather events, permafrost loss in the Arctic and reduced carbon sinks. Furthermore, maximum warming occurs about one decade after a carbon dioxide emission, so the full warming wrath of the carbon dioxide emitted over the past decade is still to come, and an extra 0.5°C rise by 2026 seems possible due to carbon dioxide alone. 

[ see the Extinction page ]
When including further events and developments, the clouds tipping point could be crossed in a matter of years and even with far less methane than the above trend warns about. 

As an earlier post mentions, the upcoming temperature rise on land on the Northern Hemisphere could be so high that it will cause much traffic, transport and industrial activity to grind to a halt, resulting in a reduction in aerosols that are currently masking the full wrath of global warming.

The post points at a recent analysis that finds a stronger impact than previously thought for liquid water path adjustment, which supports the 2016 warning that by 2026 there could be a 1.9°C temperature rise due to a decrease in cooling aerosols, while there could be additionally be a 0.6°C temperature rise due to an increase in warming aerosols and gases as a result of more biomass and waste burning and forest fires by 2026. 

Furthermore, the 2016 analysis warns about an additional temperature rise of up to 1.6°C due to loss of Arctic sea ice and permafrost, and associated changes.

When including the temperature rise that has already unfolded from pre-industrial and the impact of all such events and developments, the temperature could rise by more than 10°C over the next few years, corresponding with a CO₂e of over 1200 ppm, which implies that the total temperature rise could be as high as 18.44°C by 2026. 

Keep in mind that humans are likely to go extinct with a rise of 3°C, as illustrated by the image below, from an analysis discussed in an earlier post.


The situation is dire and the right thing to do now is to help avoid or delay the worst from happening, through action as described in the Climate Plan.


Links

• Tropicaltidbits.com 
https://www.tropicaltidbits.com

• nullschool.net 
https://earth.nullschool.net

• NOAA Climate Prediction Center - ENSO: Recent Evolution, Current Status and Predictions
https://www.cpc.ncep.noaa.gov/products/analysis_monitoring/lanina/enso_evolution-status-fcsts-web.pdf


• NOAA National Centers for Environmental Information, State of the Climate: Monthly Global Climate Report for October 2022, retrieved November 16, 2022


• Copernicus methane at 500 hPa, forecast for November 78, 2022, 03 UTC

• NOAA-20 satellite

• NOAA - Global Monitoring Laboratory
https://gml.noaa.gov/dv/iadv


• Invisible ship tracks show large cloud sensitivity to aerosol - by Peter Manhausen et al.
https://www.nature.com/articles/s41586-022-05122-0

• Extinction
https://arctic-news.blogspot.com/p/extinction.html

• When will we die?