High temperatures
The image below shows the temperature anomaly (versus 1951-19801) for May 2025. The large difference in anomalies on and around Antarctica is striking, highlighting the predicament of the West Antarctic Ice Sheet.

 |
| [ click on images to enlarge ] |
So, when using 1903-1912 as a reference, the temperature rise has clearly breached the 1.5°C threshold for the averaging period going back two years through May 2025.
What is the best reference period or base against which the rise is to be measured? An earlier analysis suggests that the rise may be even higher when compared to a genuinely pre-industrial base. What averaging period is most appropriate in analyses that include the temperature rise to come? The issue is discussed below.

The image below shows a polynomial trend, calculated over data from 24 months ago (June 2023) through May 2025, and extended 24 months into the future. It's a cubic trend indicating that the temperature rise may be 3°C in 2026 and 5°C in 2027.
What if an even longer averaging period was used? In the image below, the inset is added to confirm that the temperature rise vs 1903-1912 has been 1.5°C or higher for each of the past 24 months. The trend in the image covers a 30-year averaging period, centered around the end of May 2025. The trend confirms indications that the temperature rise would be high and cross 8°C in 2037 and 10°C in 2039.
In other words, the longer the averaging period, the more the trend will be based on (and may be biased toward) data going further back in the past when temperatures were lower and feedbacks were weaker. As temperatures rise over time, however, feedbacks are likely to get stronger.
Furthermore, tipping points may get crossed and Black Swan Events may occur. As an example, crossing the clouds tipping point at 1200 ppm CO₂ could - on its own - push temperatures up by an additional 8°C globally, which may occur well before 2028 (as discussed further below) and such tipping points should not be ignored. Indeed, much depends on the strength and combined impact of feedbacks and further mechanisms that could accelerate the temperature rise, so the more reason to discuss them in more detail.
Earth's Energy Imbalance has more than doubled in recent decades, and reached 1.8 W/m⁻² in 2023, twice the "best" estimate from the IPCC, after having more than doubled within just two decades, as illustrated by the image below, from Mauritsen (2025).

Below is a video in which Paul Beckwith discusses the study led by Mauritsen. Paul's video has the title: 57 scientists (@46 institutions) co-author 4-page paper ignoring almost all James Hansen's EEI work. James Hansen attributes 1.05 W/m² of the albedo loss to the clouds feedback, 0.15 W/m² to the snow/ice feedback and 0.5 W/m² to changes in shipping regulations (aerosol forcing). James Hansen blames the IPCC for failing to warn about the impact of many feedbacks and further mechanisms that are causing albedo loss. Indeed, the IPCC keeps downplaying the dangers in many ways, such as by ignoring a potentially much higher historic temperature rise and rise to come. Paul Beckwith highlights that the 57 authors of the study are merely calling for a "robust and reliable capability to observe the energy imbalance", without calling for more effective climate action that includes an overhaul of the IPCC narrative.

In the above image, the red line (two-year Lowess Smoothing trend) shows a steep rise that, when extended, points at 2°C above this base (1903-1911) getting crossed in late 2026, implying both goals of the Paris Agreement have been breached, i.e. to limit the temperature increase to 1.5°C above pre-industrial and to limit it to well below 2°C. What type of trend is most appropriate in analyses that include the temperature rise to come? Using a Lowess Smoothing trend and extending that trend linearly into the future may not be the most appropriate way to go.
The image below shows a polynomial trend, calculated over data from 24 months ago (June 2023) through May 2025, and extended 24 months into the future. It's a cubic trend indicating that the temperature rise may be 3°C in 2026 and 5°C in 2027.
 |
| [ A 3°C rise in 2026 and a 5°C rise in 2027? - click on images to enlarge ] |
How bad could 3°C or 5°C be? The image below adds some perspective, it is from the 2019 post When Will We Die?
 |
| [ screenshot from earlier post ] |
Would things look much better when calculating the temperature rise over a longer period?
When using only past data, the average anomaly for the period starting 12 months ago through May 2025 is 1.67°C, for the period starting 24 months ago through May 2025 it is 1.69°C. When using an averaging period starting 10 years ago through May 2025, the average rise is 1.41°C.
Going back further in time can reduce the average, but such an analysis would incorporate unacceptable bias toward past data at the expense of the rise to come. Indeed, the rise to come should not be ignored by selecting an averaging period that only uses past data. Instead, it makes sense to look at both past data and projections into the future and to also take into account potential acceleration of the rise due to compound impact of feedbacks and further mechanisms, as discussed further below.
The image below uses a 20-year averaging period centered around the end of May 2025. If the temperature rise followed a cubic trend based on data going back one decade, the rise averaged over the entire period would be 5.79°C, while the rise would cross 5°C in late 2031 and would cross 8°C at the end of 2034.
 |
| [ click on images to enlarge ] |
 |
| [ click on images to enlarge ] |
There are many conditions contributing to even higher temperatures. Emissions and temperatures have recently been rising at a rate that is unprecedented in history. The temperature rise may accelerate further and there are many conditions, feedbacks and further mechanisms that point at further acceleration.
Earth's Energy Imbalance has more than doubled in recent decades, and reached 1.8 W/m⁻² in 2023, twice the "best" estimate from the IPCC, after having more than doubled within just two decades, as illustrated by the image below, from Mauritsen (2025).

Below is a video in which Paul Beckwith discusses the study led by Mauritsen. Paul's video has the title: 57 scientists (@46 institutions) co-author 4-page paper ignoring almost all James Hansen's EEI work. James Hansen attributes 1.05 W/m² of the albedo loss to the clouds feedback, 0.15 W/m² to the snow/ice feedback and 0.5 W/m² to changes in shipping regulations (aerosol forcing). James Hansen blames the IPCC for failing to warn about the impact of many feedbacks and further mechanisms that are causing albedo loss. Indeed, the IPCC keeps downplaying the dangers in many ways, such as by ignoring a potentially much higher historic temperature rise and rise to come. Paul Beckwith highlights that the 57 authors of the study are merely calling for a "robust and reliable capability to observe the energy imbalance", without calling for more effective climate action that includes an overhaul of the IPCC narrative.
Concentrations and emissions of greenhouse gases are high and rising. The image below shows recent carbon dioxide (CO₂) concentrations at Mauna Loa, Hawaii.


 Crossing the clouds tipping point at 1200 ppm CO₂ could - on its own - push temperatures up by 8°C globally, in addition to the temperature rise caused by the extra CO₂ to reach the tipping point. Moreover, the clouds tipping point is actually at 1200 ppm CO₂e (carbon dioxide equivalent), so when taking into account the impact of growth of other gases, strengthening feedbacks and further mechanisms, this tipping point could be crossed much earlier than in 2028, potentially as early as in 2026.
On top of this, there are numerous self-amplifying feedbacks that can dramatically accelerate the temperature rise and mechanisms are in progress that increase temperatures, such as reductions of aerosols that are currently masking the temperature rise. Not only are many of the feedbacks self-amplifying, strengthening feedbacks and changing conditions can also amplify each other, e.g. a freshwater lid can form at the surface of the North Atlantic and a distorted Jet Stream can combine with hurricanes to cause more ocean heat to get pushed toward the Arctic Ocean underneath this lid, and subsequently speed up sea ice loss and cause eruptions of methane from the seafloor of the Arctic Ocean.


Arctic sea ice is in a bad shape. The image below - adapted from NSIDC.org - shows that on June 24, 2025, Arctic sea ice extent was 9.943 million km², lowest on record for the day.


In the video below, with the title Scientists Shocked, Again, As Ice Disappears, Guy McPherson reflects on news that scientists are shocked to see sea ice disappear.
Black Swan Event 6. Loss of latent heat buffer
The amount of energy absorbed by melting ice is as much as it takes to heat an equivalent mass of water from zero to 80°C. The energy required to melt a volume of ice can raise the temperature of the same volume of rock by as much as 150ºC.
Loss of the latent heat buffer constitutes a tipping point. Beyond a certain point, further ocean heat arriving in the Arctic Ocean from the Atlantic Ocean and the Pacific Ocean will no longer be able to be consumed by melting sea ice from below.
The combination image below shows Arctic sea ice thickness on April 28, 2025 (left), May 13, 2025 (center) and June 13, 2025 (right).
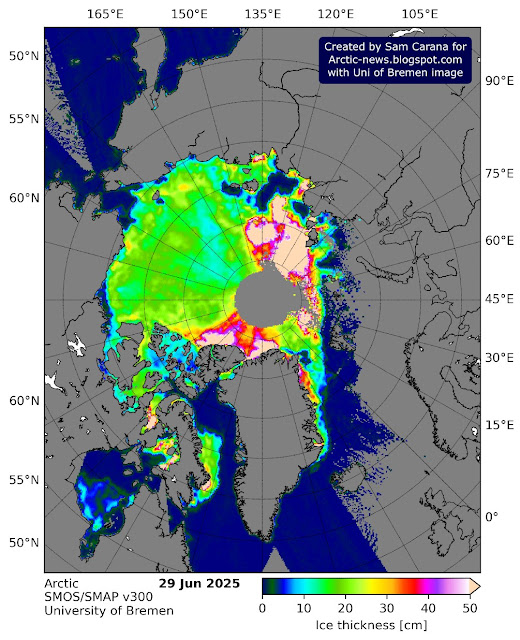
Further incoming heat therefore threatens to instead reach the seafloor of the Arctic Ocean and destabilize methane hydrates contained in sediments at the seafloor, resulting in abrupt eruptions of huge amounts of methane, in turn threatening increased loss of permafrost, resulting in additional emissions, as illustrated by the above image and the image below.
The danger is especially large in the East Siberian Arctic Shelf (ESAS), which contains huge amounts of methane and which is hit strongly by the temperature rise, as described in earlier posts such as this one.
Methane in the atmosphere could be doubled in March 2026 if a trend unfolds as depicted in the image below. A rapid rise is highlighted in the inset and reflected in the trend, which is based on January 2023-October 2024 methane data, as issued in February 2025.
A rise like the one depicted in the trend could eventuate as rising ocean heat destabilizes methane hydrates contained in sediments at the seafloor of the Arctic Ocean. The temperature rise in the Arctic would accelerate since the methane would initially have a huge impact over the Arctic and cause depletion of hydroxyl, of which there is very little in the atmosphere over the Arctic in the first place. Such a rise in methane would also dramatically increase concentrations of ozone in the troposphere and concentrations of water vapor in the stratosphere.
The IPCC has failed to warn about the size of the temperature rise. Higher temperatures imply stronger feedbacks, such as stronger evaporation resulting in both a lot more water vapor and a lot more heat getting transferred from the surface to the atmosphere. Much of this will return to the surface with precipitation such as rain and snow, but 7% more water vapor will end up in the atmosphere for every degree Celsius rise in temperature. Moreover, water vapor is a potent greenhouse gas that will increase temperatures and it is a self-amplifying feedback that can strongly contribute to further acceleration of the temperature rise.
Emissions are rising due to continued consumption of meat and continued burning of fossil fuel, forests, wood and other biofuel. Furthermore, emissions can suddenly increase strongly and rapidly due to fires and lightning strikes, and due to heavy decomposition of biomass as a result of floods, droughts and heatwaves. More extreme weather events can also make vegetation much more vulnerable to pests, diseases and fire hazards. Peatlands, tar sands, boreal forests, rainforests and soil can all start to burn abruptly as temperatures keep rising. In the Arctic, where temperatures are rising rapidly, thawing permafrost can release huge amounts of emissions, including carbon dioxide, methane and nitrous oxide. Soil erosion after fires can cause irreversible loss of topsoil that even heavy rain cannot restore as there is no vegetation left to hold the soil together and flash flooding may cause even more erosion.
Droughts, fires and expansion of agricultural and urban areas can all contribute strongly to forest loss. Once their integrity is compromised, forests become more vulnerable to storms. A 2018 study led by Robinson Negrón-Juárez concludes that strong winds associated with severe convective storms are dominant natural drivers of tree mortality in the Amazon. Researchers led by Evan Gora find that convective storm activity has increased 5%–25% per decade over the past half century. Extrapolating from historic trends, they estimate that storms likely contribute ca. 50% of the reported increases in biomass mortality across Amazonia.
The combination of higher temperatures, stronger wind, more vulnerable forests and more lightning is causing more fires and more emissions of carbon dioxide, black carbon, brown carbon, methane, carbon monoxide and tropospheric ozone. At 3-8 miles height, during the summer months, lightning activity increases NOx by as much as 90% and tropospheric ozone by more than 30%. Tropospheric ozone has a direct warming impact as a greenhouse gas, while carbon monoxide can indirectly cause warming by extending the lifetime of methane.
The image below shows a later forecast, for a location near Raleigh, North Carolina.
The high heat stress experienced at relatively high latitudes on the East Coast of North America in June 2025 was caused by combinations of high temperatures and high levels of relative humidity.


The image on the right shows sea surface temperatures as high as 31.7°C recorded off the coast of North Carolina on June 27, 2025.
Probability is only one out of three dimensions to be used to assess the danger. The longer climate action is delayed, the more the danger will increase, especially when tipping points get crossed, which makes that imminence itself constitutes a second separate dimension calling for climate action. While Black Swan Events may be hard to predict, that is no reason to entirely exclude them from an assessment of the danger. A third dimension is the severity of the compound impact of all mechanisms that are accelerating the temperature rise across the globe. Extreme weather events and Black Swan Events can strike with increasing strength, frequency and duration. There is also an increase in ubiquity, i.e. events can cover larger areas and multiple events can increasingly hit multiple areas at the same time.

Links
• NASA - GISS Surface Temperature Analysis
• Earth's Energy Imbalance More Than Doubled in Recent Decades - by Thorsten Mauritsen et al. (2025)
https://agupubs.onlinelibrary.wiley.com/doi/10.1029/2024AV001636
• NOAA - Daily, Monthly and Weekly Average CO2
• Sunspots
https://arctic-news.blogspot.com/p/sunspots.html
• Kevin Pluck - seaice.visuals.earth
https://seaice.visuals.earth
• NSIDC - Interactive sea ice chart
https://nsidc.org/arcticseaicenews/charctic-interactive-sea-ice-graph
• National Institute of Polar Research Japan
https://ads.nipr.ac.jp
• Climate Reanalyzer
https://climatereanalyzer.org
• NOAA - Climate Prediction Center - ENSO: Recent Evolution, Current Status and Predictions
https://www.cpc.ncep.noaa.gov/products/analysis_monitoring/lanina/enso_evolution-status-fcsts-web.pdf
• NOAA - Climate Prediction Center - El Niño/Southern Oscillation (ENSO) Diagnostic Discussion
https://www.cpc.ncep.noaa.gov/products/analysis_monitoring/enso_advisory/ensodisc.shtml
• Pre-industrial
https://arctic-news.blogspot.com/p/pre-industrial.html
• Contraction of the World's Storm-Cloud Zones the Primary Contributor to the 21st Century Increase in the Earth's Sunlight Absorption - by George Tselioudis et al. (2025)
https://agupubs.onlinelibrary.wiley.com/doi/10.1029/2025GL114882
also discussed on Facebook at:
https://www.facebook.com/groups/arcticnews/posts/10162811999414679
• Storms Are an Important Driver of Change in Tropical Forests - by Evan Gora et al. (2025)
https://onlinelibrary.wiley.com/doi/10.1111/ele.70157
discussed on Facebook at:
https://www.facebook.com/groups/arcticnews/posts/10162939756339679
• Vulnerability of Amazon forests to storm-driven tree mortality - by Robinson Negrón-Juárez et al. (2018)
• University of Bremen - sea ice
https://seaice.uni-bremen.de/start
• Feedbacks in the Arctic
https://arctic-news.blogspot.com/p/feedbacks.html
• NOAA - Office of Satellite And Product Operations - Sea Surface Temperatures
https://www.ospo.noaa.gov/products/ocean/sst/contour/index.html
• Nullschool
• Transforming Society
https://arctic-news.blogspot.com/2022/10/transforming-society.html
• Climate Plan
https://arctic-news.blogspot.com/p/climateplan.html
• Climate Emergency Declaration
https://arctic-news.blogspot.com/p/climate-emergency-declaration.html

The image below shows monthly CO₂ at Mauna Loa, Hawaii.

Some very high CO₂ showed up in surface flasks recently at Mauna Loa, Hawaii, as illustrated by the image below.

Black Swan Event 1. Crossing the clouds tipping point
The image below shows the same monthly data, this time from May 2022 through May 2025, with a trend added that warns about 1200 parts per million (ppm) getting crossed in 2028.

Crossing the clouds tipping point early could be regarded as a Black Swan Event. Black Swan Events are events that are unforeseen in climate models. Such events can suddenly and unexpectedly increase temperatures. While there have been many warnings about such events, they are typically ignored or minimized in climate models. In fact, many warnings about acceleration of the temperature rise are ignored in climate models. Ten black swan events are identified in this post. Since black swan events are inherently unforeseen in climate models, there is little or no discussion about them and there may be many more of them on the way than the ten that are mentioned here.
The situation is also dire regarding other conditions, i.e. concentrations and emissions other than CO₂ are also higher for further gases and aerosols (also fueled by fires and war), while sea ice is low, the Jet Stream is distorted, AMOC is slowing down and sunspots are high.
On top of this, there are numerous self-amplifying feedbacks that can dramatically accelerate the temperature rise and mechanisms are in progress that increase temperatures, such as reductions of aerosols that are currently masking the temperature rise. Not only are many of the feedbacks self-amplifying, strengthening feedbacks and changing conditions can also amplify each other, e.g. a freshwater lid can form at the surface of the North Atlantic and a distorted Jet Stream can combine with hurricanes to cause more ocean heat to get pushed toward the Arctic Ocean underneath this lid, and subsequently speed up sea ice loss and cause eruptions of methane from the seafloor of the Arctic Ocean.
 |
| [ formation of a freshwater lid at the surface of the North Atlantic ] |
There are further tipping points, in addition to the above-mentioned clouds tipping point. Tipping points include loss of Arctic sea ice and loss of the latent heat buffer as Arctic sea ice disappears; crossing such tipping points can abruptly and strongly increase temperatures and thus trigger crossing of further tipping points.
Black Swan Event 2. Early El Niño
Models do not predict the next El Niño to appear soon, as illustrated by the image below. Instead, La Niña conditions are expected to be dominant in the Northern Hemisphere fall and winter 2025-26.
Models do not predict the next El Niño to appear soon, as illustrated by the image below. Instead, La Niña conditions are expected to be dominant in the Northern Hemisphere fall and winter 2025-26.

Nevertheless, the next El Niño may emerge earlier, and it may be a strong El Niño, a Black Swan Event, outside model predictions. Over the past few months, there's been a zigzag pattern of rises and falls in sea surface temperatures in Niño 3.4, an area in the Pacific (inset) that is critical to the development of El Niño, as illustrated by the image below.

On June 20, 2025, the temperature in Niño 3.4 reached 27.99°C, an anomaly of 0.54°C vs 1982-2010. An El Niño event is defined by NOAA as an episode of at least five consecutive 3-month running mean sea surface temperature anomalies vs 1971-2000 surpassing the threshold of 0.5°C in the Niño 3.4 area, as illustrated by the image below.

It is significant that, in the absence of an El Niño, temperatures in 2025 up until now have rivalled the high temperatures reached in 2023 and 2024, with temperatures in 2025 at times exceeding temperatures in 2023 and 2204. This is illustrated by the image below, showing temperatures in 2025 (red line, red dot: June 26, 2025), 2023 (thick grey line), 2024 (orange line), and 1940-1922 (light grey lines).

A new El Niño in combination with further mechanisms, may act as a catalyst, triggering the joint occurrence of several Black Swan Events, as described further below.
Black Swan Event 3. Low sea ice
One feedback of high temperatures and high concentrations of greenhouse gases is loss of sea ice. Polar amplification of the temperature rise is hitting the Arctic hard, and is also causing dramatic loss of Antarctic sea ice. Global sea ice area has been very low over the past few years, as illustrated by the image below, something that wasn't anticipated in climate models. Low global sea ice comes with dramatic loss of albedo, i.e. a lot of sunlight was in previous years reflected back into space and it is now instead getting absorbed by the sea surface. On June 2, 2025, global sea ice area was 17.52 million km², lowest on record for the day.
One feedback of high temperatures and high concentrations of greenhouse gases is loss of sea ice. Polar amplification of the temperature rise is hitting the Arctic hard, and is also causing dramatic loss of Antarctic sea ice. Global sea ice area has been very low over the past few years, as illustrated by the image below, something that wasn't anticipated in climate models. Low global sea ice comes with dramatic loss of albedo, i.e. a lot of sunlight was in previous years reflected back into space and it is now instead getting absorbed by the sea surface. On June 2, 2025, global sea ice area was 17.52 million km², lowest on record for the day.

Arctic sea ice is in a bad shape. The image below - adapted from NSIDC.org - shows that on June 24, 2025, Arctic sea ice extent was 9.943 million km², lowest on record for the day.

The image below - adapted from ads.nipr.ac.jp - shows that Arctic sea ice extent reached a low of 8.94 million km² on June 28, 2025, the lowest on record for the day.

Low sea ice can also be regarded as a Black Swan Event, the more so since there currently is no El Niño present, but instead ENSO-neutral conditions and borderline La Niña conditions currently dominate. Importantly, low sea ice does increase ocean heat, as discussed next.
Black Swan Event 4. Loss of lower clouds
Loss of lower clouds is discussed before at the Clouds Tipping Point (CTP). Crossing the CTP may not take place immediately, but even so, that's no reason to ignore that there has already been loss of albedo (reflective power) due to loss of lower clouds for decades. The refusal to include this loss in climate models warrants its treatment as a separate Black Swan Event.
 |
| [ James Hansen: Inferred contributions to reduced Earth albedo ] |
The image below shows a huge drop in the Earth's albedo over the years and the image on the right, from an earlier post, shows inferred contributions to this drop by Hansen et al.
There is compound impact in that sea ice loss comes with albedo loss that causes more heat to be absorbed by oceans, while higher global sea surface temperatures also cause further loss of lower clouds, further reducing albedo and thus accelerating the temperature rise.
Polar amplification of the temperature rise narrows the temperature difference between the poles and the Equator, which causes distortion of the Jet Stream that in turn results in more extreme weather events. A 2025 study led by Tselioudis suggests that this causes the band of clouds over the Tropics to contract. Since clouds over the Tropics reflect relatively more sunlight, this results in reduced global albedo.

The extraordinary albedo loss depicted in the above image may result in further acceleration of the temperature rise and further occurrence of Blue Ocean Events such as a Blue Ocean Event in the course of 2025, as discussed next.
Black Swan Event 5. Blue Ocean Event
On June 2, 2025, Arctic sea ice area was 2nd lowest on record for that day, only slightly higher than 2016. Significantly, 2016 was a strong El Niño year. On June 2, 2025, Arctic sea ice area was 0.44 million km² lower than on June 2, 2012. If the sea ice area will be 1.34 million km² less than 2012 on September 12 this year, there will be a Blue Ocean Event.

 |
| [ from earlier post ] |
In the video below, with the title Scientists Shocked, Again, As Ice Disappears, Guy McPherson reflects on news that scientists are shocked to see sea ice disappear.
 |
| [ Arctic sea ice concentration ] |
Concentration, volume and thickness are three further measures to assess the state of the Arctic sea ice, and they are critical in regard to the latent heat buffer, which decreases as sea ice, permafrost, ice sheets and glaciers disappear.
The image on the right - adapted from NSIDC.org - shows Arctic sea ice concentration on June 26, 2025.
Latent heat is energy associated with a phase change, such as the energy consumed when ice turns into water. During a phase change, the temperature remains constant. As long as there is ice, additional heat will be absorbed by the process of ice turning into water, so the temperature doesn't rise at the surface.
Latent heat is energy associated with a phase change, such as the energy consumed when ice turns into water. During a phase change, the temperature remains constant. As long as there is ice, additional heat will be absorbed by the process of ice turning into water, so the temperature doesn't rise at the surface.

 |
| [ Arctic sea ice volume, click to enlarge ] |
Warmer water flowing into the Arctic Ocean causes Arctic sea ice to lose thickness and thus volume, diminishing its capacity to act as a buffer that consumes ocean heat entering the Arctic Ocean from the North Atlantic.
This means that - as sea ice thickness decreases - a lot of incoming ocean heat can no longer be consumed by melting the sea ice from below, and the heat will therefore contribute to higher temperatures of the water of the Arctic Ocean.
 |
| [Arctic sea ice volume, click to enlarge ] |
Similarly, there is a point beyond which thawing of permafrost on land and melting of glaciers can no longer consume heat, and all further heat will instead warm up the surface.
The image on the right shows that Arctic sea ice volume has been at a record daily low for more than a year, reflecting severe loss of the latent heat buffer.
Loss of the latent heat buffer constitutes a tipping point. Beyond a certain point, further ocean heat arriving in the Arctic Ocean from the Atlantic Ocean and the Pacific Ocean will no longer be able to be consumed by melting sea ice from below.
The combination image below shows Arctic sea ice thickness on April 28, 2025 (left), May 13, 2025 (center) and June 13, 2025 (right).
 |
| [ Arctic sea ice thickness, click on images to enlarge ] |
The image below shows Arctic sea ice thickness on June 29, 2025.

Black Swan Event 7. Seafloor methane eruptions
Further incoming heat therefore threatens to instead reach the seafloor of the Arctic Ocean and destabilize methane hydrates contained in sediments at the seafloor, resulting in abrupt eruptions of huge amounts of methane, in turn threatening increased loss of permafrost, resulting in additional emissions, as illustrated by the above image and the image below.
 |
| [ The Buffer is gone, from earlier post, click to enlarge ] |
Methane in the atmosphere could be doubled in March 2026 if a trend unfolds as depicted in the image below. A rapid rise is highlighted in the inset and reflected in the trend, which is based on January 2023-October 2024 methane data, as issued in February 2025.
 |
| [ Double the methane in March 2026? Image from earlier post, click on images to enlarge ] |
The image below with high monthly methane recorded at Utqiagvik (Barrow), Alaska, should act as a warning.
 |
| [ discussed earlier on facebook here, click on images to enlarge ] |
The high monthly methane resulted from very high recent hourly methane levels, as illustrated by the image below.
 |
| [ discussed earlier on Facebook here, click on images to enlarge ] |
Black Swan Event 8. Water vapor
The temperature rise itself comes with many self-reinforcing feedbacks such as further loss of snow and ice and changes in clouds, wind patterns and ocean currents, and this can cause rapid additional warming and thus extra water vapor, which also constitutes a self-reinforcing feedback, since water vapor is a potent greenhouse gas.
The IPCC has failed to warn about the size of the temperature rise. Higher temperatures imply stronger feedbacks, such as stronger evaporation resulting in both a lot more water vapor and a lot more heat getting transferred from the surface to the atmosphere. Much of this will return to the surface with precipitation such as rain and snow, but 7% more water vapor will end up in the atmosphere for every degree Celsius rise in temperature. Moreover, water vapor is a potent greenhouse gas that will increase temperatures and it is a self-amplifying feedback that can strongly contribute to further acceleration of the temperature rise.
 |
| [ from April 2024 post, click on images to enlarge ] |
As illustrated by the above image, the temperature rise from pre-industrial to February 2024 could be as large as 2.75°C, which corresponds with almost ⅕ more water vapor in the atmosphere.
Water that previously remained present in the ground, is increasingly moving up into the atmosphere, since a warming atmosphere holds more water vapor and thus sucks up increasingly more water. The water vapor feedback results in more moisture getting sucked up into the air as temperatures rise, a process that is further accelerated by stronger wind as temperatures rise.
More transpiration from vegetation and more evaporation from rivers, lakes and the soil contributes to stronger drought and makes vegetation more vulnerable to pests & diseases and also makes both vegetation and the soil more prone to get burned. After fires, the soils turns black (reflecting less sunlight back into space) and is more vulnerable to erosion and to further droughts and fires, having lost the vegetation that previously held the soil together.
Trees keep the soil together with their roots and also keep the soil cool. Because of the lower temperatures, the soil will also retain more moisture. Trees cool the surface by shading it, by transpiration and by releasing volatile organic compounds into the air that contribute to the formation of clouds that reflect more sunlight back into space and that cause more rainfall. If rainwater can run deep down into the soil along the roots of trees, it helps replenish the groundwater.
The Land Evaporation Tipping Point can get crossed locally when water is no longer available locally for further evapotranspiration, i.e. from all processes by which water moves from the land surface to the atmosphere via evaporation and transpiration, including transpiration from vegetation, evaporation from the soil surface, from the capillary fringe of the groundwater table, and from water bodies on land.
Once this tipping point gets crossed, the land and atmosphere will heat up strongly. Additionally, more water vapor in the atmosphere accelerates the temperature rise, since water vapor is a potent greenhouse gas and this also contributes to speeding up the temperature rise of the atmosphere.
(discussed on facebook here, here and here).
Black Swan Event 9. Abrupt collapse of the West-Antarctic ice sheet
A recent study warns that collapse of the West Antarctic Ice Sheet (WAIS) could contribute over 4 m sea-level rise with little (0.25 °C) or even no ocean warming above present, even without additional carbon emissions. The study concludes that we are likely already at (or almost at) an overshoot scenario and adds that, once on the lower branch, WAIS recovery by tipping back to the upper branch occurs only once the ocean temperature cools between −1.25 and −1.5 °C below present.
In the video below, Paul Beckwith discusses the study.
The very low Antarctic Sea Ice over the past few years was not anticipated by models, neither was the steep rise in sea surface temperatures. Continued loss of Antarctic sea ice could dramatically increase sea surface temperatures where the sea ice disappears. A further rise of global sea surface temperatures could make things worse. The joint impact could cause abrupt collapse of the West Antarctic Ice Sheet.
Black Swan Event 10. More extreme weather events
Emissions are rising due to continued consumption of meat and continued burning of fossil fuel, forests, wood and other biofuel. Furthermore, emissions can suddenly increase strongly and rapidly due to fires and lightning strikes, and due to heavy decomposition of biomass as a result of floods, droughts and heatwaves. More extreme weather events can also make vegetation much more vulnerable to pests, diseases and fire hazards. Peatlands, tar sands, boreal forests, rainforests and soil can all start to burn abruptly as temperatures keep rising. In the Arctic, where temperatures are rising rapidly, thawing permafrost can release huge amounts of emissions, including carbon dioxide, methane and nitrous oxide. Soil erosion after fires can cause irreversible loss of topsoil that even heavy rain cannot restore as there is no vegetation left to hold the soil together and flash flooding may cause even more erosion.
Droughts, fires and expansion of agricultural and urban areas can all contribute strongly to forest loss. Once their integrity is compromised, forests become more vulnerable to storms. A 2018 study led by Robinson Negrón-Juárez concludes that strong winds associated with severe convective storms are dominant natural drivers of tree mortality in the Amazon. Researchers led by Evan Gora find that convective storm activity has increased 5%–25% per decade over the past half century. Extrapolating from historic trends, they estimate that storms likely contribute ca. 50% of the reported increases in biomass mortality across Amazonia.

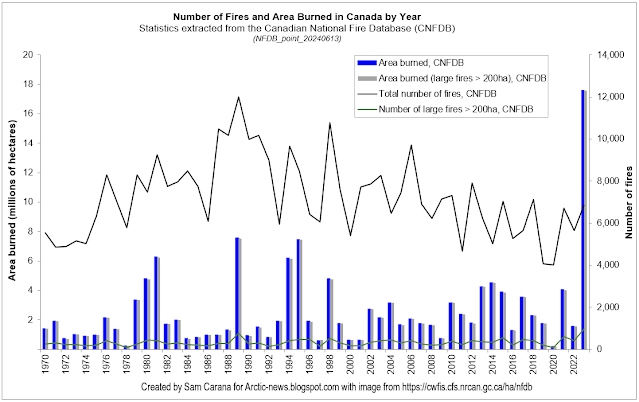
The above image shows annual number of fires and area burned in Canada and is adapted from the Canadian National Fire Database, which adds that while lightning causes about 50% of all fires, it accounts for about 85% of the annual area burned. A 2022 study finds that increases in lightning ignition efficiency, together with a projected doubling of lightning strikes, result in a 39%–65% increase in lightning-caused fire occurrence per 1°C warming.
The combination of higher temperatures, stronger wind, more vulnerable forests and more lightning is causing more fires and more emissions of carbon dioxide, black carbon, brown carbon, methane, carbon monoxide and tropospheric ozone. At 3-8 miles height, during the summer months, lightning activity increases NOx by as much as 90% and tropospheric ozone by more than 30%. Tropospheric ozone has a direct warming impact as a greenhouse gas, while carbon monoxide can indirectly cause warming by extending the lifetime of methane.
The worst wildfires can send smoke high enough to affect the ozone layer in the stratosphere. Damage to the ozone layer and climate change are forming a dangerous feedback loop.
Compound effect of several ignored Black Swan Events
Black Swan Events may be unexpected and they are typically excluded from models that seek to downplay the dangers, but that doesn't mean that Black Swan Events should be ignored. Using non-linear trends may show surprising developments, but at times they can turn out - in hindsight - to be surprisingly accurate, as developments may unfold faster than previously expected, as illustrated by the combination image below.
 |
| [ screenshot from earlier post, click to enlarge ] |
It may take some time for a Black Swan Event to occur, that kind of unpredictability is inherent in the nature of a Black Swan Event, but that's no reason to exclude them from climate models. Black Swan Events may also occur soon and many extreme weather events have already occurred over the years.
Moreover, several Black Swan Events can combine with catastrophic results, so to keep ignoring them does not merely apply to a single event, it amounts to scientific deceit of unimaginable proportions, as it ignores that the very existence of life on Earth is at stake.

The human body can cool itself by sweating and the stronger the wind, the more one can cool off by sweating. As temperatures and humidity levels keep rising, a threshold can be reached where the wind factor no longer matters, in the sense that wind can no longer provide cooling. This physiological limit was long described as a 35°C wet-bulb temperature. i.e. once the wet-bulb temperature reaches 35°C, one can no longer lose heat by perspiration, even in strong wind, but instead the human body will start gaining heat from the air beyond a wet-bulb temperature of 35°C.
Accordingly, a 35°C wet-bulb temperature (equal to 95°F at 100% humidity or 115°F at 50% humidity) was long seen as the theoretical limit, the maximum a human could endure. A 2020 study (by Raymond et al.) warns that this limit could be regularly exceeded with a temperature rise of less than 2.5°C (compared to pre-industrial). A 2022 study (by Vecellio et al.) finds that the actual limit is lower — about 31°C wet-bulb or 87°F at 100% humidity — even for young, healthy subjects. The temperature for older populations, who are more vulnerable to heat, is likely even lower. In practice the limit will typically be lower and depending on circumstances could be as low as a wet-bulb temperature of 25°C.
The image below, adapted from NOAA National Weather Service, shows high heat stress forecast for a location near Williamston, North Carolina, US.
Wet bulb globe temperature : 92°F or 33°C
Temperature : 100°F or 38°C
Apparent Temperature : 110°F or 43°C
Dew Point : 73°F or 23°C
Relative Humidity : 44%
Moreover, several Black Swan Events can combine with catastrophic results, so to keep ignoring them does not merely apply to a single event, it amounts to scientific deceit of unimaginable proportions, as it ignores that the very existence of life on Earth is at stake.
Heat stress is the leading cause of weather-related deaths in the United States, as illustrated by the image below (credit: National Weather Service).

Numbers of heat fatalities may be conservative. Research finds that where heat is being listed as an official cause of death, this likely underestimates the full toll of these events. Extreme heat can trigger heart attacks and strokes. In addition, some heart disease risk factors, such as diabetes—as well as heart medications, such as diuretics and beta blockers—can affect a person’s ability to regulate their body temperature and make it difficult to handle extreme heat. The study finds that extreme heat accounted for about 600-700 additional deaths from cardiovascular disease annually. A study estimates that extreme heat accounted for 12,000 premature deaths in the contiguous U.S. from 2000 to 2010, and an analysis calculates that the summer 2022 heatwave killed 61,000 people in Europe alone.
The human body can cool itself by sweating and the stronger the wind, the more one can cool off by sweating. As temperatures and humidity levels keep rising, a threshold can be reached where the wind factor no longer matters, in the sense that wind can no longer provide cooling. This physiological limit was long described as a 35°C wet-bulb temperature. i.e. once the wet-bulb temperature reaches 35°C, one can no longer lose heat by perspiration, even in strong wind, but instead the human body will start gaining heat from the air beyond a wet-bulb temperature of 35°C.
Accordingly, a 35°C wet-bulb temperature (equal to 95°F at 100% humidity or 115°F at 50% humidity) was long seen as the theoretical limit, the maximum a human could endure. A 2020 study (by Raymond et al.) warns that this limit could be regularly exceeded with a temperature rise of less than 2.5°C (compared to pre-industrial). A 2022 study (by Vecellio et al.) finds that the actual limit is lower — about 31°C wet-bulb or 87°F at 100% humidity — even for young, healthy subjects. The temperature for older populations, who are more vulnerable to heat, is likely even lower. In practice the limit will typically be lower and depending on circumstances could be as low as a wet-bulb temperature of 25°C.
Wet bulb globe temperature : 92°F or 33°C
Temperature : 100°F or 38°C
Apparent Temperature : 110°F or 43°C
Dew Point : 73°F or 23°C
Relative Humidity : 44%
Forecast for : June 24, 2025 18:00 UTC
 |
| [ Forecast 1: High wet bulb globe temperatures at high latitudes in June 2025 ] |
Wet bulb globe temperature : 94°F or 34°C
Temperature : 100°F or 38°C
Apparent Temperature : 117°F or 47°C
Dew Point : 77°F or 25°C
Relative Humidity : 48%
Apparent Temperature : 117°F or 47°C
Dew Point : 77°F or 25°C
Relative Humidity : 48%
Forecast for : June 25, 2025 18:00 UTC
 |
| [ Forecast 2: High wet bulb globe temperatures at high latitudes in June 2025 ] |
The high heat stress experienced at relatively high latitudes on the East Coast of North America in June 2025 was caused by combinations of high temperatures and high levels of relative humidity.
The combination image below shows 'Feels like' temperatures as high as 43.7ºC or 110.06ºF forecast for June 24, 2025 18:00 UTC (at the green circle, image left) and (image right) the Jet Stream forecast to move as fast as at 177 mph or 285 km/h over North America (at the green circle image right), to split over the North Atlantic with one of the branches moving back to the U.S. and down over Mexico.

 |
| [ click on images to enlarge ] |
The image on the right shows a distorted Jet Stream causing wind to move from the North Atlantic to North America at a speed of 60 mph or 97 km/h with SST at 88.2°F or 31.2°C (green circle).
Extreme Weather Events may look like one-off events that may do huge damage, but that have an impact that is temporary. A local emergency may therefore be declared that is temporary. In the case of Black Swan Events, their impact can by contrast increase over time and accelerate, while combinations of events can further augment their impact.
The combination image below shows how the Gulf Stream is pushing hot water north towards the Arctic Ocean, while sea surface temperatures as high as 31.8°C or 89.2°F were recorded off the coast of North Carolina on June 27, 2025 (at green circle, panel left). The Jet Stream (at 250 hPa) reached speeds as high as 302 km/h or 188 mph over New Brunswick (at green circle), and branched out over the North Atlantic with one branch moving backward bringing high humidity and heat to North Carolina (panel right).

 |
| [ Sea surface temperatures, June 27, 2025 ] |
The probability of getting hit by an extreme weather event may seem low, but as temperatures rise, the probability increases.
An increase in the probability that multiple extreme weather events coincide (Jet Stream distortion resulting in both high levels of relative humidity and high temperatures) can thus be regarded as a Black Swan Event, events that are largely ignored by the IPCC and others who seek to downplay the temperature rise. Similarly, a distorted Jet Stream can push ocean heat into the Arctic Ocean, destabilizing sediments at the seafloor that contain huge amounts of methane.
Probability is only one out of three dimensions to be used to assess the danger. The longer climate action is delayed, the more the danger will increase, especially when tipping points get crossed, which makes that imminence itself constitutes a second separate dimension calling for climate action. While Black Swan Events may be hard to predict, that is no reason to entirely exclude them from an assessment of the danger. A third dimension is the severity of the compound impact of all mechanisms that are accelerating the temperature rise across the globe. Extreme weather events and Black Swan Events can strike with increasing strength, frequency and duration. There is also an increase in ubiquity, i.e. events can cover larger areas and multiple events can increasingly hit multiple areas at the same time.
 |
| [ image from earlier post ] |
Indeed, the very continuation of life on Earth is at stake and the sheer potential that all life on Earth may be condemned to disappear due to a refusal by some people to do the right thing, that shouldn't cause people to be stunned, but it should prompt the whole world into rapid and dramatic climate action.
Black Swan Event 11. War, chaos and panic
The image on the right illustrates how such mechanisms could be amplified by a final Black Swan Event, i.e. the threat of war and the associated chaos and panic. As more people start to realize how dire the situation is and as they seek to occupy the last few habitable areas left, more people may stop showing up for work, resulting in a rapid loss of the aerosol masking effect, as industries that now co-emit cooling aerosols (such as sulfates) come to a grinding halt (see reductions in cooling aerosols).
As it becomes harder to obtain food and fuel for cooking and heating, and as the grid shuts down due to conflicts and people no longer showing up for work, many people may start collecting and burning more wood, decimating the forests that are left and resulting in more emissions that further speed up the temperature rise.
As temperatures rise, huge fires could also break out not only in forests, peatlands and grassland, but also in urban areas (including backyards, landfills and buildings, in particular warehouses containing flammable materials, chemicals and fluorinated gases), further contributing to more emissions that speed up the temperature rise.
As the likeliness of further accelerating warming, the severity of its impact, and the ubiquity and the imminence with which it will strike all become more clear and manifest—the more sobering it is to realize that a mere 3°C rise may suffice to cause human extinction.
 |
| [ from the Extinction page ] |
As it becomes harder to obtain food and fuel for cooking and heating, and as the grid shuts down due to conflicts and people no longer showing up for work, many people may start collecting and burning more wood, decimating the forests that are left and resulting in more emissions that further speed up the temperature rise.
As temperatures rise, huge fires could also break out not only in forests, peatlands and grassland, but also in urban areas (including backyards, landfills and buildings, in particular warehouses containing flammable materials, chemicals and fluorinated gases), further contributing to more emissions that speed up the temperature rise.
As the likeliness of further accelerating warming, the severity of its impact, and the ubiquity and the imminence with which it will strike all become more clear and manifest—the more sobering it is to realize that a mere 3°C rise may suffice to cause human extinction.
Climate Emergency Declaration
The situation is dire and the precautionary principle calls for rapid, comprehensive and effective action to reduce the damage and to improve the situation, as described in this 2022 post, where needed in combination with a Climate Emergency Declaration, as discussed at this group.
The situation is dire and the precautionary principle calls for rapid, comprehensive and effective action to reduce the damage and to improve the situation, as described in this 2022 post, where needed in combination with a Climate Emergency Declaration, as discussed at this group.

Links
• NASA - GISS Surface Temperature Analysis
https://data.giss.nasa.gov/gistemp
• Paris Agreement
https://unfccc.int/sites/default/files/english_paris_agreement.pdf
• When Will We Die?
https://arctic-news.blogspot.com/2019/06/when-will-we-die.html
• Paris Agreement
https://unfccc.int/sites/default/files/english_paris_agreement.pdf
• When Will We Die?
https://arctic-news.blogspot.com/2019/06/when-will-we-die.html
• Earth's Energy Imbalance More Than Doubled in Recent Decades - by Thorsten Mauritsen et al. (2025)
https://agupubs.onlinelibrary.wiley.com/doi/10.1029/2024AV001636
discussed on Facebook at:
https://www.facebook.com/groups/arcticnews/posts/10162759302779679/?comment_id=10162759968059679&reply_comment_id=10162767166574679
• NOAA - Monthly Average Mauna Loa CO2
https://gml.noaa.gov/ccgg/trends/mlo.html
• NOAA - Monthly Average Mauna Loa CO2
https://gml.noaa.gov/ccgg/trends/mlo.html
• NOAA - Daily, Monthly and Weekly Average CO2
• NOAA - Global Monitoring Laboratory
• NOAA - Oceanic Niño Index (ONI)
https://www.ncei.noaa.gov/access/monitoring/enso/sst#oni
• NOAA (National Oceanic and Atmospheric Administration), National Weather Service
https://digital.weather.gov
• Clouds Tipping Point
https://arctic-news.blogspot.com/p/clouds-feedback.html
• Arctic Blue Ocean Event 2025?
• NOAA (National Oceanic and Atmospheric Administration), National Weather Service
https://digital.weather.gov
• Clouds Tipping Point
https://arctic-news.blogspot.com/p/clouds-feedback.html
• Arctic Blue Ocean Event 2025?
• Sunspots
https://arctic-news.blogspot.com/p/sunspots.html
• Kevin Pluck - seaice.visuals.earth
https://seaice.visuals.earth
• NSIDC - Interactive sea ice chart
https://nsidc.org/arcticseaicenews/charctic-interactive-sea-ice-graph
• National Institute of Polar Research Japan
https://ads.nipr.ac.jp
• Climate Reanalyzer
https://climatereanalyzer.org
• NOAA - Climate Prediction Center - ENSO: Recent Evolution, Current Status and Predictions
https://www.cpc.ncep.noaa.gov/products/analysis_monitoring/lanina/enso_evolution-status-fcsts-web.pdf
• NOAA - Climate Prediction Center - El Niño/Southern Oscillation (ENSO) Diagnostic Discussion
https://www.cpc.ncep.noaa.gov/products/analysis_monitoring/enso_advisory/ensodisc.shtml
• Pre-industrial
https://arctic-news.blogspot.com/p/pre-industrial.html
• Contraction of the World's Storm-Cloud Zones the Primary Contributor to the 21st Century Increase in the Earth's Sunlight Absorption - by George Tselioudis et al. (2025)
https://agupubs.onlinelibrary.wiley.com/doi/10.1029/2025GL114882
also discussed on Facebook at:
https://www.facebook.com/groups/arcticnews/posts/10162811999414679
• Storms Are an Important Driver of Change in Tropical Forests - by Evan Gora et al. (2025)
https://onlinelibrary.wiley.com/doi/10.1111/ele.70157
discussed on Facebook at:
https://www.facebook.com/groups/arcticnews/posts/10162939756339679
• Vulnerability of Amazon forests to storm-driven tree mortality - by Robinson Negrón-Juárez et al. (2018)
discussed on Facebook at:
https://www.facebook.com/groups/arcticnews/posts/10162939756339679
https://www.facebook.com/groups/arcticnews/posts/10162939756339679
• University of Bremen - sea ice
https://seaice.uni-bremen.de/start
• Feedbacks in the Arctic
https://arctic-news.blogspot.com/p/feedbacks.html
• NOAA - Office of Satellite And Product Operations - Sea Surface Temperatures
https://www.ospo.noaa.gov/products/ocean/sst/contour/index.html
• Nullschool
https://earth.nullschool.net
• Jet Stream
https://arctic-news.blogspot.com/p/jet-stream.html
• Cold freshwater lid on North Atlantic
https://arctic-news.blogspot.com/p/cold-freshwater-lid-on-north-atlantic.html
• Arctic Blue Ocean Event 2025?
https://arctic-news.blogspot.com/2025/03/arctic-blue-ocean-event-2025.html
• Accelerating Temperature Rise
https://arctic-news.blogspot.com/p/threat.html
• Feedbacks (including the Water Vapor Feedback)
https://arctic-news.blogspot.com/2024/07/feedbacks.html
• Extinction
https://arctic-news.blogspot.com/p/extinction.html
• Antarctic Ice Sheet tipping in the last 800,000 years warns of future ice loss - by David Chandler et al.
• Feedbacks (including the Water Vapor Feedback)
https://arctic-news.blogspot.com/2024/07/feedbacks.html
• Extinction
https://arctic-news.blogspot.com/p/extinction.html
• Antarctic Ice Sheet tipping in the last 800,000 years warns of future ice loss - by David Chandler et al.
discussed on Facebook at:
https://www.facebook.com/groups/arcticnews/posts/10162776578519679
• Future increases in lightning ignition efficiency and wildfire occurrence expected from drier fuels in boreal forest ecosystems of western North America - by Thomas Hessilt et al. (2022)
https://www.facebook.com/groups/arcticnews/posts/10162776578519679
• Future increases in lightning ignition efficiency and wildfire occurrence expected from drier fuels in boreal forest ecosystems of western North America - by Thomas Hessilt et al. (2022)
https://iopscience.iop.org/article/10.1088/1748-9326/ac6311
discussed on Facebook at
https://www.facebook.com/groups/arcticnews/posts/10159942902794679
discussed on Facebook at
https://www.facebook.com/groups/arcticnews/posts/10159942902794679
• Transforming Society
https://arctic-news.blogspot.com/2022/10/transforming-society.html
• Climate Plan
https://arctic-news.blogspot.com/p/climateplan.html
• Climate Emergency Declaration
https://arctic-news.blogspot.com/p/climate-emergency-declaration.html